


- Volume trading is about using trading volume to gauge buying or selling pressure in the market, helping traders predict potential price movements.
- Key volume indicators include On Balance Volume (OBV), Chaikin Money Flow (CMF), Klinger Oscillator, Accumulation/Distribution (A/D), and Tick Volume, each offering unique insights into trading activity.
- Traders can use volume strategies to trade low-volume ranging markets, spot breakouts with high trading volumes, identify reversals with volume surges and capitalize on trading volume spikes during news events.
In trading, volume is a key indicator of how liquid and active the market is. That being the case, understanding how volume works in the stock market, futures, and forex can help you anticipate breakouts, reversals, or trend continuation and help you improve your win rate.
In this article, we will dive deep into everything you need to know about volume trading, from the popular types of volume indicators to how to trade different market conditions.
What are Volume Trading Strategies?
Volume trading is built on the premise that high or low trading volume can serve as an indication of the prevailing buying or selling pressure within the market. Essentially, it’s a way of gauging money flow. By scrutinizing volume data, traders aim to foresee potential price movements, gaining an edge in the tumultuous landscape of financial markets.
One of the fundamental approaches to volume analysis is the identification of patterns in the volume data. This involves observing how trading volume changes over time. Doing so helps traders glean valuable insights into market sentiment and potential price movements. They often do so by observing the average trading volume of a specific asset or using various technical indicators.
Here’s what a simple volume indicator looks like on a price chart:
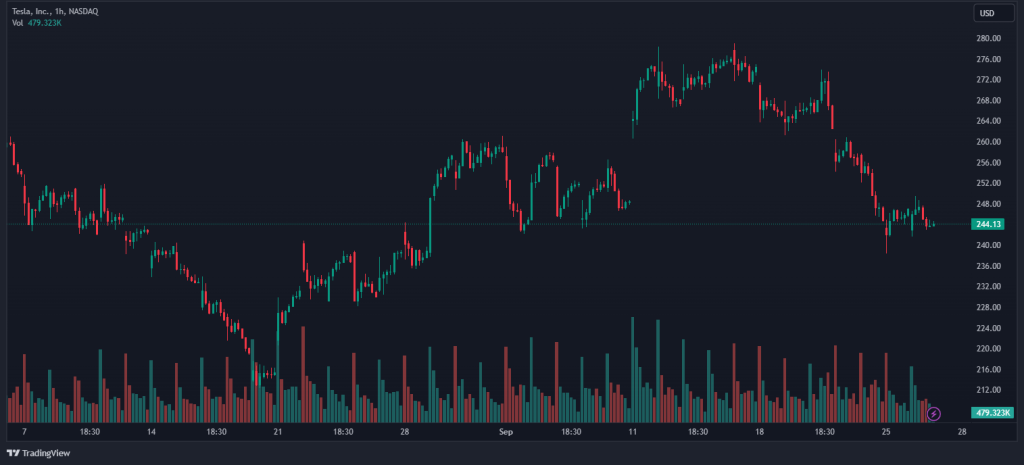
So, a gradual increase in trading volume over several trading sessions may indicate growing interest in a particular asset. This could suggest an impending price breakout. Conversely, a declining volume trend might signify waning market interest and the possibility of a trend reversal or a market entering a sideways market mode.
Additionally, as you can see in the Tesla 1H chart above, trading volume is consistently higher when the market opens. Consequently, many use the high trading volume at the beginning of the day to utilize the Opening Range Breakout strategy.
Overall, volume indicators are indispensable tools in the arsenal of a volume trader. These indicators, such as On-Balance Volume (OBV), Accumulation/Distribution Index (A/D), the Volume Weighted Average Price (VWAP), and so on, provide a structured framework for interpreting volume data. They offer a quantitative approach to understanding market dynamics.
To enhance the reliability of trading signals, traders often combine volume indicators with other technical tools like moving averages and trend lines. This synergy allows traders to corroborate their analyses and make more confident decisions.
All in all, the idea of volume in trading is pretty simple. High trading volume means that buying pressure is increasing and vice versa. However, it does not necessarily mean that you should not trade when there’s low trading volume in the market. In fact, some traders prefer markets with low trading volume as these are less volatile and, therefore, less predictable.
This way or the other, monitoring trading volume is crucial to understanding market dynamics and activity.
Why Does Volume Matter in Trading?
Volume represents the level of activity within a market. It is the metric that quantifies the number of units or shares of an asset that have changed hands during a specified timeframe. So, obviously, it has a huge impact on the asset’s price. It simply tells how attractive the asset is.
It can also explain how financial bubbles are created. Some famous examples of how volume has influenced the price of financial assets include Bitcoin, GameStop stock short squeeze, and pretty much every stock market bubble.
In stocks, volume signifies the total number of shares that have been bought and sold within a given period. This metric is instrumental in determining the liquidity of a particular stock. High trading volumes often suggest robust interest and active participation in stock, while low volumes may signify stagnation or a lack of market interest.
In forex trading, volume takes on a unique perspective. Unlike stock markets with centralized exchanges that provide accurate volume data, forex operates over-the-counter (OTC). As a result, determining precise overall trading volume is a bit more complex.
Still, some forex trading platforms, such as TradingView and MetaTrader 4 and 5, do display volume data. However, it’s essential to understand that this volume is derived from the data feed used by the platform. Each retail forex broker has its own aggregated trading volume, which may vary from one platform to another.
What sets Forex apart is the concept of tick volume. Unlike traditional volume metrics used in stock markets, forex relies on tick volume. But what exactly is tick volume?
In essence, tick volume measures the total number of price movements, or “ticks,” as currency pair prices fluctuate. These ticks represent fractional changes in price and serve as the foundation for volume measurement in forex. The logic is simple: the greater the number of ticks, the higher the volume of trading activity, and vice versa.
For instance, if you observe a currency pair’s price moving through a series of small incremental changes, each of those price changes contributes to the tick volume. This mechanism enables traders to gauge the intensity of trading activity within the forex market.
Now that we’ve explored how volume is measured differently across various markets, it’s crucial to highlight why volume matters in trading:
- Liquidity Gauge: In stocks and futures – volume helps traders assess the ease with which they can buy or sell a particular stock. In forex, it hints at the liquidity of currency pairs, indicating whether they are actively traded or experiencing lower market participation.
- Price Confirmation: Volume often corroborates price movements. In both stocks and forex, a surge in volume accompanying a price move can validate the strength of that move. Conversely, low volume during a price change may signal potential reversals or false signals.
- Market Sentiment: High trading volumes can signify market sentiment. Assuming that price and volume are correlated, whenever you see high trading volume, you can usually interpret that as an increasing or decreasing interest in the particular asset.
Price action is king, but volume is the queen of the market.
Best Technical Indicators to Measure Volume
When it comes to volume trading strategies, the tools at your disposal can make all the difference. These indicators are instrumental in helping traders make informed decisions and optimize their trading strategies.
1. On Balance Volume (OBV)
On-Balance Volume (OBV) is a straightforward yet powerful indicator that leverages changes in trading volumes to forecast stock prices. The concept behind OBV, much like the Volume Price Trend indicator, is rooted in the idea that there is a direct correlation between volume and price movement. Here’s how it works:
The OBV line tracks the cumulative volume, with each day’s volume either added or subtracted, depending on whether the closing price is higher or lower than the previous day.
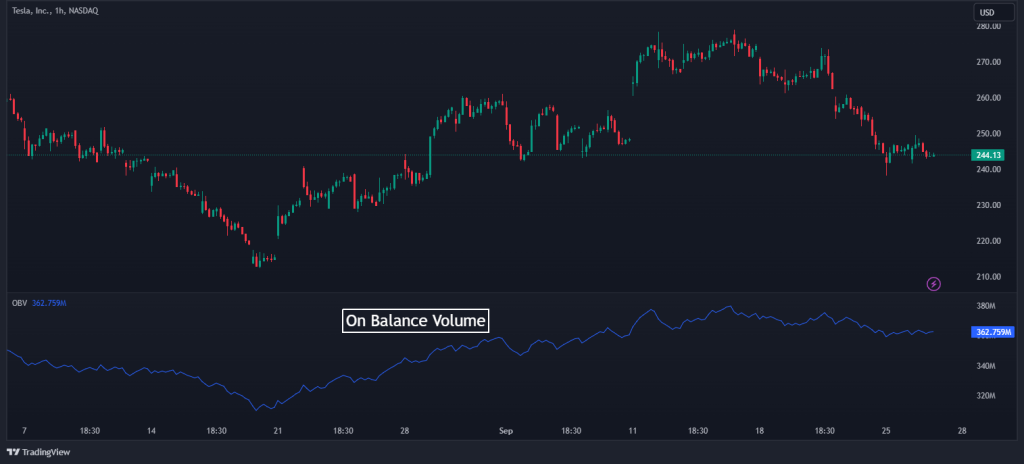
The direction of the OBV line is a key signal for traders. When the OBV line is rising, it signifies a bullish trend, indicating strong buying pressure. Conversely, a declining OBV line suggests a bearish trend with selling pressure dominating.
OBV provides traders with a valuable tool for gauging price momentum, helping them identify potential entry and exit points in the market.
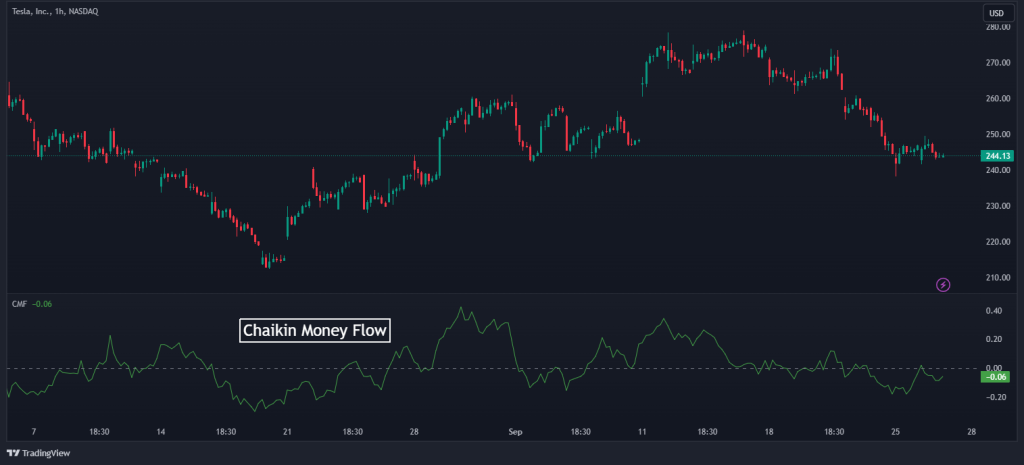
2. Chaikin Money Flow (CMF)
Chaikin Money Flow (CMF), named after the renowned trader Marc Chaikin, is another invaluable volume indicator. It serves as a barometer for determining whether buying or selling pressure is prevailing in the market. Here’s how it works:
CMF looks at the relationship between the closing price of a stock and its daily trading range. If the closing price is closer to the high, it indicates accumulation or buying pressure. On the other hand, if the closing price is closer to the low, it signifies selling pressure.
CMF gives traders a clear picture of the market sentiment and helps them make informed decisions based on the prevailing pressure.
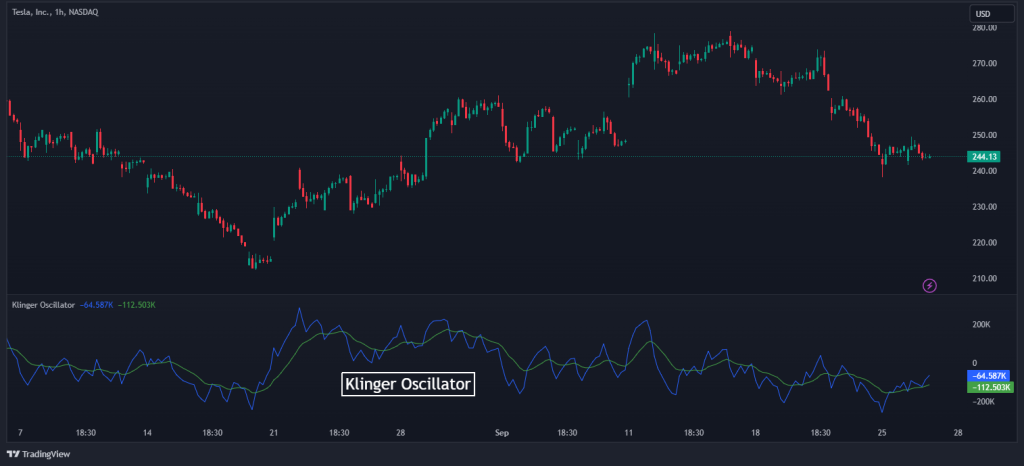
3. Klinger Oscillator
The Klinger Oscillator is a sophisticated volume indicator that goes beyond the simplicity of OBV. It compares volumes with price movements and converts the result into an oscillator. This oscillator assists traders in predicting price reversals with precision.
The Klinger Oscillator identifies long-term money flow trends for specific securities, offering insights into whether an asset is being accumulated or distributed.
4. Accumulation/Distribution (A/D)
The Accumulation/Distribution (A/D) indicator calculates the cumulative volume of a currency pair over time. Here’s how it works:
A/D determines whether the currency pair is experiencing accumulation (buying) or distribution (selling) by comparing the currency pair’s closing price to the price bar’s range.
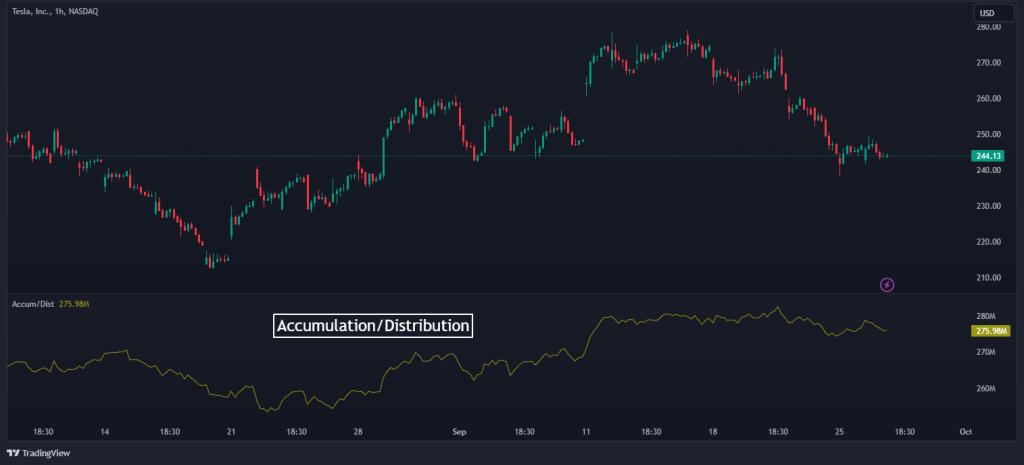
When the closing price is closer to the high, it suggests accumulation, indicating buying pressure. On the contrary, when it’s closer to the low, it signifies distribution and selling pressure.
A/D enables forex traders to assess the market’s overall sentiment towards a specific currency pair.
5. Tick Volume
In forex trading, tick volume serves as a unique way to measure market activity. It represents the number of traders actively participating in the market. Each tick denotes a single transaction, and the volume of ticks helps traders determine the current market trend.
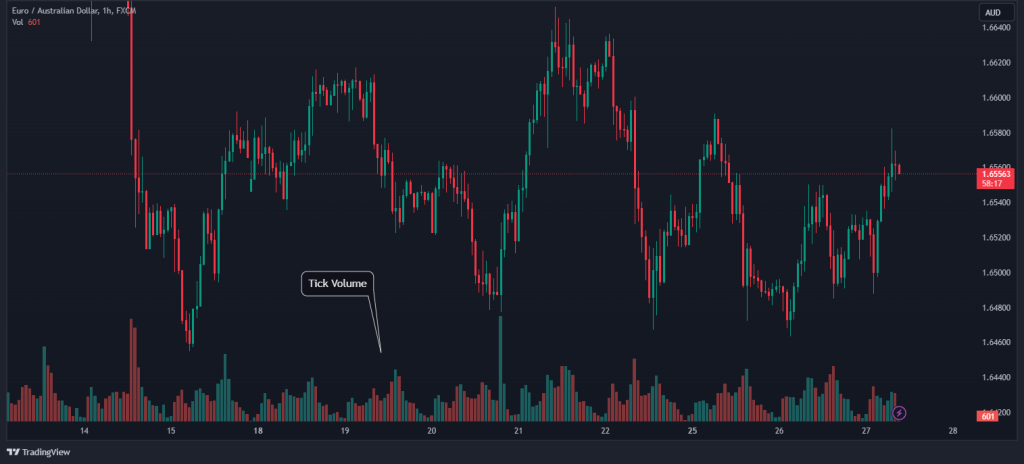
Tick indicators display the total number of transactions over a specified time frame, appearing as bars on a graph beneath price charts. When the current period’s volume exceeds that of the previous period, the bar appears green, indicating increased activity. On the other hand, a red bar signifies decreasing volume compared to the previous period.
Understanding tick volume is crucial for assessing the level of market participation and can aid traders in making well-informed trading decisions.
4 Ways to Trade the Markets Using The Volume Trading Strategy
There are various ways to trade financial assets using volume data. Whether you’re navigating low-volume markets or seeking to spot breakouts and reversals, these 4 volume strategies will equip you with the knowledge and tools to trade the markets effectively.
1. Using Low Trading Volume to Trade Ranging Markets
Although most people tend to believe that volume trading is associated with high trading volume, some traders use techniques of looking for low trading volume assets. Why? Because these markets are less volatile and easy to read. There are no unpredictable price swings, and the market can trade inside the same range for hours, days, and weeks. Even when these markets are trending, it’s much easier to grasp and catch the trend.
For instance, assets like corn, wheat futures, and some penny stocks are less likely to experience sudden price swings, making them suitable for range-bound trading strategies.
In situations where trading volume is consistently low, adopting a scalping strategy that combines using level 2 market data to select entry zones can be advantageous. It allows traders to generate profits even in markets with limited liquidity.
2. Using High Trading Volumes to Spot Breakouts
High trading volumes play a crucial role in confirming the legitimacy of breakouts. Usually, when a price genuinely breaks out of a price chart pattern or a support/resistance level, there should be a noticeable surge in trading volume (as you can see in the chart below). This increase in volume is a result of the substantial trade orders triggered by the breakout.
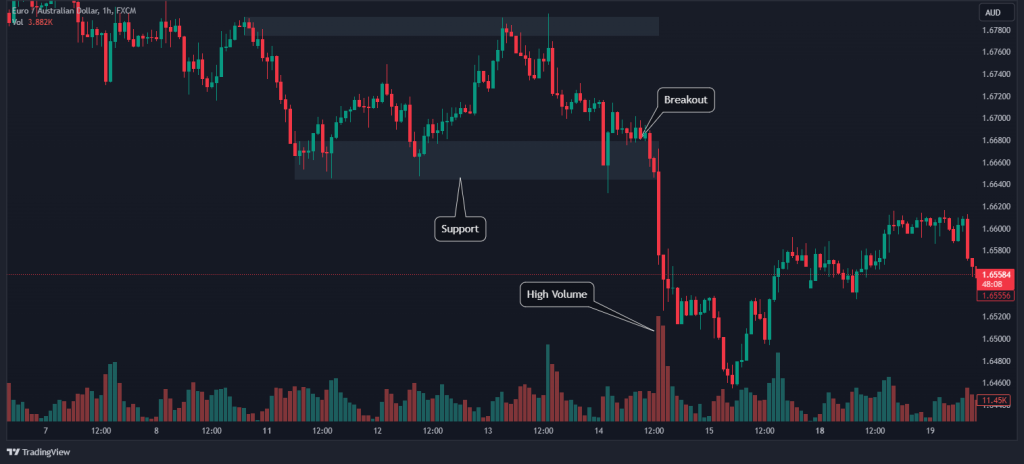
As a trader, it’s essential to scrutinize the volume accompanying a breakout. A breakout that occurs with low volume may indicate a false breakout or a lack of market conviction. Conversely, a breakout accompanied by a substantial increase in trading volume is more likely to be authentic and profitable.
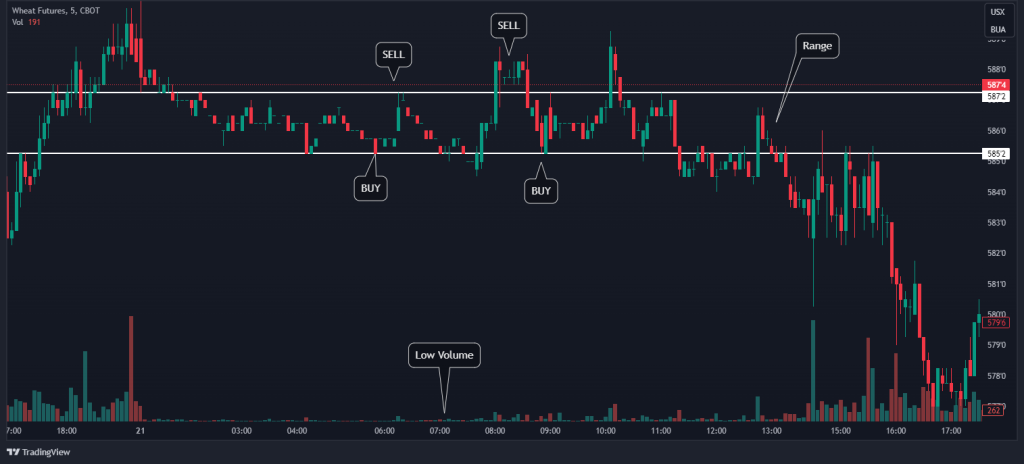
3. Using High Trading Volumes to Spot Reversals
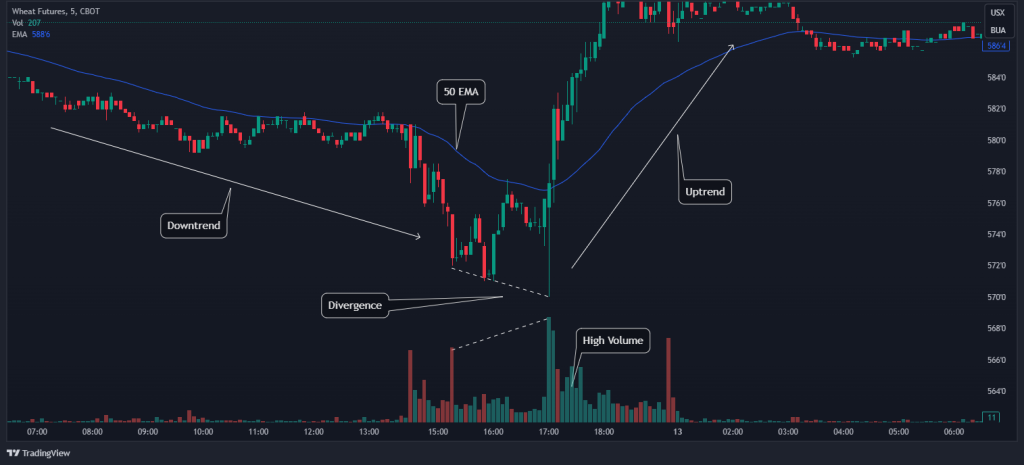
Volume analysis can also be a potent tool for identifying potential reversals. These price reversals are often characterized by a sudden surge in trading volume, which may indicate a change in sentiment and a potential trend reversal.
So, upon identifying a price reversal accompanied by an unusual increase in trading volume, you can interpret it as the end of the existing trend. For example, as you can see in the Wheat chart below, the price was trending down for a while but with a low trading volume. Then, once the price has reached resistance at a certain level with significantly high trading volume, the reversal is likely to occur.
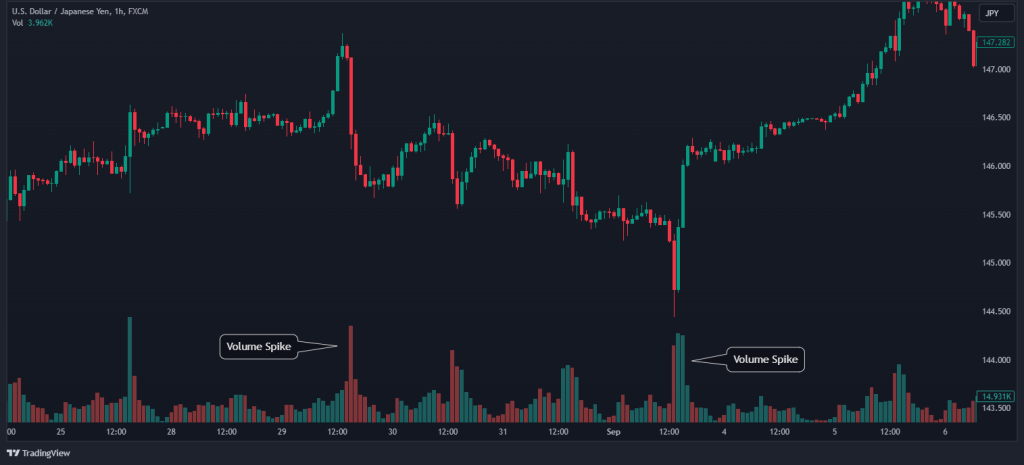
4. Trading Volume Spikes
Another way to use volume in trading is to identify abnormal trading volume. These are known as volume spikes, which are abrupt and substantial increases in trading activity. These spikes can occur for various reasons, such as significant news events or economic releases. Therefore, you must pay close attention to news releases and events released on the economic calendar that can trigger volume spikes. These events can lead to rapid price movements, offering short-term trading opportunities.
Normally, when you identify a significant volume spike in the market, you’ll enter a position in the direction of the volume bias. For example, as seen in the image below, if the volume spikes suggest that the buying pressure increases, you enter a long buying position.
Is the Volume Trading Strategy Profitable?
Overall, the volume trading strategy offers a systematic approach that provides traders with a valuable toolkit to navigate the complexities of financial markets. Those who learn how to use volume in trading certainly have the ability to identify many trading opportunities.
However, the question of whether volume and price are correlated is not yet answered. Generally, when price rises, so does volume, and vice versa. But you can easily find stocks, commodity futures, and even currency pairs that often move sharply with low trading volume.
Therefore, the profitability of volume trading strategies isn’t a one-size-fits-all equation. It hinges on several factors, including a trader’s skill, experience, and the market conditions they encounter. Just as with any trading strategy, volume trading is a skill you must master.
In all, the volume trading strategy is inherently profitable. However, traders are expected to keep their end of the equation of making it work for them by learning how their traded asset works in terms of price and volume and managing their risks properly.
Frequently Asked Questions About the Volume Trading Strategy
Here are some popular questions on volume trading strategy:
What does volume mean in trading?
In trading, “volume” signifies the total number of shares, contracts, or units of an asset traded during a specific time frame, such as a trading day or session. It offers insights into market activity and liquidity. High volume often indicates strong market interest, potentially influencing price movements, while low volume suggests reduced interest or market consolidation.
How can volume help in predicting future price movements?
When volume aligns with a price trend (e.g., rising prices accompanied by increased volume), it reinforces the trend’s strength. Similarly, significant volume spikes can signal potential trend reversals, indicating a shift in market sentiment.
Price breakouts accompanied by high volume are more likely to be genuine, confirming the strength of the breakout and saving traders from entering a position during fake breakouts.
Examining the relationship between price and volume helps traders identify weakening momentum or potential reversals.
Which Is the best Volume indicator?
The choice of the “best” volume indicator varies among traders and markets. Commonly used volume indicators include:
On-Balance Volume (OBV): A straightforward indicator tracking cumulative volume changes to confirm trends.
Chaikin Money Flow (CMF): Useful for assessing buying and selling pressure, especially near price highs or lows.
Klinger Oscillator: A more complex indicator comparing volume with price movements, aiding in predicting reversals.
Accumulation/Distribution (A/D): Calculates cumulative volume and assesses asset accumulation or distribution.
Tick Volume: Valuable for assessing market participation and momentum.
With the above in mind, remember that the best volume indicator depends on a trader’s familiarity with the indicator and how well it complements their trading strategy.
What is the average trading volume strategy?
The average trading volume strategy involves analyzing an asset’s historical trading volumes to identify trading opportunities. Traders calculate the average trading volume over a specified period (e.g., weeks or months). Then, they compare the current trading volume to this historical average.
Significantly higher current volume compared to the average may indicate increased interest and potential trading opportunities. Conversely, a much lower current volume compared to the average may suggest reduced market interest or consolidation.
This strategy helps traders gauge market activity and make trading decisions based on volume deviations from historical norms, particularly when combined with other technical analysis tools.
Risk Disclosure: The information provided in this article is not intended to give financial advice, recommend investments, guarantee profits, or shield you from losses. Our content is only for informational purposes and to help you understand the risks and complexity of these markets by providing objective analysis. Before trading, carefully consider your experience, financial goals, and risk tolerance. Trading involves significant potential for financial loss and isn't suitable for everyone.


