The STC indicator identifies market trends by integrating time and moving averages, allowing traders to gain insights into cyclical patterns. It can be used to identify potential buying and selling opportunities.
- STC is a technical analysis indicator that incorporates time and moving averages, offering a comprehensive view compared to other indicators focused solely on price movements.
- The indicator recognizes the cyclical nature of trends, aligning with the Wyckoff theory’s principles of market phases.
- Traders can use the STC indicator to identify overbought and oversold levels for potential buying and selling opportunities.
In this guide, we are going to cover everything you need to know about the STC indicator, including how to use the indicator and implement the STC trading strategy.
- What is the Schaff Trend Cycle (STC) Indicator, and How Does It Work?
- How Does the Schaff Trend Cycle Work?
- How to Use The Schaff Trend Cycle (STC) Indicator in Trading
- Schaff Trend Cycle (STC) Indicator Trading Strategy
- The Schaff Trend Cycle Indicator Trading Strategy PDF
- What are the Benefits and Limitations of the Schaff Trend Cycle (STC) Indicator?
- What is the Difference Between the Schaff Trend Cycle and MACD?
- Is the Schaff Trend Cycle Better than the Stochastic?
- How Accurate is the STC Indicator?
- Key Takeaways
What is the Schaff Trend Cycle (STC) Indicator?
Introduced by Doug Schaff during the 1990s, the STC indicator has garnered widespread acclaim due to its capacity for generating more precise signals compared to conventional indicators like the MACD and Stochastics. The STC indicator operates as a leading oscillator, intricately weaving elements of both time and moving averages to furnish traders with a comprehensive outlook on trends.
Like many other indicators, it is displayed as a sub-chart below the main price chart.
Unlike its counterparts fixated solely on price actions, this oscillating indicator acknowledges the cyclical nature of trends, aligning with the principles of the Wyckoff theory, which posits that markets progress through recurring phases of accumulation, uptrend, distribution, and downtrend.
How Does the Schaff Trend Cycle Work?
The STC formula is as follows:
Schaff Trend Cycle = 100 x (MACD – %K (MACD)) / (%D (MACD) – %K (MACD)).
This calculation is based on the following inputs:
- The default period for the short-term exponential moving average is set at 23 days.
- The default period for the long-term exponential moving average is set at 50 days.
The calculation involves determining the 23-period and 50-period exponential moving averages (EMA) along with the MACD values using the following process:
- Calculate EMA1: EMA1 = Exponential Moving Average (Closing Price, Short Length).
- Calculate EMA2: EMA2 = Exponential Moving Average (Closing Price, Long Length).
- Determine MACD: MACD = (EMA1 – EMA2).
Next, the calculation proceeds to derive the 10-period Stochastic values from the previously calculated MACD values as follows:
- Calculate %K (MACD): %K (MACD) = Stochastic Value %K (MACD) with a period of 10.
- Calculate %D (MACD): %D (MACD) = Stochastic Value %D (MACD) with a period of 10.
After obtaining these values, you can input them into the STC formula mentioned earlier to yield the desired results. By merging short-term and long-term moving averages, the indicator adeptly captures the innate cyclical patterns inherent in trends. While price fluctuates, the STC indicator oscillates within a defined range, showing the underlying shifts in momentum.
What sets the STC indicator apart from its counterparts like the Moving Average Convergence Divergence (MACD) and Stochastics is its ability to promptly and accurately identify trends. While the MACD and Stochastics have established their significance in trading, the STC indicator has a unique advantage. Seamlessly blending the concepts of time and moving averages, the STC indicator empowers traders to capitalize on emerging trends with precision.
From a practical standpoint, the STC indicator functions as a reliable compass for traders navigating the financial markets. It is good at recognizing trends and generating timely buy and sell signals, thereby empowering traders with informed decision-making capabilities.
How to Use the Schaff Trend Cycle (STC) Indicator in Trading
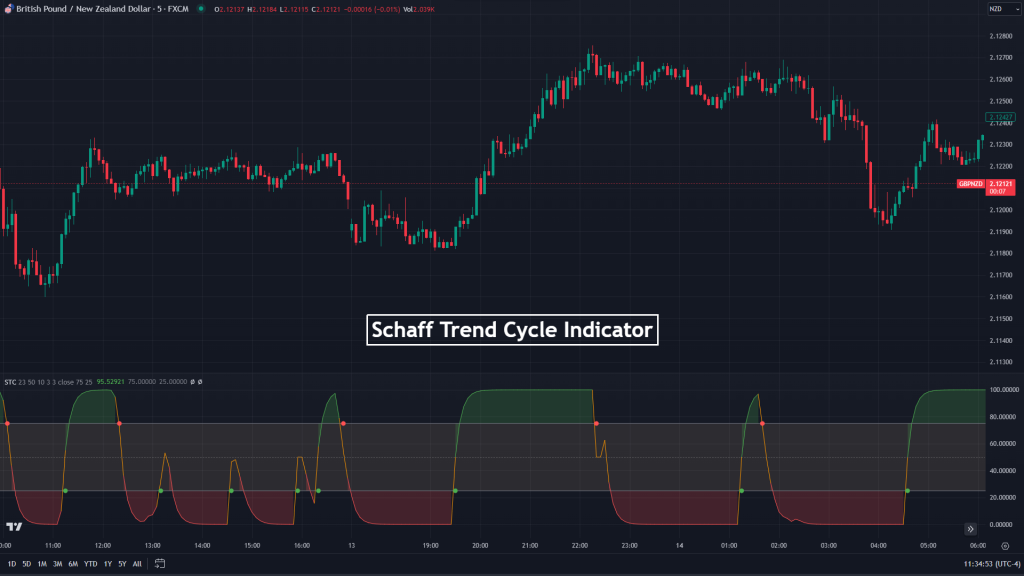
To use the STC indicator the right way, you must first understand its values and how to interpret the indicator’s values. When the STC indicator’s signal line crosses above the ’75’ mark, it indicates that the asset is in overbought conditions.
This level signifies a potential sell signal, hinting at a probable trend reversal that might trigger a downward movement in the asset’s price. This serves as an opportunity to contemplate selling or initiating a short position, safeguarding against a potential market correction.
Conversely, as the signal line of the technical analysis indicator goes below the ’25’ threshold, it shows another facet of trading dynamics – the asset is now in an oversold condition. This pivotal level paints a different picture, one that suggests a possible bounce back in the asset’s price. For savvy traders, this is an invitation to consider initiating a long position or covering existing shorts. By doing so, they position themselves to capitalize on an anticipated upward correction in the asset’s value.
Within the spectrum of STC indicator readings lies a middle ground, where the signal line flits between the ’25’ and ’75’ levels. This range serves as a subtle yet powerful cue – a signal of trend formation. This phase is crucial for traders as it calls for a comprehensive analysis of market conditions to decipher whether a bullish or bearish trend is underway. Armed with this insight, traders can align their trading decisions with the ongoing trend, thus enhancing their odds of success. Additionally, the indicator can be even more powerful when used in combination with volume indicators, such as the volume price trend indicator, or volume-weighted moving average.
The indicator not only identifies potential buy and sell signals but also presents an opportunity for traders to optimize their trading strategies, leveraging overbought and oversold levels for-profit and cautiously navigating the delicate nuances of trend formation.
Schaff Trend Cycle Indicator Trading Strategy Examples
By now, you pretty much know what the STC is and how to use it. So, let’s move on to the next step and learn how to trade financial instruments using the STC indicator.
To demonstrate, we’ll use TradingView, although the indicator works the same on any other trading platform. There are many STCs on TradingView. The one we’ll be using in the rest of this piece is the one developed by “everget,” and we’ll use its default settings. While you can use any timeframe of your choosing, we’ll be using the 1-hr timeframe here.
Trend Continuation
Trading market continuation with this technical analysis indicator is straightforward. This strategy is based on the STC’s habit of oscillating from one extremity to the other. For instance, the signal line goes below the 25 level (oversold condition), comes back up, rises above the 75 level (overbought condition), and then returns below the 25 again. This cycle goes on in perpetuity.
However, where the trade opportunity arises is where the indicator doesn’t completely return above or below the 25 or 75 level before turning in the opposite direction. Here’s how you would trade it.
Trade Entry
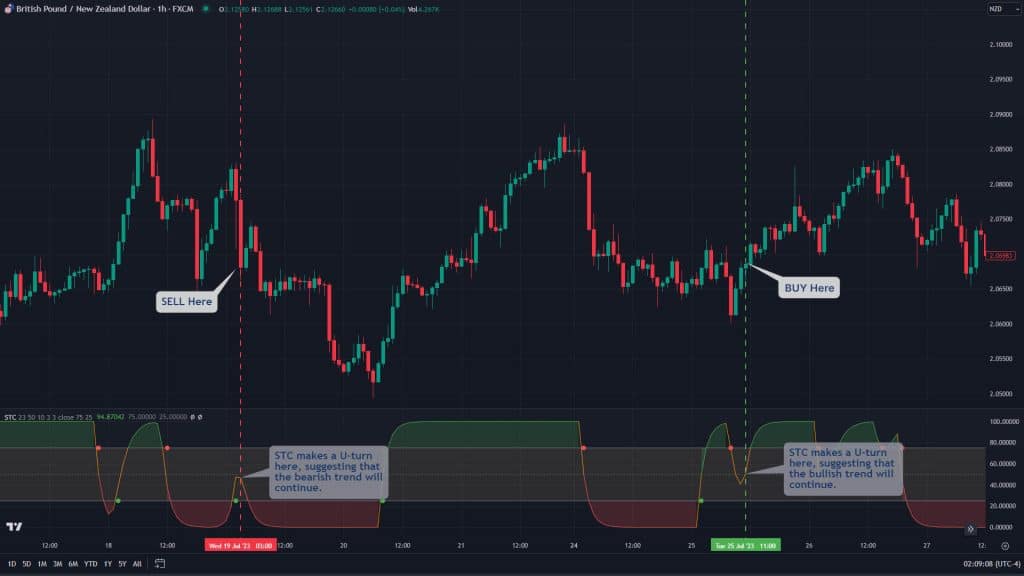
After pulling up your STC, simply wait for the indicator to not complete its cycle below or above the 25 and 75 levels. How you would know is that the indicator line makes a U-turn within the 25 and 75 levels. It simply means the previous trend is continuing.
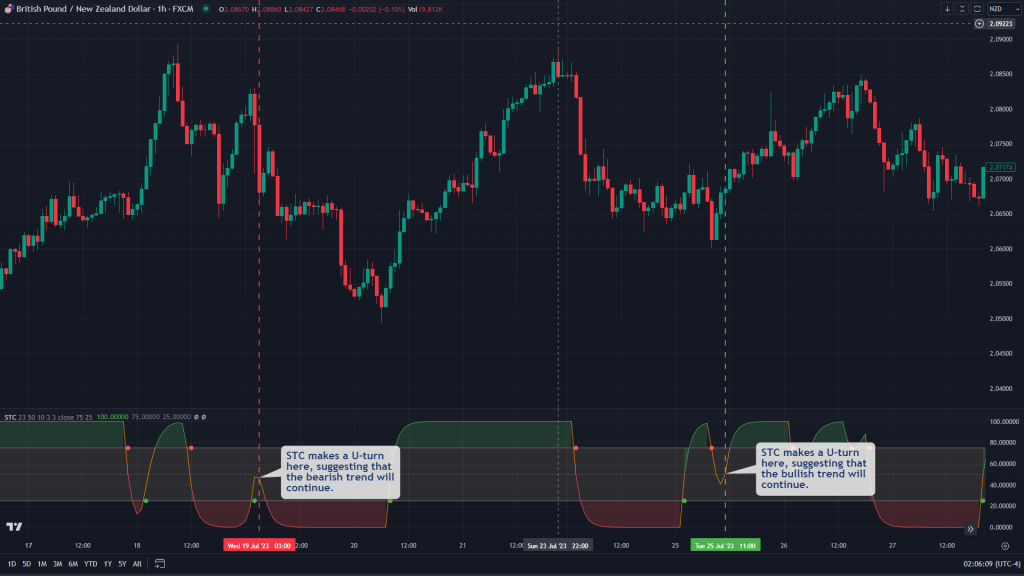
Your trade entry is simple. Buy when the indicator makes a U-turn to the upside within the 25 and 75 levels. And sell when the indicator makes a U-turn to the downside within the same levels.
Trade Exit
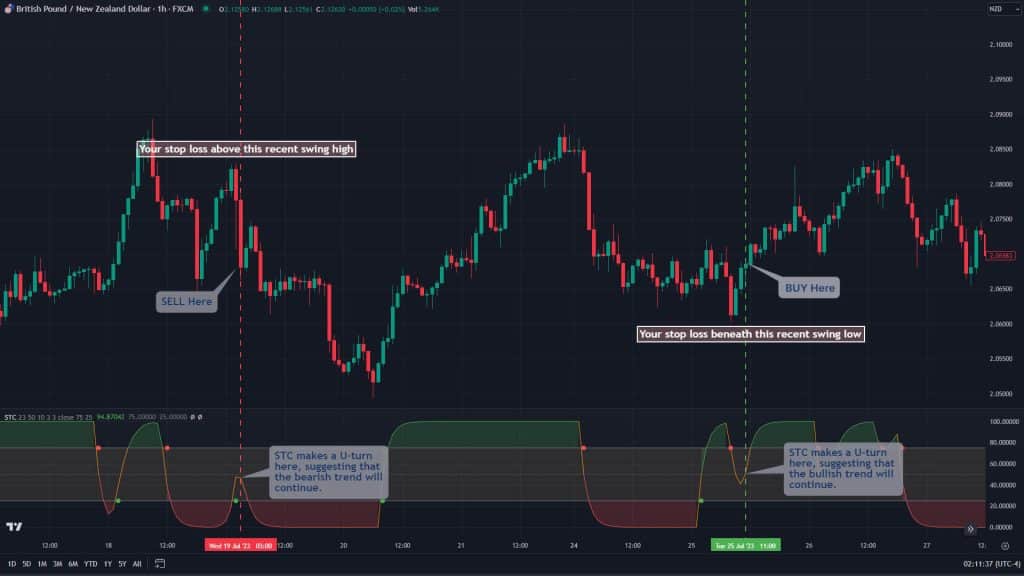
Place your stop loss beneath the most recent swing low that birthed that continuation trend in long positions. For short positions, place the stop loss above the most recent swing that birthed the continuation move.
As for your take profit, you could use a risk-reward ratio of 1:2. Take partials off at 1:11 and move your stop loss to break even. You could also use the reversal of the indicator signal to take your profit. Bear in mind, though, that this may get you out of trades too late.
Trend Reversal
We will only need the STC and the Moving Average Convergence Divergence (MACD) to catch trend reversals.
Since we’ve seen that we can expect reversals at overbought and oversold levels, that’s exactly where we will be focusing on. Again, recall that values above 75 denote overbought territory, while values below 25 indicate oversold territory.
Trade Entry
When the oscillating indicator signals an impending trend reversal by showing the STC’s signal line in the overbought or oversold level, your next step is confirmation through the MACD. This alignment serves as a powerful indication of an imminent trend reversal.
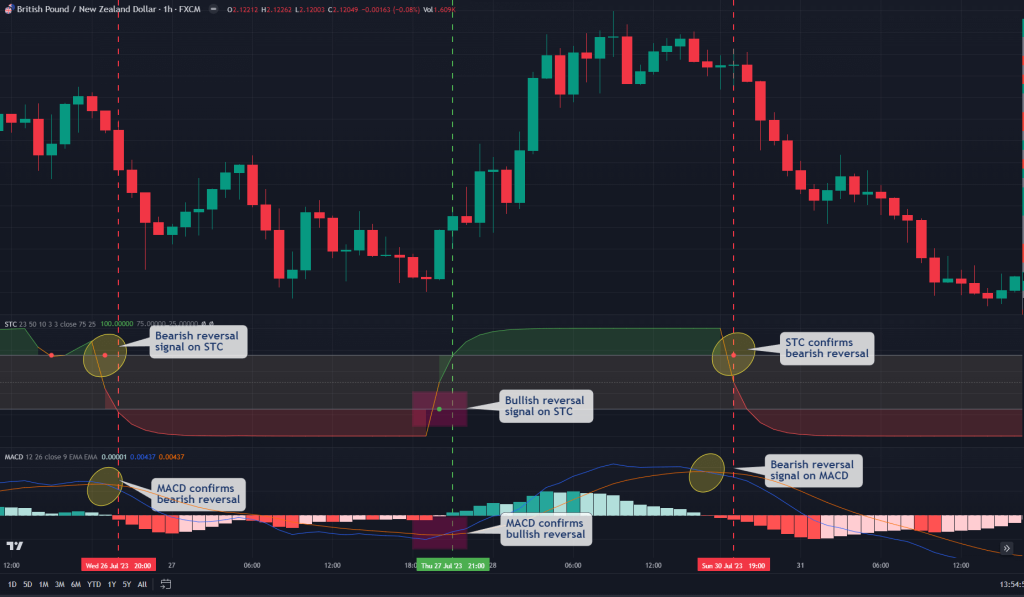
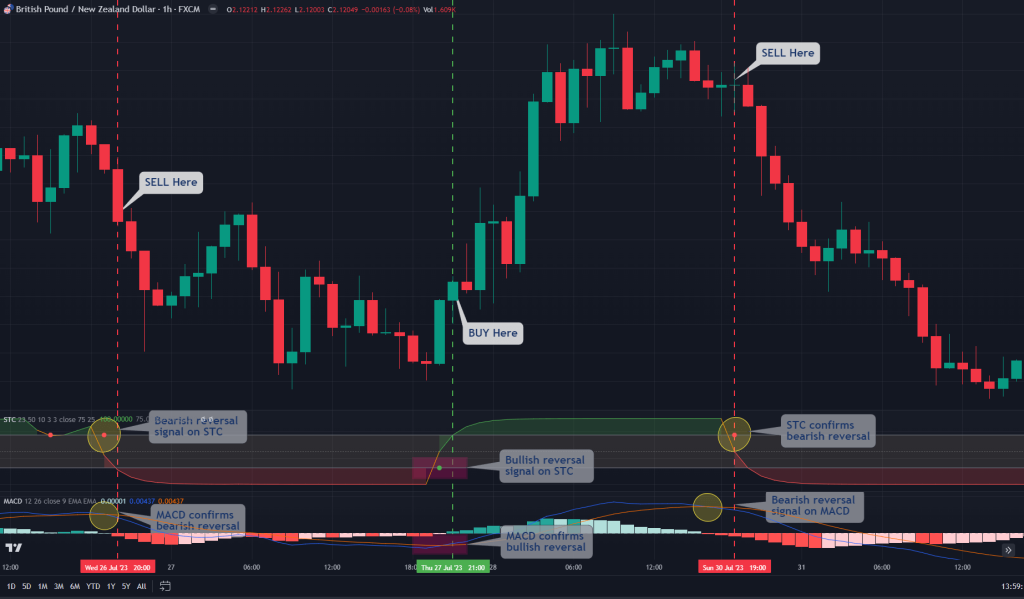
Buy when both signal bullish reversals and sell when both signal bearish reversals.
Trade Exit
Place your stop loss beneath the closest swing high or low before the reversal signal.

Ideally, a risk-reward ratio of 1:2 should do. However, you can ride the trade until you get another trend reversal signal on your MACD or STC.
The Schaff Trend Cycle Indicator Trading Strategy PDF
If you need a PDF that describes how to trade the Schaff Trend Cycle Strategy, here’s one for you:
The Schaff Trend Cycle Indicator Trading Strategy PDF
What are the Benefits and Limitations of the Schaff Trend Cycle Indicator?
Let’s quickly review the benefits and limitations of using this technical indicator.
Benefits of Using the Schaff Trend Cycle Indicator
The STC indicator’s unique focus on cyclical patterns aligns well with the inherent nature of trends, offering traders a deeper understanding of market dynamics. By factoring in both time and moving averages, the STC indicator generates signals that are often more accurate compared to other indicators like MACD and Stochastics.
Similarly, the indicator’s signal line has the ability to detect trends faster than the MACD, enhancing the trader’s ability to enter and exit positions with precision.
Pros
- The Schaff Trend Cycle (STC) indicator gives strong cyclical trend insights
- It offers enhanced signal accuracy
- Timely trend detection
- Helps to easily confirm trends
Limitations of the Schaff Trend Cycle Indicator
The STC indicator, like other oscillators, can be susceptible to whipsaw or false signals during periods of market consolidation or erratic price movements. Also, in markets lacking clear trends, the indicator might struggle to provide meaningful insights, leading to confusion for traders. Hence, relying solely on the STC indicator may not yield comprehensive trading signals. It’s best utilized in conjunction with other technical and fundamental analysis tools.
Cons
- The Schaff Trend Cycle (STC) indicator sometimes has a whipsaw effect
- The indicator is poor in range-bound markets
- The indicator can not be used as a standalone tool
- It is subject to market volatility
What is the Difference Between the Schaff Trend Cycle and MACD?
The main difference between the STC and the MACD lies in their underlying methodologies. While both technical indicators are trend-following indicators, the STC places a stronger emphasis on capturing cyclical patterns by integrating time and moving averages. In contrast, the MACD primarily focuses on the convergence and divergence of moving averages, indicating potential shifts in momentum.
Here’s a table that summarizes the key differences between the Schaff Trend Cycle (STC) and Moving Average Convergence Divergence (MACD) indicators.
| Feature | Schaff Trend Cycle (STC) | Moving Average Convergence Divergence (MACD) |
|---|---|---|
| Core Concept | Combines moving averages & stochastic oscillators | Focuses on convergence/divergence of EMAs |
| Calculation | More complex, considers price, moving averages, cycle analysis | Relatively simpler, subtracts two EMAs |
| Interpretation | Oscillates between 0-100 (above 50 bullish, below 50 bearish), crossovers & zones (25/75) signal entries/exits | MACD line itself doesn’t have buy/sell zones, interpretations based on crossovers with signal line & movement relative to center (0) |
| Visualization | Single line oscillating between 0 and 100 | MACD line with a signal line plotted on top |
| Benefits | Provides combined view of momentum & trend direction | Widely used, versatile for various trading styles |
| Drawbacks | More complex calculation, can lag price changes | Lacks built-in buy/sell zones, relies on crossovers & relative movements |
| Ideal for | Traders who want a combined momentum & trend direction view | Varied trading styles |
Is the Schaff Trend Cycle Better than the Stochastic?
The STC’s inclusion of time and moving averages contributes to its accuracy in detecting trends, making it a better market trend-following tool than the Stochastic Oscillator. It is also more accurate at predicting market reversal because it’s a leading indicator, unlike the Stochastic Oscillator.
How Accurate is the STC Indicator?
The accuracy of the STC indicator stems from its incorporation of both time and moving averages, which allows it to provide more refined signals compared to traditional indicators like the MACD and Stochastic. However, like any trading tool, its accuracy can vary based on market conditions, asset volatility, and the trader’s skill in interpreting its signals.
Key Takeaways
- The technical analysis indicator serves as a potent analytical tool for traders, enabling them to discern prevailing market trends and make well-informed trading decisions based on potential buy and sell signals.
- Unlike conventional indicators fixated solely on price movements, the STC Indicator adopts a comprehensive approach. By adeptly combining time and moving averages, it provides a more comprehensive understanding of market dynamics.
- The hallmark of the STC Indicator is its recognition of the cyclical patterns inherent in market trends. This ideology resonates with the renowned Wyckoff theory, which posits that market progression unfolds through recurring phases of accumulation, uptrend, distribution, and downtrend.
- The STC Indicator empowers traders with the capability to identify overbought and oversold territories. This invaluable knowledge enables traders to strategically seize buying opportunities during oversold conditions and consider selling prospects when assets are overbought.
Risk Disclosure: The information provided in this article is not intended to give financial advice, recommend investments, guarantee profits, or shield you from losses. Our content is only for informational purposes and to help you understand the risks and complexity of these markets by providing objective analysis. Before trading, carefully consider your experience, financial goals, and risk tolerance. Trading involves significant potential for financial loss and isn't suitable for everyone.