Exponential Moving Averages (EMA)
The Exponential Moving Average (EMA) is the next indicator we recommend you add to your toolkit. This indicator improves on some of the limitations of the Simple Moving Average (SMA), creating a further robust perspective of the forex market dynamics for traders.
In this piece, we introduce you to the EMA, how to derive it, and how to use it to spot trading opportunities. Let’s get right to it.
What Are Exponential Moving Averages?
The exponential moving average (EMA) is a technical analysis tool forex traders use to smooth out price fluctuation in the market. Unlike the simple moving average (SMA), the EMA gives more weight to the most recent price data when calculating the moving average value of price action. For this reason, the EMA line follows price action more closely and is more accurate in identifying a trend direction than other moving average indicators.
To give a little perspective, the Simple Moving Averages (SMA) simply calculates the average of the most recent data point on the price chart. If one of the values is an outlier, the resultant value of the SMA will be severely distorted. This could make traders insinuate that price is changing direction when, indeed, it is just the effect of “one” outlier.
The EMA corrects this by weighting the values of the last few data points more than the previous ones. Eventually, it creates a line chart that better reflects the reality of the price action, outlier or not. However, as obtainable with the SMA, the EMA can work on different time frames, and the indicator is readily available on most trading platforms.
How to Calculate the Exponential Moving Average (EMA)
The EMA calculation formula is more complex than the SMA. The EMA corrects the anomaly of the SMA by factoring a multiplier that weighs more on the recent data points. The formula for evaluating the EMA is as follows.
Exponential moving average = (Close x K) + Previous EMA x (1 – K)
Where K is the multiplier.
The formula for the multiplier is as follows

Where N is the number of periods.
Suppose you wish to calculate a 50-period EMA on an hourly chart. Given that the current close value is 2100 and the previous EMA is 2050. First, we evaluate the multiplier (K). For a 50-period EMA,
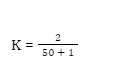
K will, therefore, be evaluated as 0.0392.
We can then proceed to evaluate the EMA by substituting the appropriate values as follows:
EMA = (2100 x 0.0392) + 2050 x ( 1 – 0.0392)
This gives a new EMA value of 2051.96
When a new period emerges, the new closing price changes as well as the previous EMA, giving a new up-to-date value of EMA for the new period. Essentially, it means that EMAs give the most weight to the most recent price values while the closing price of the first candle has little or no effect. As a result, the linearly weighted moving average line that emerges is a smoothing factor that helps a trader to identify trends and better predict the future performance of financial instruments.
Why Do Traders Use EMAs in Forex Trading Strategies?
The Exponential Moving Average indicator was developed to facilitate a smoother transition between the time frames. Reduction in the weight of price values of currency pairs, as they move away, resolves the SMA’s problems. As a result, this makes the EMA more responsive to price changes while smoothing out the line chart.
To further illustrate the emphasis placed on the more recent data, the table below shows the percentage of the EMA that makes up each price bar. We use 10 price bars for this particular example.
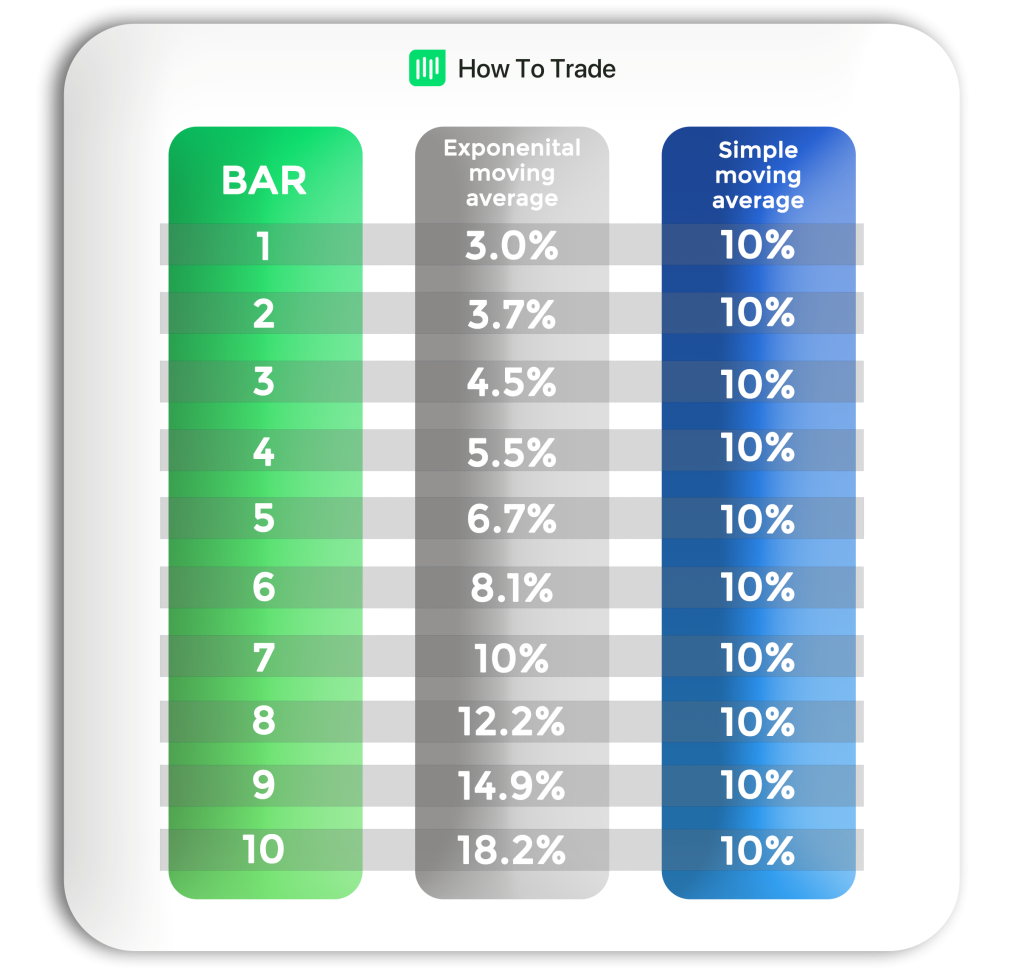
The EMA puts more weight on the recent prices: Days 8, 9, and 10. This means the more recent days have more weight than the previous trading days. It also implies that should there be a spike on any of the previous days, the price action for that day would be of less value and wouldn’t have as much effect on the exponential moving average as it would on a simple moving average.
With this in place, it becomes clearer to traders what the market is doing NOW rather than what it did in the past.
An Exponential Moving Average Trading Strategy
A fundamental method of trading with the EMA is to identify trends and crossovers in price action. When the EMA line moves upward, price action is trending upward. Conversely, a downward movement of the EMA indicates a bearish run of price action. Traders can get into a trade when the EMA line crosses the price chart. You may open a buy position when the EMA crosses the price chart from up to down. Otherwise, open a sell position when the EMA crosses the price from down to up.
It is crucial to note that the EMA is also a lagging indicator as it uses historical price data. The behavior of price action in the past does not always guarantee an accurate prediction of it in the future. Therefore, always consider using the EMA along with other tools such as the RSI, Fibonacci, and Support and Resistance levels.
Benefits of the Exponential Moving Average
The benefits of the EMA are deeply rooted in its ability to reflect recent price data in its evaluation more accurately. This makes it respond to price action more swiftly and better predict trends. Some of the benefits of the EMA are as follows.
- The EMA is highly responsive to price fluctuations. EMAs on smaller timeframes, due to the multiplier factor in their calculations, can also quickly reflect some of the minutest price changes.
- It is very suitable for intraday traders. Traders looking to profit from short-term price movements in the market and scalpers find the EMA very useful as it predicts those little price changes that occur within the short timeframe.
- The EMA, like other moving averages, is very helpful for identifying market trends. When price action reverses, the EMA changes direction faster than the SMA.
- Finally, the EMA works very well on different timeframes, making it equally useful for other traders other than short-term traders.
Limitations of the Exponential Moving Average
Like any technical analysis tool, the EMA has its limitations. Some of the limitations of the EMA are as follows.
- The EMA tends to provide false signals when the spikes and outliers we mentioned earlier are more recent. Because the EMA emphasizes recent data points, a new outlier will grossly affect it, leading to a conflicting signal.
- Since the EMA draws a smooth, continuous line that follows price action, it fails to account for price gaps that randomly occur in the markets. An example of such a gap is the case of a sudden spike in price due to news.
- The EMA is a lagging indicator, and its strength is in identifying trends and their intensity. It is not the most accurate indicator for predicting future price movements.
Exponential Moving Average (EMA) vs. Simple Moving Average (SMA)
Consider the following image that compares the simple moving average (SMA) to the exponential moving average (EMA) on the same chart.
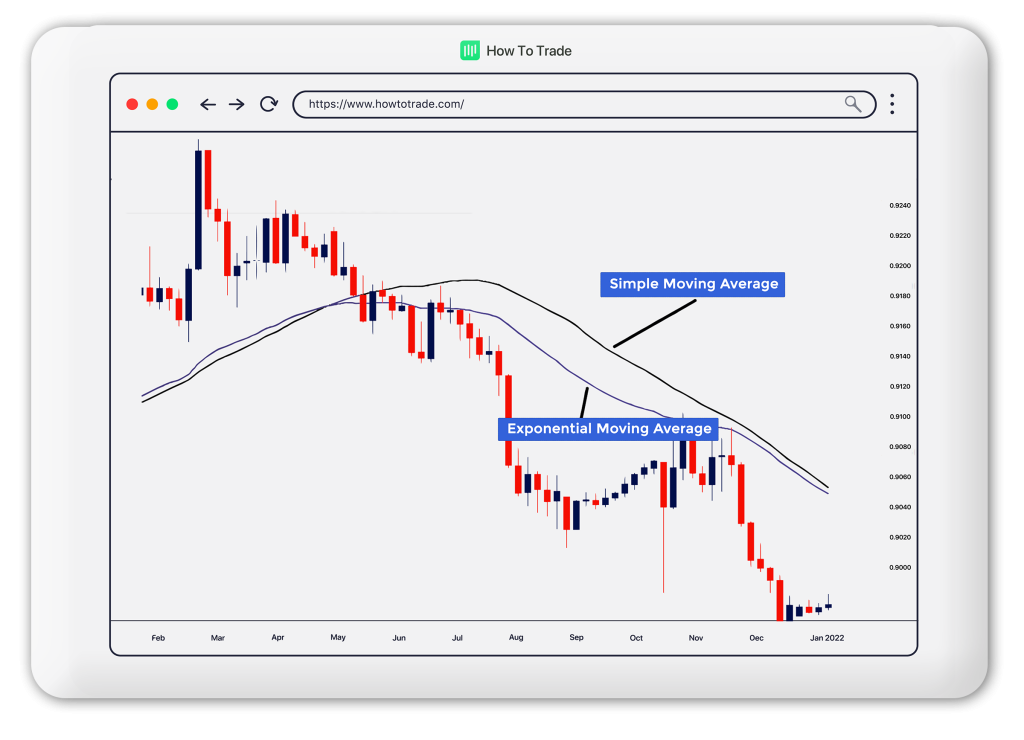
Notice how the blue EMA line appears closer to the price than the black SMA line. That is because it more accurately represents recent price action and places greater significance on the most recent days. In our next lesson, we’ll compare the simple and exponential moving averages more exhaustively and help you determine which suits your trading style better.
Key Takeaways
- The EMA is a moving average that smoothens price fluctuations by weighing recent price data, helping traders identify trends and trade opportunities.
- Its calculation involves a multiplier effect that weighs in more on recent price data.
- A simple strategy to trade the EMA is by identifying crossovers between the EMA and price action.
- The EMA better reflects the activities in the market than the SMA but has its own limitations too.
Conclusion
The EMA is a helpful tool for identifying trends and catching trade opportunities in the market. It is more particularly helpful for short-term traders as it reflects small changes in price action even on a small timeframe. However, consider using the EMA with other technical analysis tools to improve your results. See you on the next one.


0% Commission Accounts
- Trade 1,000’s of global markets.
- 0% deposit and withdrawal fees.
- Rapid funding turn-around times.
- Trade on MetaTrader 4 and 5.