
- The 8, 13, 21 Exponential Moving Average (EMA) strategy is a vital tool for intraday trading.
- By using three Fibonacci number-based EMAs (8, 13, and 21) to gauge market trends, this technique prioritizes recent price data over older data, offering a more responsive approach to market conditions.
- A bullish trend is indicated when the 8 EMA crosses above both the 13 and 21 EMAs, while a bearish trend is signaled by the 8 EMA crossing below these EMAs, with the 13 EMA often acting as a trailing stop loss.
The 8, 13, 21 EMA combination is a common trading strategy among intraday traders, largely because it involves three short-term exponential moving averages. This combination assists traders in indicating short-term trends and price reversals.
In this guide, you will learn:
- The definition and trading rules of the 8,13,21 EMA trading strategy
- How to effectively set up and use the 8, 13, and 21 EMA strategy in intraday trading
- Determine whether the 8, 13, and 21 EMA is the right strategy for you
What is the 8, 13, 21 EMA Strategy?
The 8, 13, 21 Exponential Moving Average (EMA) strategy employs three EMAs: the 8-day EMA, 13-day EMA, and 21-day EMA, each offering insights into market trends and potential trade entry and exit points. Unlike the 9 EMA strategy or the 20 EMA strategy, the choice of these specific numbers (8, 13, and 21) is not arbitrary; they are Fibonacci numbers, which are often used in trading strategies due to their natural occurrence in various natural phenomena and their relevance in financial markets.
The EMAs are calculated by averaging the closing prices over their respective time frames (8, 13, and 21 days). Unlike simple moving averages, EMAs give more weight to recent price data, making them more responsive to current market conditions, especially in volatile markets. This typically makes EMAs much more useful in short-term trading techniques such as scalping and day trading.
In practice, this triple exponential moving average strategy generates buy and sell signals based on the positioning and crossing of these EMAs. These EMA crossovers assist traders in identifying trends and price reversals and, thus, making informed trading decisions.
For instance, a common signal for a bullish trend is when the 8 EMA crosses above both the 13 and 21 EMAs, while a bearish trend signal is indicated when the 8 EMA crosses below the 13 and 21 EMAs. The 13 EMA acts as a middle ground, often serving as a trailing stop loss to protect profits and limit losses. It’s important to note that while the EMA strategy is effective, it requires constant monitoring due to the nature of intraday trading.
Here’s everything you need to know about the 8, 13, 21 EMA strategy in one video:
The 8, 13, 21 EMA Strategy – Trading Setup
To effectively set up and use the 8, 13, and 21 Exponential Moving Average (EMA) strategy in intraday trading, it’s crucial to understand both the technical aspects and the strategic application of these EMAs on your trading charts. Here’s a step-by-step guide on how to go about it:
Setting Up the EMAs on Trading Charts
- Choose a suitable trading platform that allows the use of EMAs. Most modern trading platforms like TradingView or MetaTrader offer this functionality.
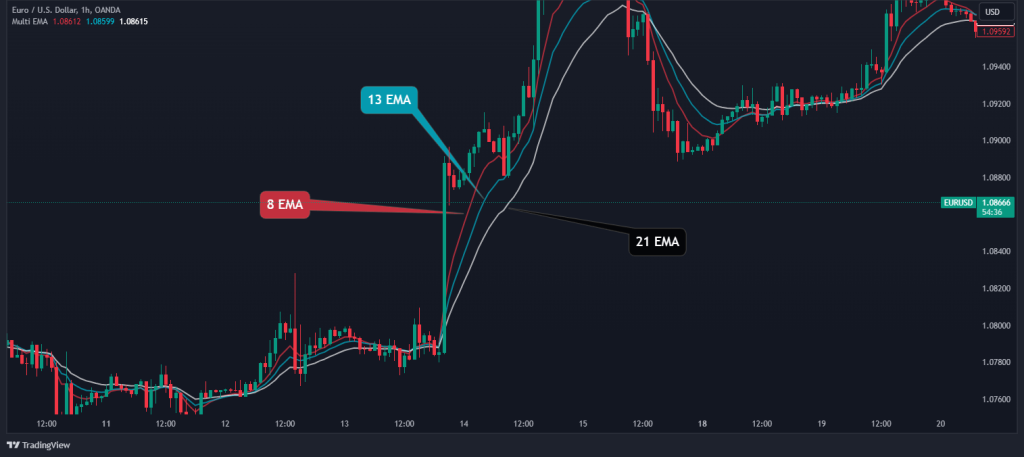
- Apply the 8, 13, and 21-period EMAs to your trading chart. This is typically done by selecting the EMA option from the indicator list and setting the specific periods (8, 13, 21) for each EMA. Alternatively, you can use the “Multi EMA” indicator and configure its parameter to fit what you’re looking for, as shown in the image above.
- It’s beneficial to use different colors for each EMA for easy identification and tracking.

Choosing the Right Timeframes
- This strategy is flexible and can be applied across various timeframes. However, for intraday trading, shorter timeframes (like 1-hour or 4-hour charts) are usually more effective. For that matter, the 8, 13, and 21, strategy can be highly effective when used with multiple timeframe analysis.
- Ensure that the timeframes chosen align with your trading style and the market’s volatility.
How to Trade Using the 8, 13, 21 EMA Strategy?
We have earlier glossed over how to trade these EMAs. Now, in this section, we will go over the whole process of placing a trade with the 8, 13, and 21 strategy on a live chart, starting with the trade setup.
Trade Setup
The success of your trading starts with your setup. You want to ensure you have the right indicators on your screen before hitting the trade execution button. So, for this example, we are simply going to manually overlay the 8 EMA, 13 EMA, and 21 EMA on the chart individually, as we showed in the previous section.
As said earlier, we assign different colors to each EMA to avoid confusion. With this out of our way, it’s time to find a trade entry.
Trade Entry
New traders generally subscribe to the fallacy of complexity, thinking “the more complex the strategy is, the better its result.” In this case, nothing can be further from the truth. Having a simple rule-based entry can save you a lot of “analysis paralysis” when you hit the chart.
So, here’s how we go about our entries with this strategy:
- A bullish signal is indicated when the 8 EMA crosses above the 13 and 21 EMAs.
- Conversely, a bearish signal is suggested when the 8 EMA crosses below the 13 and 21 EMAs.
- And if you’re an advanced trader, you can incorporate other technical indicators like the MACD or Parabolic SAR for additional confirmation of the signals. However, it’s optional, and we won’t be using it in this example.
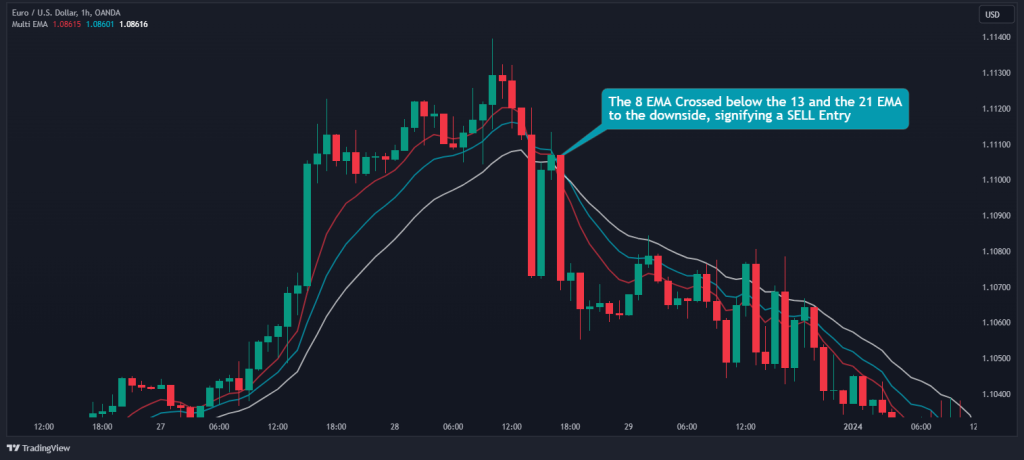
As you can see, the above chart shows our entry. You can see that we have a SELL entry after the 8 EMA has crossed below the other two EMAs. That’s all we need to enter a position when using the 8, 13, and 21 trading strategy.
Stop Loss and Target Profit
The approach to risk management when working with moving averages is very important, especially because they are lagging indicators. Therefore, to set our stop loss points when using this strategy, we can either:
- Place a static stop loss order below the swing low when in a LONG or above the swing high when in a SHORT position.
- Also, you can use the 13 EMA to trail our stop loss if you’re interested in riding the trend for a long time.
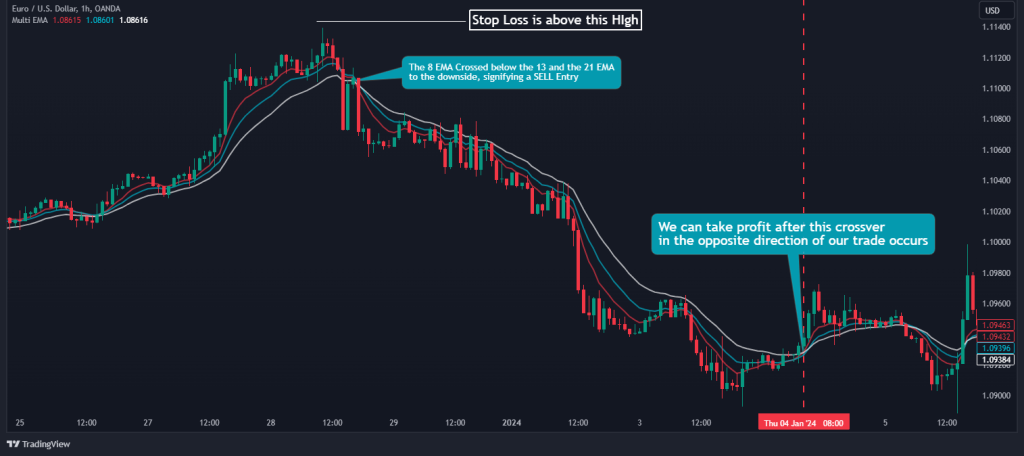
Similarly, you can take two approaches to setting your target profit. The first and easiest method is to set a definite target profit, say 1.5R, 2R, or 3R. On the other hand, you can hold the trade until the 8 EMA crosses the 13 and 21 EMAs in the opposite direction to the trade.
The 8, 13, 21 EMA Strategy PDF
Here’s a free 8,13,21 EMA strategy PDF you can keep in handy should you need something quick to fall back upon when you’re trading:
The 8, 13, 21 EMA Strategy PDF Free Download
Why Should You Use the 8, 13, and 21 EMA in Intraday Trading?
At this point, you should have a very good grasp of the 8,13, 21 EMA strategy. Yet, you might wonder if it’s the right trading strategy for you.
So, primarily, the 8, 13, and 21 are considered highly effective as a scalping or intraday trading strategy. As a result of its combo of short-term exponential moving averages, this indicator gives more weight to recent prices, which can be very useful in finding short-term trades. Moreover, the integration of the three EMAs is relatively straightforward and does not disrupt your chart analysis.
All in all, there’s no reason not to add the 8, 13, and 21 trading techniques to your trading tools, especially if you consider yourself a short-term trader. It’s an excellent and simple trading strategy that can help you find lots of trading opportunities.
Still, as always, we suggest backtesting this strategy before you apply it in live markets; it also builds your confidence when you’re trading. Additionally, a study shows how you can greatly improve a skill by watching how professionals perform the said skill. In this case, having a mentor to follow can shorten your learning curve significantly.
Frequently Asked Questions
Here are some frequently asked questions about the 8, 13, 21 EMA strategy:
What is the 8, 13, 21 EMA strategy in intraday trading?
The 8, 13, 21 EMA strategy involves using three exponential moving averages (EMAs) set at periods of 8, 13, and 21. This strategy helps traders identify trends and potential entry and exit points in intraday trading based on the crossover and positioning of these EMAs.
What timeframes are best for the 8, 13, 21 EMA strategy?
While this strategy can be applied across various timeframes, for intraday trading, shorter timeframes such as 1-hour or 4-hour charts are usually more effective. It’s important to select a timeframe that aligns with your trading style and the market’s volatility.
What are the buy and sell signals in the 8, 13, 21 EMA strategy?
A typical buy signal is generated when the 8 EMA crosses above both the 13 and 21 EMAs, suggesting a bullish trend. Conversely, a sell signal is indicated when the 8 EMA crosses below the 13 and 21 EMAs, suggesting a bearish trend. These trading signals should ideally be confirmed with additional indicators.
Risk Disclosure: The information provided in this article is not intended to give financial advice, recommend investments, guarantee profits, or shield you from losses. Our content is only for informational purposes and to help you understand the risks and complexity of these markets by providing objective analysis. Before trading, carefully consider your experience, financial goals, and risk tolerance. Trading involves significant potential for financial loss and isn't suitable for everyone.