Every trader wants to have an edge, to get as much information as possible, and to analyze the market better than others. One way to get this edge is by using the order flow trading strategy, a unique analysis method that enables traders to define key levels and know where strong support and resistance levels are located.
- Order Flow Trading is a strategy that offers traders an edge by providing valuable market insights
- This method allows traders to identify key levels and discern strong support and resistance locations
- The guide aims to demystify Order Flow Trading, an influential technique that can potentially transform trading approaches
- Understanding Order Flow Trading is crucial for both novice and experienced traders aiming to enhance their market analysis capabilities
In this guide, we’ll reveal a secret weapon for trading: order flow. If you aren’t familiar with it, stick to the end and see how this simple trading strategy can change the way you are going to trade.
- What is Order Flow Trading?
- How Does the Order Flow Trading Strategy Work?
- So, What is an Order Book?
- How to Use Order Flow in Trading?
- The Order Flow Trading Strategy – What Indicators Should You Use?
- What are the Benefits and Limitations of Order Flow Trading?
- What is the Best Way to Use the Order Flow Trading Strategy?
- Is Order Flow Available in Tradingview?
- What’s the Difference Between Order Flow and Market Profile
- Order Flow Trading Strategy PDF
- Bottom Line
What is Order Flow Trading?
Order flow trading, also known as order flow analysis or tape reading, is one of the oldest and most effective trading methods. David Liss, for example, who released the fictional novel Whiskey Rebels, mentions the order flow trading analysis in the 18th-century Philadelphia Stock Exchange. At basic, this method involves the analysis of recently executed orders as well as pending orders to predict market sentiment and the future direction of markets.
Historically, order trading was a very common technique for pit traders. Back then, many used the same price levels to place orders and analyzed the tape reading to know when to enter and exit trades. That makes sense, right? They didn’t have many tools, and tape reading was the main screen for them to monitor.
However, with the advancement of technology and the shift of trading to electronic markets in the past two to three decades, the trading system has completely changed. As the integration of level 2 trading and other technological tools has become more accessible to retail traders, order flow has made a new way to stay alive in financial markets. Even nowadays, many hedge fund managers and professional proprietary traders use order flow analysis in their day trading methods.
How Does the Order Flow Trading Strategy Work?
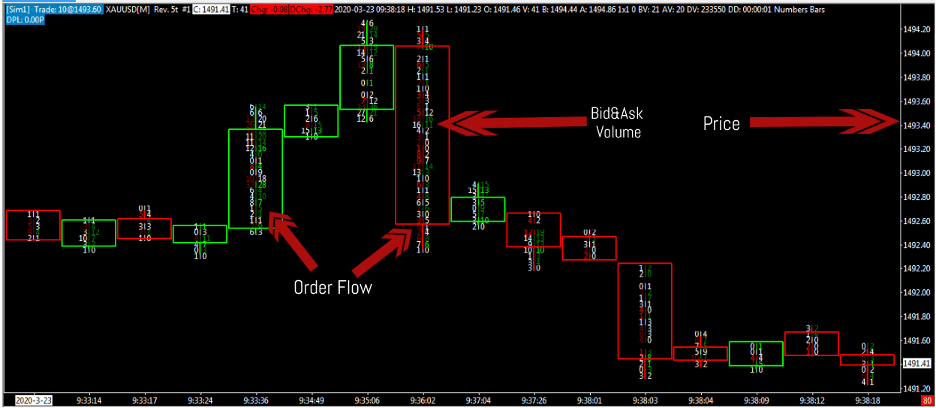
So, what is order flow in trading anyway? Simply put, order flow trading is about keeping an eye on market orders waiting to be executed. According to the order flow strategy, prices fluctuate due to market imbalances, and you may anticipate future price fluctuations using this approach. It can all be seen in the price chart or the market orders box using any order flow indicator.
Before we get into the specifics of order flow trading, you first need to know what order flow analysis looks like on a trading chart.
Note that this is one way to use the order flow trading technique; however, some traders primarily use the market data box to analyze price action and use the naked trading strategy when looking at price charts.
So, let’s get back to understanding the order flow concept. Let’s assume there is a substantial increase in demand, and the price keeps rising. At this point, you must recognize that there are more buyers than sellers in the market.
However, as the market is cyclical, the price will reverse again at some point. Once the buying pressure is over, sellers will take control. That is the core principle of order flow trading—the market imbalance.
Using order flow analysis, you may predict where market order imbalance will occur at a future price level. The supply and demand levels represent the imbalance, so by implementing the order flow trading system, you can only anticipate the market price movements by looking at market orders. Those are displayed on the order book, which lists all pending orders and is one of the most crucial tools for order flow traders.
What is an Order Book?
When we talk about market imbalances, we have to talk about market data. This is an important concept for analyzing the markets. Technically, market imbalances typically happen when big players enter the market intending to purchase large blocks of the specified asset or place large order blocks to impact the market’s price.
Now, when large banks and financial institutions place orders in the market to buy assets, they usually do that in blocks, meaning with several large orders. That is a concept known in financial jargon as Smart Money. Technically, banks and financial institutions can not place their order simultaneously because their order won’t get filled due to a lack of liquidity.
Also, if they place their order in one batch, other market participants can immediately notice that, and the price will instantly rise or fall. So, they break their trades into chunks and then enter and exit the market to get the number of shares or contracts they wish to buy or sell. Based on the SMC theory, this is what creates the break of structure on price charts.
Order flow trading is a perfect way to trade naturally, which many believe could lead to long-term profitability and some sort of a peaceful trading routine.
As a retail trader, you can use market data to discover where large orders are placed. There are two main types of market data: levels 1 and 2.
With level 1, you get the most basic information, that is, the current prices, recently filled trades, and the last bid, and ask for the specific asset and the trade’s size. Level 2 market data, on the other hand, provides more info than level 1. Level 2 market data reveals how the market is changing, as it shows a ranked list of buyers and sellers, with the positions amounts, the market participants, and the market maker. It’s where the big boys like the banks and financial institutions come into play. Level 2 data tells you pretty much everything – how much an asset is worth, who is trading it, and for how much.
Obviously, knowing when big market players have begun to buy or sell an asset in more extensive amounts can help you become an invincible trader. Therefore, it is a necessary tool for utilizing the order flow trading strategy.
Check this Video to Learn More about Order Flow Analysis
How to Use Order Flow in Trading?
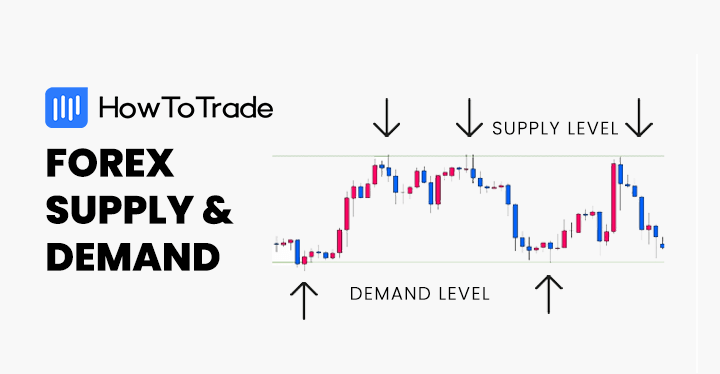
Order flow trading is about looking at the orders waiting to be filled and then taking positions accordingly. These orders represent the supply and demand side of the market and may provide a strong indication of the market’s direction.
When there’s more supply, sellers come to the market, filling many sell orders. Conversely, buyers join the market when there’s a demand, and buy orders get filled. The goal for you as a trader is to find market imbalances where you can identify buying or selling pressure.
For example, let’s assume you are trading a commodity heavily affected by giant corporations’ and governments’ needs. Let’s say wheat. Now, you look at Wheat’s level 2 order book, and the market is slow, with not too many price movements and market news.
Suddenly, you see large or maybe huge blocks placed on the bid side – something unusual for the market you are trading. So, you can assume that a large corporation or a certain governmental entity is entering the market to buy huge piles of wheat. Remember, a government does not care about a few cents here or there. When they need to buy a specific commodity, they buy the asset at any price.
For you, as a retail trader, it’s a gift. Assuming you have identified a scenario where large orders are placed in the market, you will enter the market in the direction of large order blocks. That is why many traders and prop trading firms follow commodity auctions. They try to find out when financial institutions or governments get involved in the markets.
It’s as simple as that. That is what the order flow trading strategy is primarily based on: knowing how to read and analyze the market’s order book. After all, every market is a battle between buyers and sellers, and the level 2 order book gives you the best insight into this battle. That is why many professional and prop traders rely solely on order flow trading. They believe that by trading naked and using the order flow trading method, they can easily analyze the market and develop the sixth sense of trading.
Order flow trading is about looking at the orders waiting to be filled and then taking positions accordingly. These orders represent the supply and demand side of the market and may provide a strong indication of the market’s direction.
What’s the Catch with Trading Order Flow?
Order flow trading certainly sounds magical, and it is in a certain way, but the only downside is that you have few options to achieve this tool. As a matter of fact, limited platforms provide level 2 market data, and you can only trade specific assets that trade on exchanges like stocks and futures. In many cases, you will not be able to get level 2 data, meaning you cannot apply the order flow trading strategy.
So, to analyze the markets using the order flow trading system, you need to work hard before you place your first trade.
- First, you need to find a brokerage firm that enables you to access level 2 market data.
- Second, decide on the instrument or market you want to focus on. Forex, for example, could be tricky for order flow trading. On the other hand, futures, stocks, and even crypto coins are much better for utilizing the order trading technique.
- Lastly, find the best trading platform to read level market data. Again, there are many factors to consider, and you might have to visit forums and trading sites to get the answer. Nevertheless, choosing a suitable trading platform is essential for you to use the order flow trading strategy.
Order Flow Trading Strategy: Three Indicators to Use
In the previous section, we mentioned that getting the order flow trading is a bit complex, but there is always a way to get this tool. Below, we will show the best indicators to use the order flow trading method. You can combine any of them with other trading tools to form various order flow trading strategies.
1. Market Depth
Market depth or Depth of Market (DoM) is an overview of all buy and sell orders for specific securities placed in the market. Like stock market news, Market depth can help determine the market sentiment in one asset. Every live order is detailed, including the volume at each price level.
Essentially, market depth is very similar to the level 2 order book. Therefore, if you examine market depth before placing an order, you can determine the likelihood that your order will be filled.
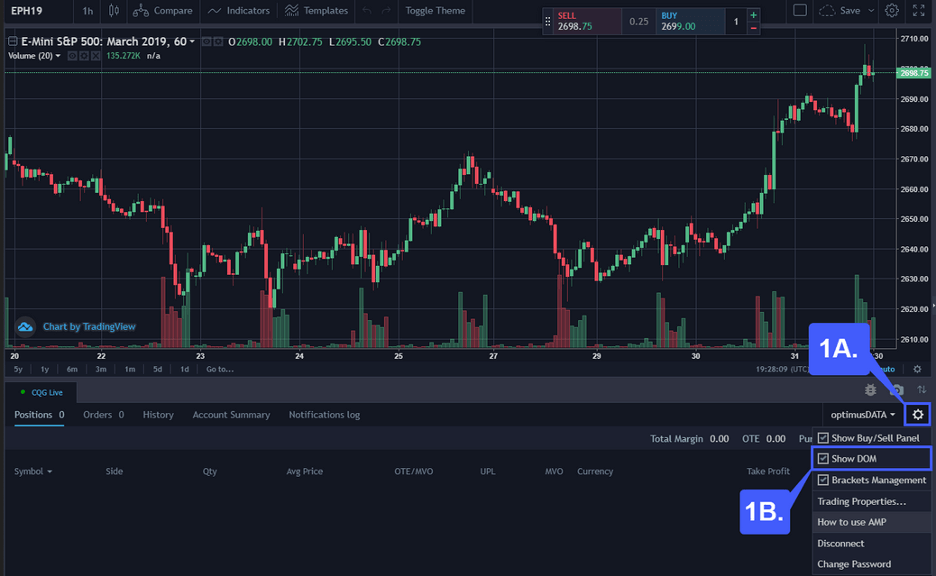
In TradingView, you can apply the Market depth feature on any asset by connecting your broker’s server with the platform.
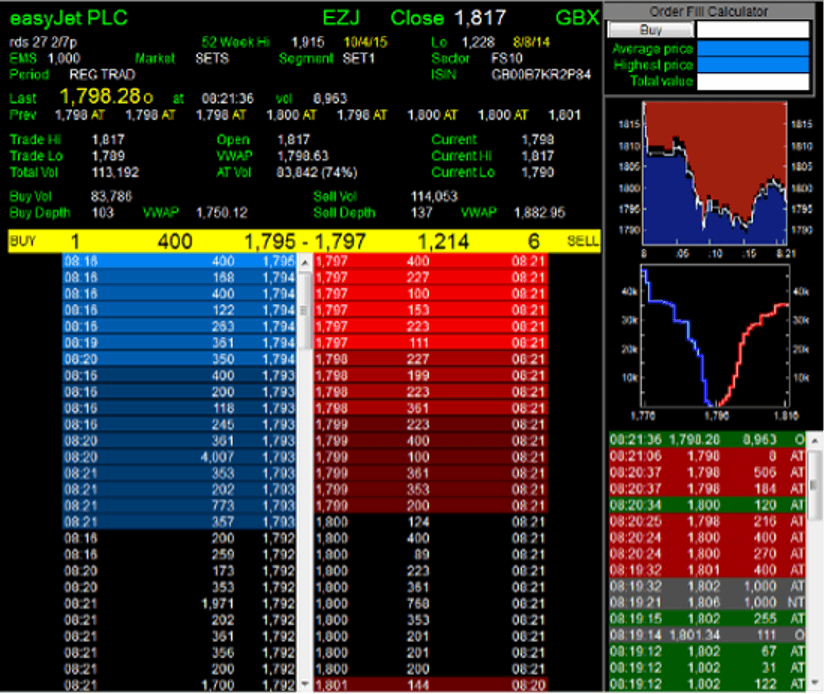
2. Level 2 Order Book
We have discussed the level 2 order book above, but let me give you a more detailed explanation of how level 2 market data works. The level 2 order book answers questions like how many buyers or sellers there are in the specific market, how large the orders are, what the bid/ask prices of the current market are, and what the total sizes of orders are.
Usually, a Level 2 order book shows up to 5-10 of the best bid and offer prices on a specific market (unlike Level 3, which shows a broader list of up to 20 bid and ask prices). The orders are updated in real-time, providing precise info about possible price changes.
Generally, the level 2 order book gives you a clear picture of all market participants entering the market – The data shows market depth by displaying the number of contracts/lots/shares placed at each bid and ask price.
Now, here is something for scalpers and day traders. Level 2 data is super beneficial for intraday traders, enabling them to capture many small price swings throughout the day. Using the level 2 market data, pro traders can use several level 2 strategies to predict how the underlying asset’s price will move in the next few minutes by examining bid and ask prices and volume.
For example, if an asset’s bid prices are falling, it might indicate that the price is due to fall. This is because potential buyers have begun offering less money for it at the upper end. On the other hand, rising ask prices for an asset may indicate that the price is poised to increase and gain strength in the short term.
Many day traders use various techniques when using the level 2 order book. For instance, if trading a market with low volatility, they may place limit orders on both sides and wait for execution. Otherwise, they can use the order flow trading technique to find where large institutions place big orders to utilize the breakout trading strategy.
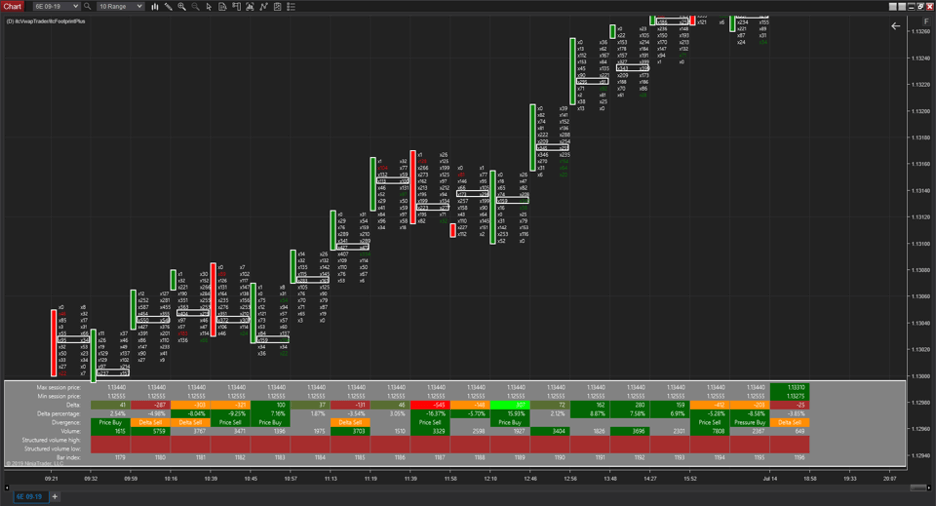
3. Footprint Charts
A footprint chart visually represents the traded volume at each price level. Much like the market depth and level 2 order book, it tells you exactly where the orders are being filled in real time.
However, compared to the Market depth, which displays a lot of info, the power of the footprint chart is based only on the fact that it only shows orders executed in the market. As a result, you may pick up valuable information about where buyers and sellers were interested in making transactions and where the most considerable trade activity occurred.
A key point to add here is that footprint does not work in the interbank forex market. Instead, you can use it for assets listed on electronic exchanges like futures trading and the stock market. Although you can use footprint charts in forex futures trading, the volume in the interbank forex market is so massive that using footprint charts could be somehow confusing.
Nonetheless, a footprint chart is an excellent tool for order flow trading as it provides market depth information directly on a price chart, which makes the trading process much easier and more efficient.
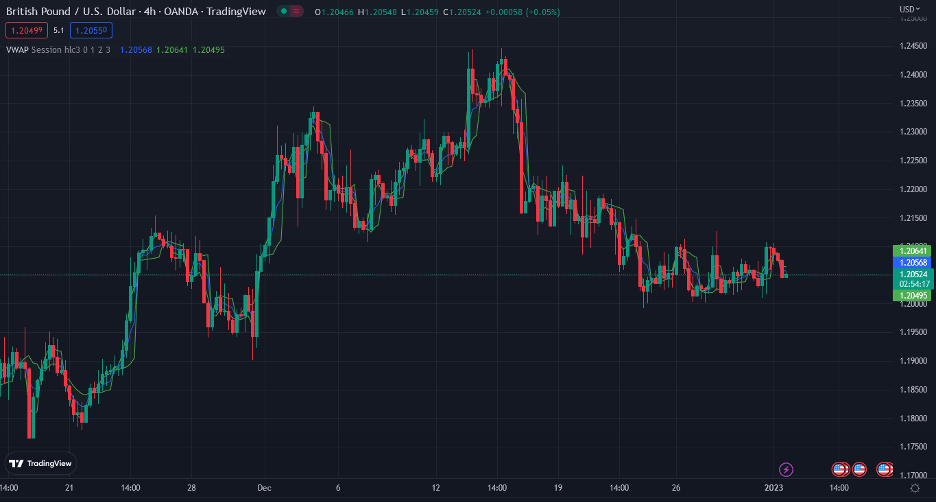
4. Volume Weighted Average Price (VWAP) Indicator
VWAP, also known as Volume Weighted Average Price, shows the overall market volume by adding the Moving Averages trend line on a price chart. VWAP is a tool for identifying liquidity points, and, as a volume-weighted indicator, it emphasizes price levels weighted by volume. This can be useful for institutions with huge orders.
When entering huge buy or sell orders, large institutions and governments aim to avoid disrupting the market. VWAP assists these institutions in determining liquid and illiquid price points for a particular investment in a short period.
For that reason, many traders and long-term investors use the VWAP indicator to find crucial levels on a price chart and identify reasonable entry and exit levels.
What are the Benefits and Limitations of Order Flow Trading?
If you’re already on the brink of delving into order flow trading, here are the benefits and limitations of the concept that you may need to be aware of:
Benefits
- Order flow trading helps you visualize the supply and demand imbalances causing the price to move.
- Order flow can serve as a real-time gauge of market sentiment.
- You can see hidden supports and resistances that might not be apparent on traditional price charts.
- Many professional and reputable traders swear by it. That’s got to count for something.
Limitations
- Novice traders are better off starting with basic technical analysis.
- It isn’t easily accessible for most retail traders.
- It can be complex and takes expertise to analyze and use.
What is the Best Way to Use the Order Flow Trading Strategy?
According to many traders, one of the best ways to use the order flow is to analyze the level 2 order book, draw supply and demand levels on a price chart, look at the volume, and find market imbalances. After doing that, entering trades becomes the easy part.
Is Order Flow Available in Tradingview?
By adding order flow indicators, you can do order flow trading on Tradingview. However, you won’t find liquidity data in Tradingview, which makes the order flow analysis process less effective.
What’s the Difference Between Order Flow and Market Profile
Market profile and order flow look at market activity in different ways. Market profile analyzes historical trading data, pinpointing areas where prices spent the most time (high volume zones) and areas with less activity. This helps identify potential support and resistance levels. Order flow, however, focuses on the real-time flow of buy and sell orders, including their size and type. This helps gauge current market sentiment (bullish or bearish) and predict potential price movements based on the current order imbalance.
Order Flow Trading Strategy PDF
Here’s a free PDF on Order Flow Trading Strategy PDF:
Order Flow Trading Strategy PDF
Bottom Line
The order flow trading strategy is essential and valuable to traders because, in high probability, it determines which direction the price will move. Most traders, especially beginners, enter trades at the wrong time only to get stopped. Order flow trading brings stability, and you ride with the big players rather than against them.
In my experience, order flow trading is perhaps the simplest way to trade the markets. Essentially, you look at level 2 market data with one eye on a price chart, and that’s it. From that point, you only need to learn how the specific market you trade on behaves and when and where to enter a trade based on the order flow trading strategy.
Risk Disclosure: The information provided in this article is not intended to give financial advice, recommend investments, guarantee profits, or shield you from losses. Our content is only for informational purposes and to help you understand the risks and complexity of these markets by providing objective analysis. Before trading, carefully consider your experience, financial goals, and risk tolerance. Trading involves significant potential for financial loss and isn't suitable for everyone.