The TTM Squeeze Indicator is a valuable tool for entering trades just before a significant ramp in price action takes place. It helps traders benefit from substantial price differentials by utilizing the firing the squeeze strategy. The indicator also helps traders identify breakouts after the price has been consolidated inside a range-bound area.
- The TTM Squeeze is a technical analysis indicator that measures price action volatility and market momentum and helps traders take advantage of changes in different market conditions.
- It combines three different trading tools to achieve this purpose effectively. The tools are the Bollinger bands, the Keltner channels, and momentum oscillators.
- A squeeze occurs when the price consolidates in a ranging market until enough pressure is built to cause a volatile breakout from the sideways market.
- The zero breakout, divergences, overbought and oversold levels are attributes to look out for before making major trading decisions.
This article describes all you need to know about the TTM Squeeze indicator, how to use it to find trading opportunities, and the merits and demerits of relying on it to place trades.
- What is the TTM Squeeze Indicator?
- How Does the TTM Squeeze Indicator Work?
- How to Use The TTM Squeeze Indicator in Trading?
- TTM Squeeze Indicator Trading Strategy Tutorial
- What are the Benefits and Limitations of the TTM Squeeze Indicator
- What Timeframe is Best for the TTM Squeeze Indicator?
- Which is Better, TTM Squeeze or MACD?
- What are the Best Day Trading Settings for the TTM Squeeze Indicator?
- Key Takeaways
What is the TTM Squeeze Indicator?
The TTM Squeeze momentum indicator helps traders identify levels where price action starts to race upward or downward, breaking out of a previously held sideways movement. The trick when using the TTM Squeeze indicator is to know when a market begins to trend following a period at which it stays inside a range-bound region.
Technically, the TTM Squeeze indicator is a sub-chart indicator with red and green dots appearing along the zero line. When there’s a squeeze condition in the market, a red dot is displayed (or a series of red dots), and a breakout is likely to occur. Once a green dot appears following a series of red dots, a scenario of firing a squeeze is about to happen, and the price is likely to rise sharply. On the other hand, a green dot or a series of green dots implies that the market is not in a squeeze condition, and the existing trend is likely to continue.
Additionally, the histogram bar (usually displayed in dark blue) presents the momentum around a central axis, the zero line. It can be used as another indicator to find areas where the price might reverse.
A key point to remember is that since the TTM squeeze indicator combines three different tools – Bollinger Bands, Keltner Channels, and Momentum Oscillators – it is considered among the most effective trading tools and indicators. Many traders particularly use the TTM squeeze indicator to identify a scenario of short-squeeze, which occurs when an asset is heavily shorted, followed by a sharp increase in price when market participants buy the asset at the bottom.
For those who are keen to learn about this phenomenon, we suggest reading about the infamous GameStop stock short-squeeze story.
How Does the TTM Squeeze Indicator Work?
So, how does the TTM squeeze work? Well, basically, the TTM squeeze indicator measures both volatility and momentum to identify trading opportunities where changes in these market attributes occur. The market’s price volatility is analyzed using two other indicators: the Bollinger bands and the Keltner channel.
The TTM Squeeze is a powerful tool for identifying periods of low volatility, often preceding significant price movements. But how exactly does it work? Let’s delve into the components that make this indicator tick:
1. Bollinger Bands
The Bollinger Bands are a widely used volatility indicator that consists of a moving average (typically 20-period) surrounded by two bands. The bands are set at a standard deviation distance above and below the moving average. A larger standard deviation indicates higher volatility, with the bands widening. Conversely, a smaller standard deviation signifies lower volatility, causing the bands to contract.
2. Keltner Channels
Similar to Bollinger Bands, Keltner Channels also depict volatility. However, instead of standard deviation, they use the Average True Range (ATR) to measure volatility. The Keltner Channels are constructed around a moving average (often the same 20-period used for Bollinger Bands), with two-channel lines placed a certain multiple of the ATR above and below the moving average. Just like Bollinger Bands, a wider channel indicates higher volatility, while a narrower channel suggests lower volatility.
3. Momentum Oscillator (Histogram)
This additional component provides clues about the potential direction of the breakout after a squeeze. The histogram oscillates above and below a centerline, with rising bars indicating upward momentum and falling bars suggesting downward momentum.
Bringing the Components Together
The TTM Squeeze leverages the strengths of both Bollinger Bands and Keltner Channels to identify squeeze conditions. Bollinger Bands offer a familiar volatility measure, while Keltner Channels can be less susceptible to outliers compared to standard deviation. By combining these two, the TTM Squeeze aims to provide a more robust way to identify potential breakouts from periods of low volatility.
When both the Bollinger Bands and Keltner Channels contract significantly, signifying a period of low volatility (squeeze), the TTM Squeeze Engine generates a red dot on the chart. This red dot serves as a visual alert for potential upcoming volatility or a breakout.
The appearance of a green dot following the red dot signifies a potential breakout. The direction of the momentum histogram (up or down) around the time of the green dot offers hints about the possible direction of the breakout.
How to Use The TTM Squeeze Indicator in Trading?
Different strategies have been developed for trading the TTM Squeeze indicator. Some of them are discussed as follows.
1. Zero Crossover
The Zero Crossover strategy is one way to trade the TTM Squeeze indicator. The logic is to find where the histogram bars cross the zero line after a squeeze fires and place a buy or a sell trade as required. Since you get a squeeze signal from the zero line dots (hence red and green dots), the TTM squeeze zero line crossover provides another confirmation to enter a trade.
Consider the following steps when using the Zero Crossover strategy to trade the TTM Squeeze indicator.
- Launch your TTM Squeeze indicator and adjust the parameter to suit your timeframe.
- Look out for a trigger of the squeeze by the appearance of red dots on the zero axis.
- Watch out for a cross of the histogram bars over the zero axis in an upward or downward direction.
- Place a buy when the first green dot appears, and histogram bars make a cross above the line.

2. Divergences
The Divergence phenomenon can also be observed on the TTM Squeeze indicator. For those unfamiliar with the technique, divergence in trading refers to a situation where there’s a discrepancy between the asset’s price and the indicator’s reading. Much like the RSI divergence or MACD divergence, this unique technique can also be used when trading with the TTM squeeze indicator.
In this case, you look out for a scenario when the rise or fall of the histogram bars and price action move in opposite directions.

To trade the divergences, you buy the bullish divergences and sell the bearish divergences.
Conditions for a bullish divergence are:
- The price makes a lower low, while the TTM Squeeze makes a higher low without crossing the zero line.
- The price makes a higher low, and the TTM Squeeze makes a lower low without crossing the zero line.
Conditions for a selling divergence are:
- The price makes a higher high, while the TTM Squeeze makes a lower high without crossing the zero line.
- The price makes a lower high, and the TTM Squeeze makes a higher high without crossing the zero line.
3. Overbought and Oversold
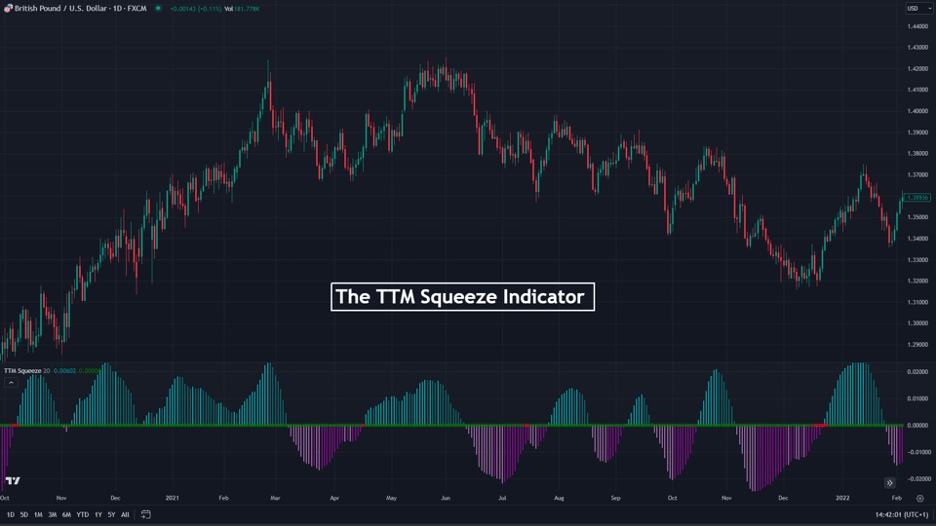
Another way to use the TTM squeeze indicator is by looking for overbought and oversold signals. The aim is to find a region where the asset is overbought or oversold and about to make a reversal. This technique can also be used with supply and demand levels, where you can find areas of strong support or resistance.
In the case of the TTM indicator, you are looking to enter a trade when the histogram bar values rise or fall above or below 0.04/-0.04. As you can see in the GBP/USD chart below, the price usually reverses when this happens.

Here are some key points to remember when using this strategy:
- Consider your overbought and oversold region based on the timeframe you are trading. The -0.04 and 0.04 levels are ideal on a daily time frame. But since the indicator doesn’t come with overbought and oversold level lines, you would have to draw them manually using the horizontal lines on TradingView.
- Place a buy when the bars exceed the oversold level (-0.04) to the downside and return to it. Also, place a sell on the first bar after the histogram has shot out of and returned within the 0.04 level.
TTM Squeeze Indicator Trading Strategy Example
The TTM Squeeze indicator can certainly help you to find buy and sell trades, set stop loss levels, and take profit targets. So, in this section, we will show two methods to trade the markets using the TTM squeeze indicator. The first is by using the zero crossover line and the squeeze signal. The second is using the divergence trading strategy.
Firing the Squeeze Strategy
The best way to use the TTM squeeze indicator is to look for the area where the squeeze is about to occur. As mentioned earlier, when there is a series of red dots, it essentially means the market is getting tighter or consolidating. Then, when the first green dot appears, the market is likely to change direction. This situation is also known as firing the squeeze, providing a strong signal for a sharp spike in price.

As you can see in the USD/JPY 1H chart above, a series of red dots is formed, which represents the squeeze. Then, when the first green dot appears following the series of red dots, the ‘firing a squeeze’ occurs, and you should enter a long position.
In the example above, stop loss can be placed below the lowest level of the previous price swing or at the support level of the range-bound area (since the market is in consolidation mode during the appearance of the red dot).
TTM Squeeze Divergence Trading
Another excellent way to use the TTM squeeze indicator is by utilizing the Divergence Strategy.
To identify a buy signal, look for areas where there are divergences in the movement of the price and the bars of the TTM Squeeze. For instance, a typical bearish divergence scenario would be when the price makes higher highs, but the TTM Squeeze makes lower highs without crossing the zero line.
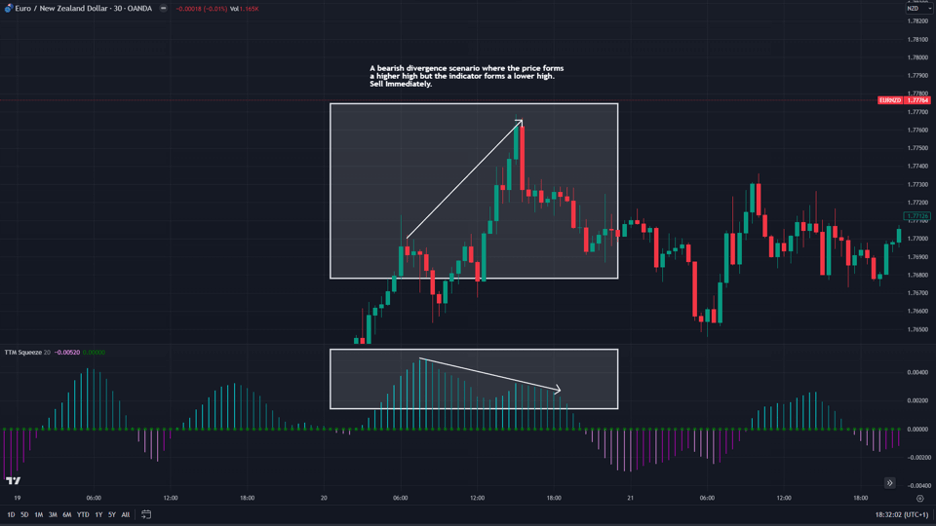
The image above is a perfect example of a bearish divergence scenario.
In the opposite scenario, bullish divergence would be when the price makes lower lows, but the TTM Squeeze makes higher lows.
What are the Benefits and Limitations of the TTM Squeeze Indicator?
The TTM Squeeze indicator is one of the best indicators for spotting price action volatility and momentum. However, it does have its limitations too. Some of the benefits and limitations of using the indicator are discussed below.
Benefits of Using the TTM Squeeze Indicator
When it comes to identifying changes in price volatility and taking advantage of this volatility to make a profit at the right time, the TTM Squeeze indicator does quite well. As a matter of fact, many professional traders will tell you that it is among the most reliable and effective indicators.
By combining the Bollinger bands, Keltner channel, and momentum oscillator, the TTM squeeze can presumably identify areas where the markets consolidated, hence the squeeze. Then, once the sentiment changes, the indicator can provide highly accurate signals.
Some of the benefits of the indicator are highlighted below.
Pros
- The TTM Squeeze indicator helps to identify when price action breaks out of a range
- The indicator points out buy and sell signals mostly at the right time, especially when using the firing the squeeze strategy
- The TTM Squeeze indicator is a powerful tool that provides accurate and reliable trading signals
- Since it is a sub-chart indicator, it leaves plenty of opportunities to mark up your charts with other relevant tools and indicators for better analysis
- It is straightforward to read and understand
Limitations of the TTM Squeeze Indicator
Much like any other technical indicator, The TTM Squeeze indicator also has some limitations. The main flaw of the TTM squeeze indicator is it can generate false signals. Often, the indicator might indicate that the squeeze is about to occur, but another push toward the previous price trend can happen. As such, even though the TTM squeeze includes three different indicators, you must use other technical tools to ensure the reversal and confirm the signal.
Cons
- The TTM Squeeze indicator is sometimes prone to giving false signals
What Timeframe is Best for the TTM Squeeze Indicator?
The TTM Squeeze indicator can be used on various time frames. The indicator’s parameters can easily be adjusted to suit any timeframe and your needs. The goldmine is figuring out the best settings for your timeframe, and you are good to go.
One key point to keep in mind is that whenever the squeeze fires following the appearance of the first green dot, the squeeze usually lasts between 8-10 candlesticks (or bars).
Which is Better, TTM Squeeze or MACD?
While the TTM Squeeze indicator helps detect price volatility and momentum, the MACD puts more emphasis on the current data because it uses the EMA, which is considered more sensitive. It also chooses different periods. The ability to show more updated market dynamics gives it some edge above the TTM Squeeze indicator.
Having said that, the TTM squeeze indicator is a more valuable tool for finding trade entry points. Unlike the MACD, the TTM does not provide many trading signals, but when it does, it is highly reliable.
What are the Best Day Trading Settings for the TTM Squeeze Indicator?
The default setting of -0.05 and 0.05 for the momentum oscillator of the TTM Squeeze indicator is best applicable for day trading. However, user experience may vary slightly. This could imply that the settings are altered personally to suit your needs.
Key Takeaways
- The TTM Squeeze indicator is a powerful indicator that helps traders to spot changes in price volatility and momentum using the squeeze market condition
- The indicator is particularly useful for identifying the squeeze when the markets are getting tighter followed by a sharp increase in an asset’s value, which is known as ‘firing a squeeze’.
- The parameters can be adjusted depending on the time frame. Following the appearance of the first green dot, the squeeze usually lasts between 8-10 candlesticks.
- To efficiently use the indicator, you must look out for triggers in price volatility with the first green dot followed by a series of red dots and check the momentum with the histogram bars.
Risk Disclosure: The information provided in this article is not intended to give financial advice, recommend investments, guarantee profits, or shield you from losses. Our content is only for informational purposes and to help you understand the risks and complexity of these markets by providing objective analysis. Before trading, carefully consider your experience, financial goals, and risk tolerance. Trading involves significant potential for financial loss and isn't suitable for everyone.