The Relative Vigor Index (RVI) is a technical indicator that measures the strength of price action in any direction in the market. It measures the intensity of a trend, using closing price values and the trading range of the corresponding period to evaluate its data, shedding more light on the likelihood of price action going further up or down.
- The Relative Vigor Index (RVI) indicator is a momentum oscillator that measures the strength of price movements.
- It compares the differences between a period’s closing price and opening price and the high and low of the same period.
- It is displayed as a momentum oscillator that ranges between -0.5 and 0.5 with a zero middle point.
- The RVI provides signals when the two indicator lines cross each other. Divergence is also an important concept to note for placing trades with the RVI.
At the end of this article, you will be well-informed about the workings of the Relative Vigor Index (RVI) indicator, its trading strategies, its benefits, and its limitations. So, let’s get right into it.
- What is the Relative Vigor Index (RVI) Indicator?
- How Does the Relative Vigor Index (RVI) Indicator Work?
- How to Use The Relative Vigor Index (RVI) Indicator in Trading?
- Relative Vigor Index (RVI) Indicator Trading Strategy Tutorial
- Relative Vigor Index (RVI) Indicator – Pros and Cons
- What are the Best Settings for the Relative Vigor Index Indicator
- What is the Difference Between the Relative Vigor Index and the Relative Strength Index?
- Key Takeaways
- Frequently Asked Questions
What is the Relative Vigor Index (RVI) Indicator?
The Relative Vigor Index (RVI) indicator is a momentum oscillator that captures the strength of price movements in the market. It seeks to evaluate the likelihood of price action continuing in the direction of an existing trend or making a reversal.
The RVI does that by comparing the close-open price differences with the high-low price range within a specified period. This period is ten by default on most trading platforms.
The indicator is a sub-chart indicator displayed below the main chart of the price action. It is a momentum oscillator with two lines that move up and down about a zero median, indicating a bullish or bearish trend. The indicator has two prominent lines: the green and the red line. These lines are two simple moving averages of different periods, and we discuss their relevance in the next section.

The idea of the RVI indicator is that asset prices tend to close lower than they open in a bearish trend and close higher than they open in a bullish trend. By doing so, the RVI aims to gauge whether the market is in an uptrend or downtrend, or whether it is about to reverse soon. As such, since the RVI helps traders predict future price movements, it is considered a leading technical indicator.
How Does the Relative Vigor Index (RVI) Indicator Work?
As mentioned, the Relative Vigor Index (RVI) indicator first evaluates the difference between every candlestick’s closing and opening prices in a given period, usually ten by default.
The indicator transforms the data obtained from this computation into a smoothed moving average. The same applies to evaluating the differences between high and low prices. The comparison between these two simple moving averages gives the RVI indicator two lines displayed as a sub-chart.
However, the indicator line works hand in hand with a signal line that helps determine a called signal. The signal line is a simple moving average of the RVI values initially calculated but this time, over a period of 4 as against the default ten-period of the RVI itself.
The following steps show how the RVI indicator calculates and draws out its chart lines.
Numerator = a + (2 x b) + (2 x c) + d6
Denominator = e + (2 x f) + (2 x g) + h6
RVI = SMA of Numerator for N periods/SMA of Denominator for N periods
Signal line = RVI + (2 x i) + (2 x j) + k6
Where:
- a = Close – Open
- b = Close – Open One Bar before a
- c = Close – Open One Bar before b
- d = Close – Open One Bar before c
- e = High – Low of Bar a
- f = High – Low of Bar b
- g = High – Low of Bar c
- h = High – Low of Bar d
- i = RVI value One Bar Prior
- j = RVI value One Bar Before i
- k = RVI value One Bar Before j
- N = Minutes, hours, days, months.
Take note that the default period parameter of the Relative Vigor Index (RVI) indicator is 10. The oscillator runs between the levels of -0.5 and 0.5. However, a trader can change these parameters based on a trading style and personal preferences. The cross between the RVI line chart (green) and the signal line (red) gives a signal to either buy or sell depending on the positions of the line.
How to Use The Relative Vigor Index (RVI) Indicator in Trading?
Trading with the Relative Vigor Index (RVI) indicator can help you take advantage of many profitable trade opportunities in the market. There are two significant ways to use the indicator in searching for trade signals. The first is the line cross between the RVI and signal lines. The other method is to check for divergence between the RVI line and the price action on the main price chart. We discuss these concepts below.
Green and Red Lines Crossover
As the RVI indicator consists of two lines, a crossover is the primary method of using it. A cross-over of the green RVI line and the red signal line is a signal call of the Relative Vigor Index (RVI) indicator. A crossover of the green line above the red line in an upward movement is an excellent bullish signal. The appearance of this crossover above the middle zero axis of the indicator further reinforces this prediction.
Conversely, a cross of the red line above the green line in a downward direction is a call to short the trade. The appearance of the cross below the zero line reinforces this.
Divergence
Sometimes, the RVI line chart moves in the opposite direction of the price action. This phenomenon, known as divergence, is often used by traders to identify trade opportunities. When price action moves upward while the RVI line simultaneously moves downward, this is known as a bearish divergence.
It shows that though the price may increase, the strength of this upward movement is decreasing, and the sellers’ pressure may soon begin to weigh in. When this happens, place a sell order after confirming with other technical analysis tools.
Conversely, a bullish divergence is a price action movement towards the south while the RVI indicator line moves up. Enter a buy market after confirming with other tools in this situation.
Relative Vigor Index (RVI) Indicator Trading Strategy Example
To enhance the accuracy of trade signals generated by the Relative Vigor Index (RVI) indicator, it is best to combine the indicator with other technical analysis tools before placing a trade. Therefore, some valuable strategies can be used when connecting the RVI with other indicators.
In the following examples, we show two effective trading methods – using the RVI with the RSI and the RVI with the Fibonacci retracement levels.
Relative Vigor Index (RVI) indicator with RSI
The RVI can be effectively combined with the RSI indicator. The gateway to a trade entry is to find where both indicators call at very short intervals from one another. Since the RVI is one of the leading indicators, you await its signal in this example before confirming with the RSI indicator. For example, here is how you should place a buy position on your chart.
1. Identify the trend in the market. We recommend that you only place trades in accordance with the prevailing trend.

2. Launch your RVI and RSI indicators on your chart.
3. Observe a cross-over of your green line upward and above the red line of the RVI indicator.
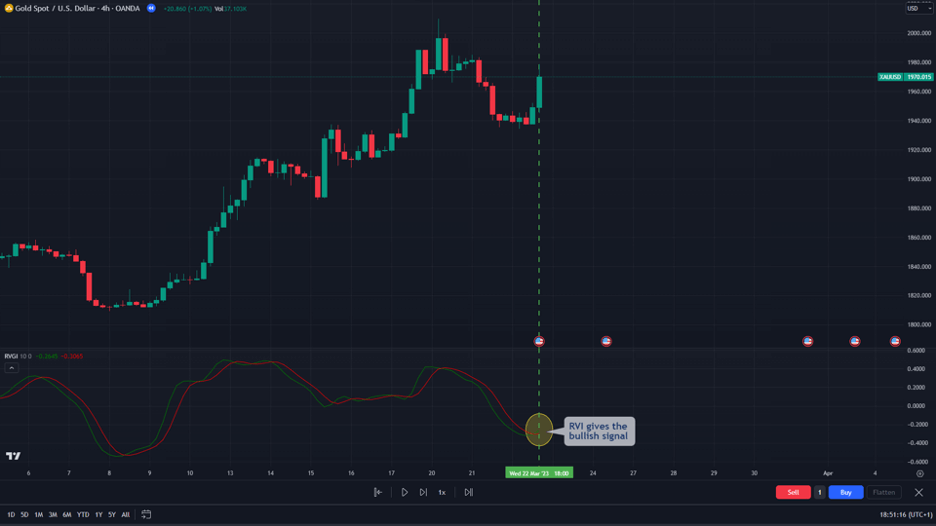
4. On the RSI indicator, wait for it to generate trading signals. If both indicators give a bullish signal (as you can see in the image below), you can use this price level as a buying position entry level.

5. Enter a buy position at the exact point where the two indicators generate trading signals.
6. Place your take profit target when the lines of the RVI switch. This again should be confirmed with the crossover of the RSI too. The same can be applied to setting your stop loss order or setting your SL using any technical analysis tool.

To place a short-sell trade, follow the same guideline with a reverse of the signals observed. In such a case, the RVI green line must cross below the red line, and the RSI should confirm this bearish signal.
Relative Vigor Index (RVI) Indicator and Fibonacci Retracement Levels
The Relative Vigor Index (RVI) indicator can also be combined with Fibonacci retracement levels to find a confluence of their trade signals. Here, we observe when the RVI lines cross at the same region of a significant Fibonacci retracement level.
To utilize this strategy, consider the following steps in using the RVI with the Fibonacci retracement tool to enter a long position.
1. Launch your RVI indicator on your chart.
2. Observe the current trend. In the chart below, for instance, the current trend is bearish. So, we’re looking for a bearish trade.

3. Draw your Fibonacci line from the swing low to the swing high on the same chart. As seen in the XAU/USD chart below, the Fibonacci indicator automatically generates the retracement levels.
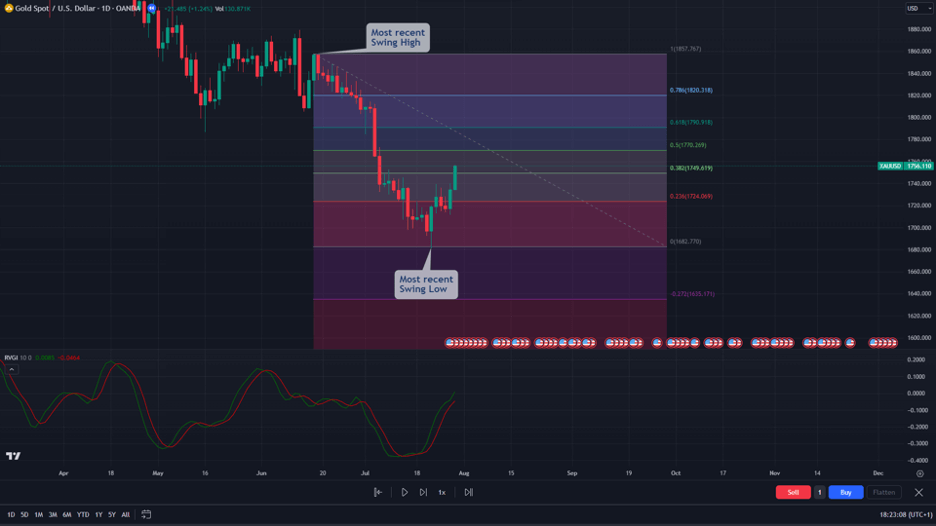
4. Observe where the cross of the green RVI line below the red signal line coincides with a retracement from any of the Fibonacci levels.
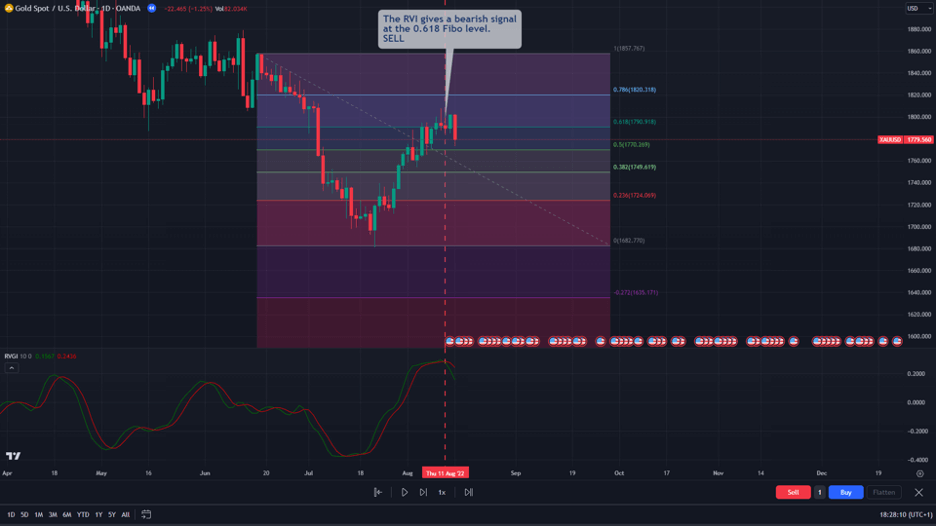
5. Sell at that level and place your stop loss anywhere above your Fibo level. You can also place it above the next level above your Fib level. Take your profit when the RVI changes its signal. You can also take your profit when the price reaches the 0 level of the Fibonacci level.

To place a buy trade, follow the same guideline with a reverse of the conditions as mentioned above. Your RVI green line should cross above the red line and draw the Fibonacci line from a swing low to a swing of an uptrend.
Relative Vigor Index (RVI) Indicator- Pros and Cons
The Relative Vigor Index (RVI) indicator is helpful in getting into a trade as it helps a trader realize the trend’s strength before entry. It also has limitations; for instance, in most cases, combining the indicator with other tools is essential. To clarify things, we discuss some of the benefits and limitations of the RVI indicator below.
Benefits of Using the Relative Vigor Index (RVI) Indicator
The Relative Vigor Index (RVI) indicator is an excellent tool for finding price levels to enter a trade, whether the market is trending or reversing. It is a leading indicator that calls its signal before price action follows suit. The indicator is also very compatible with many other technical analysis tools, which greatly enhances results. Some of the benefits of the RVI are listed below.
Pros
- The Relative Vigor Index (RVI) indicator is a reliable trading tool to identify the strength of price action movements
- It is a leading indicator, meaning it calls signals before price action follows the direction of the signal
- It can be easily combined with other indicators, greatly enhancing the indicator’s accuracy and effectiveness
- It is straightforward to read and interpret
Limitations of the Relative Vigor Index (RVI) Indicator
As with many other indicators, the Relative Vigor Index (RVI) indicator has its setbacks too. A major one you encountered while going through this piece is the complexity of its derivation formula. It also may generate wrong signals once in a while. Hence, you must use the RVI with other tools. Some of the limitations of the RVI are:
Cons
- The Relative Vigor Index (RVI) indicator also may generate false signals. Traders must confirm its signals with other indicators and tools before entering a trade
- The formula for calculating the RVI is quite complicated. This makes the calculation easily prone to error when done manually
What are the Best Settings for the Relative Vigor Index Indicator
The default setting of the RVI indicator is 10. However, you can reduce this figure to make the indicator more sensitive to price movements, hence, better suited for short-term trading. Similarly, you can increase the figure to make the indicator less sensitive to slight price fluctuations and false signals, making it better suited for longer-term traders.
What is the Difference Between the Relative Vigor Index and the Relative Strength Index?
The Relative Vigor Index (RVI) and the Relative Strength Index (RSI) are both popular momentum indicators, but they are built very differently and serve slightly different purposes. The RSI measures the speed and change of recent price movements by comparing the magnitude of recent gains to recent losses, while the RVI focuses on the relationship between a security’s closing price and its opening price within the context of the day’s total price range
When it comes to trading applications, RSI is generally used to identify potential reversal points when price action becomes stretched, often during strong trends or near major support/resistance levels. RVI, however, is more focused on confirming trend strength or weakness based on how the market closes relative to its daily range. It is especially valued for detecting early signs of momentum shifts through crossovers and divergences.
In summary, while both indicators help you assess momentum, RSI is simpler and bounded, which is ideal for spotting overextension. At the same time, RVI provides a more nuanced view of price “vigor” relative to the trading session. Choosing between them often depends on whether you want to measure price strength relative to past gains and losses (RSI) or price action relative to intraday behavior (RVI).
Key Takeaways
- The Relative Vigor Index (RVI) indicator is an effective tool for measuring the strength of a prevailing market trend.
- It is an oscillator running between the -0.5 and 0.5 levels, although this can be altered based on the trader’s preference.
- The indicator calls a signal when its two lines make a cross or when there is a divergence between its lines and price action.
- For best results, combine the RVI indicator with RSI, MACD, and Fibonacci retracement tools.
Frequently Asked Questions About the Relative Vigor Index Indicator
The following are some of the most frequently asked questions about the Relative Vigor Index (RVI) Indicator.
How to trade with the Relative Vigor Index indicator?
The RVI indicator is traded using the crossover of its lines and the divergence of its lines from price action. A crossover of its two lines is an indication to place a trade. Yet, the RVI should be combined with other indicators like RSI, MACD, and Fibonacci retracement tools to place a trade.
Can I use the Relative Vigor Index on MT4/MT5?
You can use the Relative Vigor Index indicator on MT4 and MT5. It is among the indicators that are custom-built into the MetaTrader platforms.
Risk Disclosure: The information provided in this article is not intended to give financial advice, recommend investments, guarantee profits, or shield you from losses. Our content is only for informational purposes and to help you understand the risks and complexity of these markets by providing objective analysis. Before trading, carefully consider your experience, financial goals, and risk tolerance. Trading involves significant potential for financial loss and isn't suitable for everyone.