The Williams Percent Range (WPR) indicator is a momentum-based oscillator used to identify potential reversals of price action in the market. It uses the relationship between the close price and the high-to-low price range to determine overbought and oversold conditions in the market, enabling traders to get into new trade opportunities after price action reversal.
- The Williams Percent Range (WPR) indicator is a momentum-based indicator used to identify overbought and oversold conditions in the market.
- It compares the closing price of an asset to its high-low price range over a specified period.
- WPR values range from 0 to -100, with readings below -80 suggesting oversold conditions and readings above -20 suggesting overbought conditions.
- Traders use the WPR with other indicators, such as the Exponential Moving Average (EMA), to make better-informed trading decisions and improve results.
In this comprehensive piece, we’ll explore what the Williams Percent Range indicator is, how it works, and strategies for using it effectively in your trading journey. We also highlight some of its benefits and limitations.
 Table of Contents
What is the Williams Percent Range Indicator?
The Williams Percent Range (WPR), also known as the Williams %R indicator, is a momentum indicator traders use to identify overbought and oversold levels in the market. These conditions are essential for predicting potential price reversal points in the market. The renowned trader and author Larry Williams developed the indicator, which is essentially a normalized version of the Stochastic Oscillator.
Technically, the WPR compares the closing price to the range between the high and low prices over a given number of periods and comes up with an oscillator that moves between 0 and -100. Like most indicators, the indicator chart is shown as a sub-chart below the main chart of the asset pair.

The default look-back period for the WPR is 14. However, many traders change this setting to suit their preferences and timeframes. In conjunction with other indicators, traders effectively pick out entry and exit points in the market, especially by using the indicator to find potential reversal price levels.
How Does the Williams Percent Range Indicator Work?
To develop an oscillator that moves between the 0 and -100 range, the WPR indicator first records the high and low prices for each period over the look-back periods, usually 14.
The indicator then notes the closing, high, and low prices in the 14th period and inputs the values in its formula shown later on. In the 15th period, it records the low, high, and closing prices, but this time, only for the past 14 periods, and computes the new WPR with the formula.
This cycle continues as each new period ends, calculating the WPR strictly for the past 14 periods.
The formula for the WPR indicator is as follows.

Where:
H = Highest price in the lookback period. (Default is 14)
C = Most recent closing price.
L = Lowest price in the lookback period.
Generally, we can say that the WPR indicator is an improved and more sensitive version of the Stochastic oscillator. Readings above -20 indicate that price action is in an overbought market condition. Price may only pull back after some time. However, it tells you that the price is near the high of its recent price range.
The actions succeeding this observation help traders make an informed decision. Readings below -80 and close to -100 suggest that price action is oversold.
How to Use The Williams Percent Range Indicator in Trading?
Primarily, the Williams Percent Range (WPR) indicator is used to identify overbought and oversold levels in the market. It is similar to the Commodity Channel Index indicator, or the RSI Stochastic indicator. But in addition to that, the WPR indicator can also be used to identify building market momentum. This is done using the -50 line that represents a shift in market sentiment.
The overbought condition occurs when the buying pressure peaks and the selling pressure begins to gather momentum, causing price action to head for a possible reversal. This region ranges between the 0 and -20 readings of the WPR.
When price action lies in the overbought area, you can look for sell opportunities when the WPR hovers around 0-20. However, it is suggested to wait for the indicator’s line to retrace below the -20 to enter a short-sell position.
Conversely, an oversold condition occurs when the selling pressure nears the maximum, and the buying pressure begins to rally. In this condition, price action also heads for a possible reversal in the uptrend. The readings for the oversold condition on the WPR are -80 to -100. In that case, you should consider buying opportunities when the WPR crosses into this region and retraces out of it above the -80 level. Otherwise, consider a short position if WPR retraces and continues to head towards the -100 level.

Another way traders use the WPR is the divergence analysis. Divergence occurs when WPR and price action go in opposite directions. When the WPR indicator makes a higher high and price action makes a lower high, this indicates a bullish divergence. On the other hand, when WPR makes a lower low and price action makes a higher low, this implies a bearish divergence. Divergence can be a powerful tool for anticipating price movements.
Finally, you can combine the WPR in a strategy with any other helpful indicator. For instance, you can combine WPR with a moving average. Moving averages help you confirm your trade bias with their relative position to the price action. When the WPR indicator gives a signal, confirm what the moving average does with price action. We describe this trading strategy explicitly in an example in the next section.
Williams Percent Range Indicator Trading Strategy
In this section, we consider step-by-step procedures for trading the Williams Percent Range strategy. Our trading example will show you how to combine WPR with a moving average to increase the accuracy of trading signals. When WPR calls a signal, we confirm the signal with an Exponential Moving Average (EMA) before getting into a trade. Let’s see how it works.
Williams Percent Range Indicator and Moving Average Trading Strategy
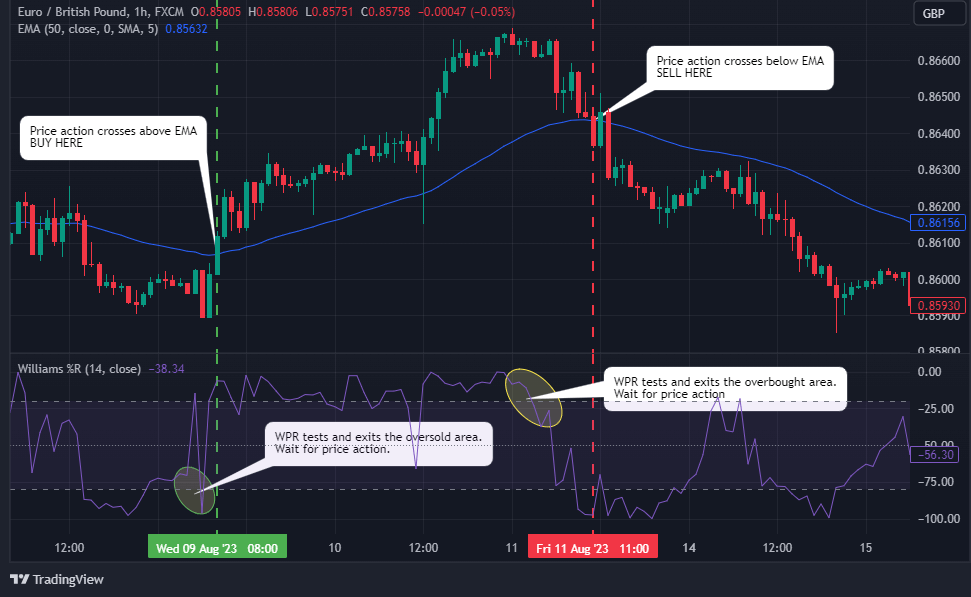
With this trading strategy, the Williams %R generates signals when it gets into an overbought/oversold region and retraces. Then, we wait for price action to cross our moving average in the direction of the signal called by the WPR. We get into a trade when WPR and moving average are in sync direction-wise on the EURUSD currency pair. In this example, we use the 50-period EMA.
Trade Entry
Launch your WPR indicator on your chart. It is displayed as a separate chart below the price chart. We maintain the default 14-period setting. Also, launch your 50 EMA on your price chart. Price action crosses the EMA intermittently.

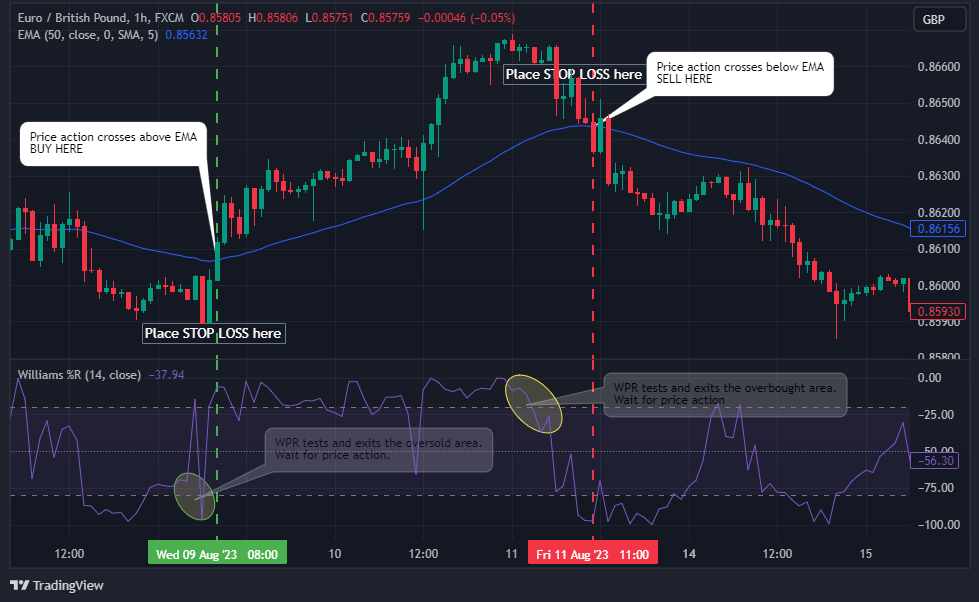
Once the WPR crosses in and out of the overbought territory, wait for price action to cross the EMA from up to down. That is your Sell opportunity. Otherwise, when WPR tests the oversold territory and heads back towards -80, wait for price action to cross above EMA in an uptrend to enter a long position.

Stop Loss
Place your stop loss below the nearest swing low for a buy trade and the closest swing high for a sell trade.

Take Profit
You can exit your trades when the EMA changes the direction of its signal. You can also set your take profit levels using a 1:2 risk-to-reward ratio. And of course, you may also use other technical analysis tools at your disposal to set your take profit level.
Williams Percent Range Indicator – Pros and Cons
The Williams Percent Range oscillator effectively observes overbought and oversold market conditions. It helps traders garner deep insight into the prevailing market conditions and predetermine the future behavior of price action. Yet, WPR poses certain limitations that sometimes render it somewhat inefficient. The benefits and limitations associated with the WPR are as follows.
Benefits of Using the Williams Percent Range Indicator
Knowing when buy and sell pressures peak and reduce is a useful strategy for effective trading. The WPR indicator quickly alerts you when the market fits these conditions. You can increase your win rates by combining the WPR with another indicator that helps. Some benefits of the WPR indicator are as follows.
Pros
- The WPR indicator is a great trend reversal strategy tool
- It also helps traders detect a new trend early by its divergence analysis
- The indicator is straightforward to read and understand. The reading of 0 to -100 is very simple
- The WPR can be used on different timeframes and with various assets
Limitations of the Williams Percent Range Indicator
Like any other trading indicator, the Williams Percent Range indicator is imperfect. For this, traders always look to combine it with other tools. Below are some limitations that make the WPR less favorable.
Cons
- The WPR does not work well in choppy markets. Hence, it produces many false signals when the market is moving sideways
- WPR is a lagging indicator. Sometimes, this lag is significant behind price movements
- Combining the indicator with others is essential for more reliable signals
- Divergence analysis can be subjective. It, therefore, requires experience from traders
Key Takeaways
 Key Takeaways
- The Williams Percent Range is a valuable tool for traders to identify overbought and oversold levels in the financial markets.
- The indicator’s values range between the 0 and -100, with readings above -20 indicate that price action is in an overbought market condition and readings below -80 indicate that price action is in an oversold market condition.
- The -50 middle line can also be used to identify shifts in market momentum.
- It can be used with other trading tools to approve the accuracy of trade signals.
- Traders can use WPR in divergence strategies that help traders get into new trades early enough.
- Effective risk management is crucial when trading the WPR to mitigate potential losses.
Frequently Asked Questions
The following are some of the most frequently asked questions about the Williams Percent Range Indicator.
What are the best settings for the Williams Percent Range?
The best settings for the WPR depend on your trading style and the assets you are trading. However, the most commonly used setting is the default 14 period, which calculates WPR over the past 14 periods. Traders may adjust this period to suit their specific trading strategies and timeframes.
What is the range of Williams Percent on TradingView?
On the TradingView trading platform and many other trading platforms, the WPR typically ranges from 0 to -100. Readings above -20 are overbought, while readings below -80 are oversold.
What is the difference between RSI and Williams Percent Range?
The Relative Strength Index (RSI) and Williams Percent Range (WPR) are both momentum oscillators used in technical analysis but differ in some ways. Firstly, RSI measures the speed and change of price movements, typically calculated based on a 14-lookback period. WPR calculates the Percent of the current closing price relative to the high-low range over a specified period. Also, RSI typically ranges from 0 to 100, with readings below 30 suggesting oversold and readings above 70 indicating overbought conditions. WPR, on the other hand, ranges from 0 to -100, with readings above -20 suggesting overbought and readings below -80 indicating oversold conditions.
Risk Disclosure: The information provided in this article is not intended to give financial advice, recommend investments, guarantee profits, or shield you from losses. Our content is only for informational purposes and to help you understand the risks and complexity of these markets by providing objective analysis. Before trading, carefully consider your experience, financial goals, and risk tolerance. Trading involves significant potential for financial loss and isn't suitable for everyone.


