


The bullish hammer is a single candle pattern found at the bottom of a downtrend that signals a turning point from a bearish to a bullish market sentiment.
Traders use this pattern as an early indication that the previous is about to reverse and to identify a reliable price level to open a buy trade.
- The Bullish Hammer Candlestick Pattern is a significant reversal indicator, typically appearing at the bottom of downtrends, signifying potential bullish momentum.
- Characterized by its small body and long lower wick, the Bullish Hammer suggests strong buying pressure following an initial sell-off.
- This pattern is a favorite among traders for its reliability in indicating a shift from bearish to bullish sentiment, often validated by subsequent bullish candles or volume increases.
In this post, we’ll cover everything you need to know about the bullish hammer pattern, including how to identify and use this pattern as part of your trading strategy.
What is the Bullish Hammer Candle Pattern?
The bullish hammer is a single candlestick formation that appears at the bottom of a bearish trend and indicates that the market sentiment is about to change.
This candle pattern is characterized by a small real body (the difference between the opening price and the closing price) and long lower shadows, creating the shape of an inverted hammer.
In a way, the bullish hammer candlestick pattern is part of the Doji candlesticks family that usually signals a reversal in price action. However, while the Doji candle pattern usually indicates indecision in the market, the bullish hammer candlestick provides a stronger signal for a trend reversal due to increasing buying pressure at the end of a downward trend.
The opposite version of the bullish hammer is known as the hanging man candlestick pattern which has a formation of a bearish inverted hammer and indicates that the market will change direction from a bullish trend to a bearish one.
How to Identify and Use the Bullish Hammer Pattern in Trading?
Spotting the bullish hammer candlestick is not a difficult task. As the pattern consists of only one candle, you’ll notice this type of candlestick pattern many times. However, you need to keep in mind that the pattern has different meanings when it appears in certain conditions.
Crucially, the pattern could indicate a trend reversal, or it may appear during a correction of the primary trend. As such, when you identify the pattern, you need to be alert to the situation in the market and interpret it correctly.
Nonetheless, to identify the bullish hammer pattern, you need to spot the following:
- The bullish candle hammer occurs at the bottom of a downward trend
- It has a small body and a long lower wick
- Another bullish confirmation candle must appear following the bullish hammer candle
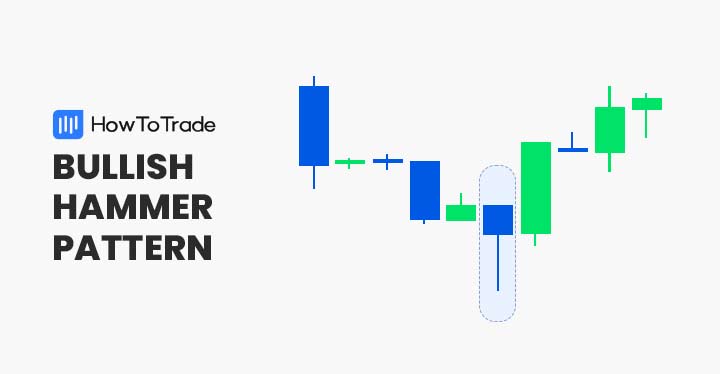
Now, let’s see what the bullish hammer candle looks like on a candlestick price chart.

As you can see, the bullish hammer candlestick (a green candle in this case) appears following a bearish price movement and indicates a sentiment turning point.
So, here are the steps you need to follow when you identify the bullish hammer candlestick on price charts:
- Identify the bullish hammer candle pattern at the bottom of a bearish trend
- Add additional indicators to confirm the reversal – RSI, MACD, and Fibonacci levels
- Enter a long position when one of the next candles following the bullish hammer closes above it
- Set a stop-loss order at or below the lowest level of the bullish hammer candle and a take profit target at the highest level of the previous trend
How to Trade the Bullish Hammer Candle (Trading Strategy)
Trading the bullish hammer candle patterns means you are looking to enter a long position at the bottom of a downward trend. The pattern can certainly assist traders in identifying a reversal in the price action, regardless of the trading strategy they use. However, due to the high risk of buying a financial asset at the bottom levels, traders use other trading strategies to confirm the reverse and ensure they are entering a trade at the right time. Let’s take a closer look at two of these strategies.
1. Confirm a Trend Reversal and Find an Entry-Level
After identifying the bullish hammer candle, you first need to… enter a trade, which is, after exiting a transaction, the hardest thing in trading. As we mentioned, the bullish hammer pattern forms at the end of a downward trend, meaning at the lowest levels near a resistance breakout area. Therefore, it is vital to use other technical indicators to confirm the reversal.
The Relative Strength Index (RSI) and the Moving Average Convergence Divergence (MACD) are two effective trend reversal indicators. Adding them together to a trading chart as an extra confluence trading tool is very simple, and you basically are looking for a crossover or other indication that signals a potential price reversal.
In the example below, we identified a bullish hammer pattern at the end of a downward trend (this time, the candle is red). As you can see, the indicators show that the current trend is losing market momentum.
Then, as soon as you identify a candle that closes above the closing prices of the bullish hammer candle, you can enter a long trade (as you can see in the EUR/USD chart below).

2. Set a Stop-Loss Order and Take Profit Target
Fibonacci retracement levels are the ultimate indicator to detect critical support and resistance levels. By many opinions, every trader must learn how to use a Fibonacci retracement tool. Simply put, these levels are being widely used by many traders, which clearly makes them more significant than they otherwise would be.
In the 30-minute EUR/USD chart below, we used Fibonacci retracement levels to identify resistance and support points. Note that in our example, the lowest point of the bullish hammer is also the lowest support level of Fibonacci retracements.
So, in this case, it’s best to place your stop loss below the lowest price level of the bullish hammer candle. As for taking profit targets, you can place the order at one of the following Fibonacci ratio levels.
In our example, the 23.6% Fib level is the first target, and the 38.2% is the second take profit target. If the price breaks above the 23.6% level, you can change your stop-loss order and use a trailing stop-loss trading technique to ensure you will end up with a profit.

The Bullish Hammer Pattern – Pros and Cons
These are the most common pros and cons of trading the bullish hammer pattern:
Pros
- Easy to identify
- A reliable chart pattern
- Works well with trend reversal indicators and Fibonacci levels
Cons
- It does not indicate the exact level of a reversal
- May produce false signals – traders need to confirm the pattern with other indicators
Key Takeaways
Here are the key takeaways to remember when using the bullish hammer candle pattern:
- The bullish hammer is a single candlestick pattern that appears at the end of a bearish trend and indicates a potential price reversal
- The reversal pattern is characterized by a candle with a small body (red or green) and a long lower shadow
- Traders use this chart pattern to predict a reversal in market sentiment and to find buying opportunities
- To trade the bullish hammer pattern, you need to confirm the pattern with other technical analysis indicators. Once you get the confirmation, place a buying order at the next candle that closes above the bullish hammer candle
- Stop-loss is placed at the lowest (or below) level of the bullish hammer candle. Take profit is located at the highest price level of the previous bearish trend
Frequently Asked Questions about the Bullish Hammer Candle
Here are some of the most frequently asked questions about the bullish hammer pattern in forex trading:
Is the bullish hammer candle red or green?
Unlike many other single candlestick patterns, the bullish hammer candle can be either red or green. As long as it has a long lower wick and a small body, the candle’s color does not matter.
What type of chart pattern is the bullish hammer pattern?
Although it is most recognized as a bullish reversal candlestick pattern, the bullish hammer candle is either a trend reversal or a continuation pattern. Therefore, it largely depends on the candle’s location on candlestick charts. In some cases, you’ll be able to identify the bullish hammer pattern after a minor price correction during a long bullish trend and, therefore, use it to enter an existing bullish trend.
What is the difference between bullish hammer candlestick patterns and Doji candle patterns?
First, Doji candlesticks and bullish hammer candles have different structures and formations. The bullish hammer has a small body and a long lower shadow, while the Doji candle has long upper and lower shadows. More importantly, the Doji candle indicates indecision between buyers and sellers and suggests that the market is in neutral mode. On the other hand, the bullish hammer suggests that the selling pressure is about to end, and a new bullish trend is starting.
Risk Disclosure: The information provided in this article is not intended to give financial advice, recommend investments, guarantee profits, or shield you from losses. Our content is only for informational purposes and to help you understand the risks and complexity of these markets by providing objective analysis. Before trading, carefully consider your experience, financial goals, and risk tolerance. Trading involves significant potential for financial loss and isn't suitable for everyone.


