What Is Fundamental Analysis in Stock Trading?
When trading stocks, there will be times when you will struggle to pick your next investment. Or, as we call it, you will experience a stock-picking bug. In other scenarios, you might have to make crucial decisions when you have an open position. We’ve all been there. It’s not a good feeling, but luckily for you (and me and everyone else), there are specific tools to help us choose our investments.
Tools such as Fundamental Analysis. Now, before I even go any further, it is important to mention that wherever you are in your trading journey, learning about fundamental analysis is absolutely vital for your future as an investor (so don’t skip this lesson). Without fundamental analysis, it’s like turning up to hand-to-hand combat with no hands…
But as always, we got you covered! So, in this lesson, we will teach you what fundamental analysis is and how to use it as part of your stock trading strategy. So, keep on reading to learn all about fundamental analysis.
What Is Fundamental Analysis?
Fundamental analysis, or FA, studies the key factors to determine the financial health of an organization. In stock trading, the analysis takes several factors into account, including financial reports, GDP, inflation rates, employment data, interest rates, financial statements, the company’s business model, annual reports, and market news and announcements.
Generally, while technical analysis is used to find market trends and repetitive chart patterns using price and volume data, fundamental analysis differs because it attempts to measure the stock’s intrinsic value. As such, while technical analysts usually aim to predict short-term price movements, fundamental analysts are considered value investors and often use this method as a medium to long-term investment strategy.
The main goal is to find whether the stock’s current price reflects a value that is different from what the fundamental factors and prevailing market sentiment may suggest. And if this difference is found, an investment opportunity may be awaited.
In stock trading, the fundamental analysis consists of three main parts:
1. Economic Analysis
An investor can perform a fundamental analysis by looking at various macroeconomic factors such as interest rates, inflation, employment reports, non-farm payrolls, and GDP levels. The economic analysis helps a trader evaluate the economic growth of an economy or the global economy. Usually, when the economy grows, stock prices are expected to rise and vice versa.
2. Industry Analysis
By performing fundamental analysis, an investor can identify the industries and sectors of the economy offering the best investment opportunities. For example, investors might choose to invest in the cannabis or renewable energy companies as these have high potential returns. In this case, an investor will analyze the industry, the return on investment expectations, and the industry’s future growth.
3. Company Analysis
When conducting a fundamental analysis of a specific company, an investor looks at a company’s earnings, profit margins, future growth, and returns on equity. This is to know if a company is profitable or expected to be profitable soon (usually, growth stocks).
Fundamental Analysis Key Factors
Now, after we have covered the three parts of stock fundamental analysis, let’s take a closer look at the key factors from all three groups above to watch out for when using fundamental stock analysis.
1. Financial Statements – Earnings Reports
First things first, check the company’s earnings. Super, mega important. It’s what an engine is to a mechanic.
This figure will give you an insight into how much money a company is making and how much it is likely to make in the future. And that’s one of the most important, if not the most critical you should always look at. You can find the company’s financial statements in the company’s report earnings that are released every quarter.
If a company’s profits are on the rise, this generally leads to a higher stock price. On the other hand, if the profits fall shorter than expected, the market can hammer the company’s stock price. Moreover, on a company’s financial statements, you can find valuable information like the company’s balance sheet, income statement, cash flow statement, etc.
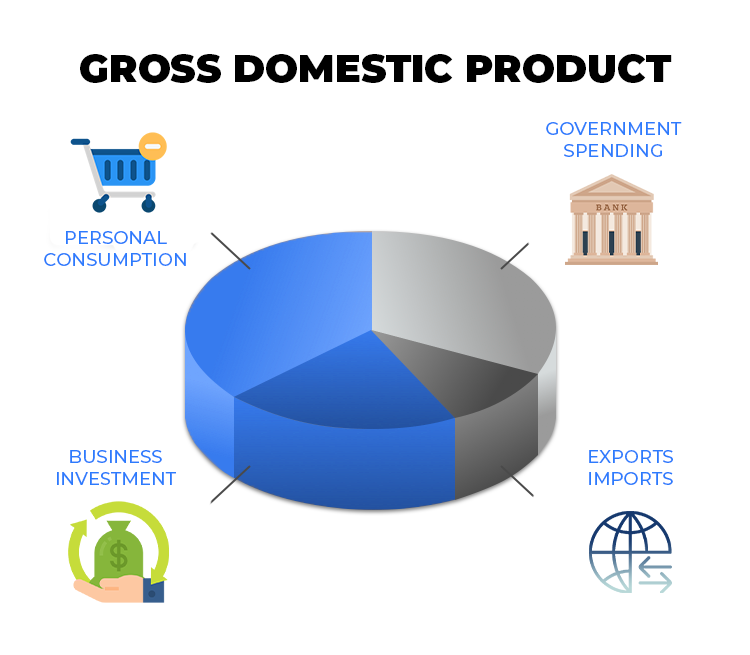
2. GDP (Gross Domestic Product)
The GDP report is one of the most important of all economic indicators. GDP stands for the gross domestic product or the total value of the goods and services produced in a country over a specified period. It is used as an indicator of the size and health of a country’s economy.
3. Interest Rates
Interest rates make the stocks go around! Seriously, the stock market is ruled by global interest rates, much like the forex market. All of the above-mentioned economic reports are closely watched by central banks to gauge the overall health of the economy.
Then, the central bank can use the tools at its disposal to lower, raise, or leave interest rates unchanged, depending on the evidence it has gathered on the economy’s health. When a piece of economic data is released, the fundamental analysis provides insight into how price action should or may react to a specific economic event.
Furthermore, most economic data directly impacts the central bank’s interest rate decision. For example, in the US, investors will look closely at the non-farm payrolls as it indicates the economy’s strength and can impact the next interest rate decision. Therefore, when NFP data is released, the market volatility rises, and the stock market usually takes a direction.
4. CPI (Consumer Price Index)
The Consumer Price Index (CPI) is an important economic indicator released regularly by central banks to give a timely glimpse into inflation levels.
Inflation tracked through CPI looks specifically at purchasing power and the rise of prices of goods and services in an economy, which can be used to influence a nation’s monetary policy. When CPI rises, interest rates will increase and vice versa. When the interest rate rises, the stock market usually falls and vice versa.
5. Follow the News
Finally, when trading stocks, you always need to follow the news. Maybe the company has signed a deal with another company, the CEO has resigned, or someone said something that may impact the stock price. For that purpose, you need to find a reliable news source and perhaps even use Twitter hashtags and follow leading trader accounts on social media platforms.
Summary – Putting Your Fundamentals To Work
To sum up, those are the top factors that fundamental traders use to analyze, in a nutshell. Of course, how you use each element depends on the kind of stock you are looking to invest in. One thing is for sure; you must know how to use fundamental analysis for stock trading. Even if you plan to rely on technical analysis and the efficient market hypothesis primarily, it is crucial that you follow the news and know how to interpret key fundamentals.
Ultimately, most traders believe that the best approach is to combine fundamental and technical analysis. As you might already know, investing involves risk so you’ll have to use every possible tool and technique to increase your chances of success. So, we think you are ready to learn about technical analysis and move on to the next step of combining technical and fundamental analysis.


Up To $5,000 Credit!
- Trade 1,000’s of global markets.
- 0% deposit and withdrawal fees.
- Rapid funding turn-around times.
- Trade on MetaTrader 4 and 5.