Price action trading involves analyzing price movement over time, using chart patterns and candlestick formations to make trading decisions. It strips away the use of indicators and focuses on pure price dynamics between the bulls and the bears.
Price action traders use tools like chart patterns, candlestick patterns, support and resistance levels, and trend lines to predict the market sentiment and direction. In this post, we’ll deal with one of the biggest price action trading strategies: Price Action Patterns.
What are Price Action Patterns?
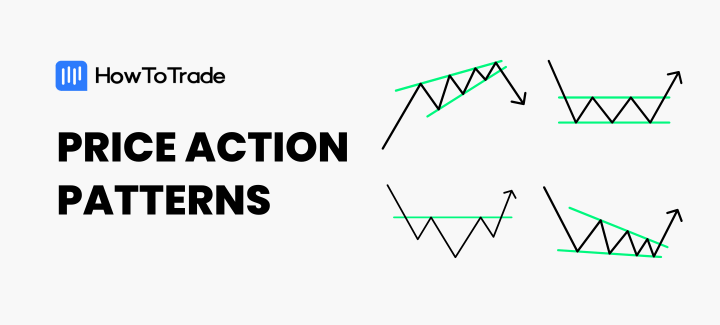
Price action patterns are visual representations of price movements on the chart that appear often and have predictable outcomes. Instead of relying on indicators, price action traders observe how the past and current movement of the market to predict future moves.
Many traders see price action pattern trading as more reliable than trading with indicators, as it focuses on the actual data rather than derived signals. However, the profitability of any trading style depends more on the trader than the trading tool. That said, price action patterns can be a potent weapon in the arsenal of a trader who knows how to use it.
A price action pattern may be made up of as little as a single candlestick to as many as tens of candlesticks. Candlestick patterns are what we call those patterns that are made of less than four candlestick patterns. However, patterns that are interpreted by the shapes they form on the chart are called chart patterns. Chart patterns usually take many candlesticks to form.
What are the Types of Price Action Patterns?
Depending on the bias that the pattern predicts, there are two major price action patterns: reversal and continuation patterns.
Reversal patterns, when they appear, suggest that the current trend is likely to reverse. So, if a price action pattern appears during a trend and causes the trend to turn on its head in the opposite direction, it’s called a reversal pattern.
Reversal patterns are popular among traders because they help catch new trends early. If you miss those trades, though, you can use continuation patterns to get in.
Continuation patterns, when they appear, suggest that a current trend is likely to continue. Usually, these patterns are interpreted as temporary pauses in price action before the continuation of the current trend.
The Most Important Price Action Patterns
These are some of the most commonly relied upon price action patterns:
1. Pin Bar (Hammer and Shooting Star) Chart Pattern
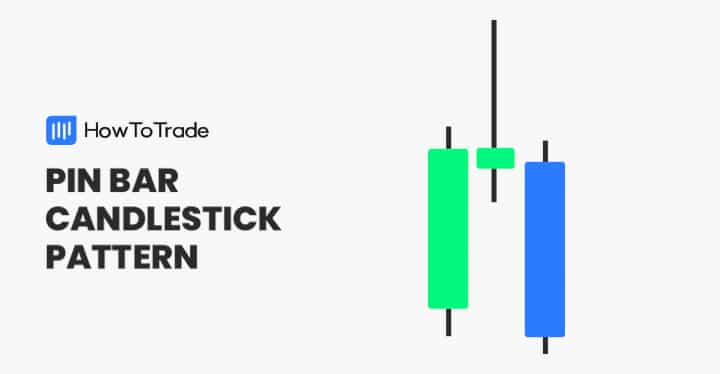
The Pin Bar is one of the most recognizable and reliable price action patterns. It is a single-candlestick pattern that signals a reversal in price direction. Depending on where it appears, it can have different names:
- The Hammer (bullish pin bar): It appears at the bottom of a downtrend and signals that the sellers have lost control and buyers are stepping in. It has a long lower wick, a small body, and a short or non-existent upper wick.
- A Shooting Star (bearish pin bar): It forms at the top of an uptrend and indicates the market may soon reverse downwards. It has a long upper wick, a small body, and little to no lower wick.
2. Inside Bar and Harami
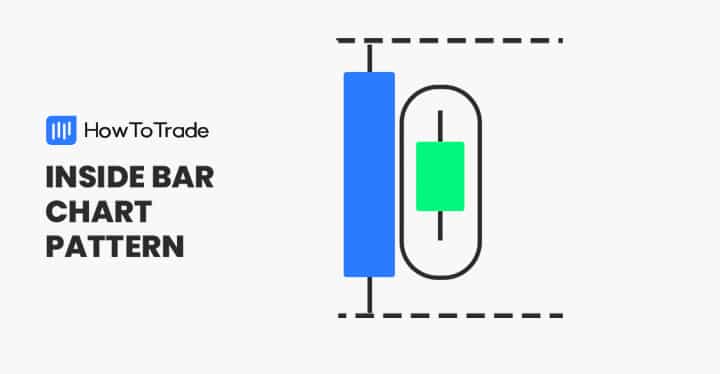
The Inside Bar pattern is a two-candle formation where the second candle’s high and low are entirely within the previous candle’s range. It typically signals consolidation and indecision in the market, often forming before a breakout.
The Harami is another price action pattern that is exactly the same as the Inside Bar in looks but is a reversal pattern. These two are quite tricky to trade because you’re not sure if what you’re seeing is an Inside Bar or a Harami. However, the trick to being able to differentiate between them is in the larger market context.
If the pattern appears close to a supply or resistance, for instance, it’s likely a Harami, and a reversal may be expected. However, if there’s no obvious reason for the price to reverse after the formation of this pattern, it may be an inside bar.
The opposite of the Inside Bar is the Outside Bar.
3. Double Top and Double Bottom
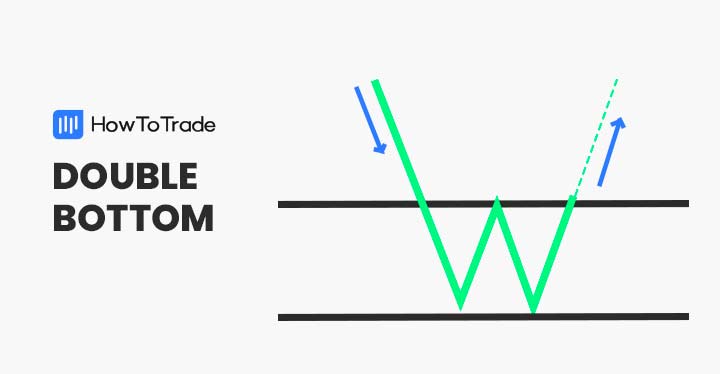
The Double Top and Double Bottom patterns are also reversal patterns. A double top occurs when a price reaches a high level twice, while a double bottom occurs when a price reaches a low level twice. A breakdown below the neckline in a double top or a breakout above the neckline in a Double Bottom signals a potential reversal.
To trade this price action pattern, look for the two peaks or troughs that form the double top or double bottom. Then, monitor the price action and wait for price breaks from the neckline. Enter a long position for a double bottom breakout or a short position for a double top breakout.
4. Head and Shoulders
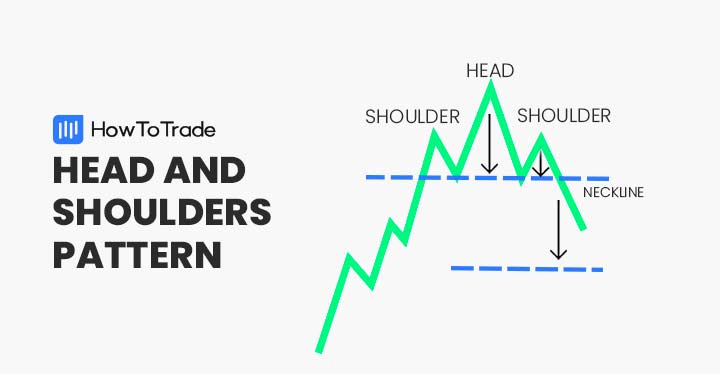
The head and shoulders pattern is a bearish reversal pattern that consists of three peaks: a higher middle peak (the head) and two lower peaks on either side (the shoulders). A neckline connects the lows of the shoulders. A breakdown below the neckline signals a potential downtrend.
This price action pattern is regarded as one of the most reliable, and a lot of traders trade it. Another reason for its popularity is that it has simple entry and exit rules. As soon as the pattern shows up, you wait for the price to break out of the neckline to the downside. That breakout is your entry. Place a stop-loss order above the right shoulder and set your profit target based on the same height as the peak from the neckline.
5. Bullish and Bearish Engulfing Patterns
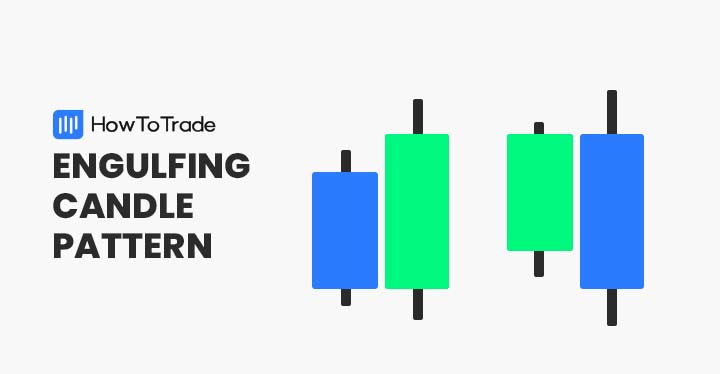
The Engulfing Pattern is a two-candle formation where the second candle completely engulfs the first candle’s body, signaling a reversal.
A Bullish Engulfing occurs after a downtrend, where the second candle (bullish) fully covers the body of the previous bearish candle, indicating a shift in control from sellers to buyers. A Bearish Engulfing happens after an uptrend, where the second bearish candle engulfs the body of the previous bullish candle, signaling that sellers have taken over.
The engulfing pattern appears a lot on the chart. As a result, there are a lot of opportunities for false signals. So, when trading the pattern, it is important to consider the larger market context to avoid unnecessary losses.
6. Triangles and Pennants
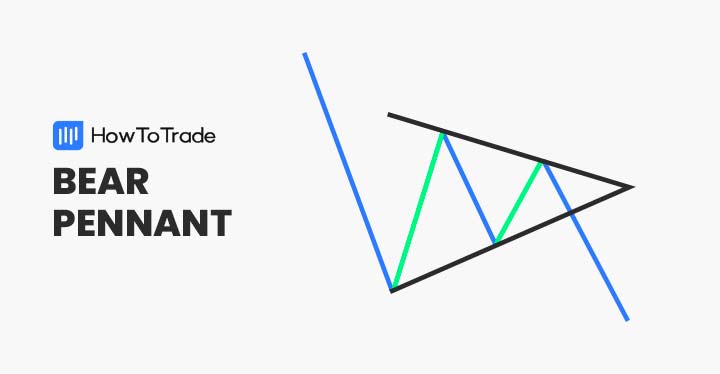
The formation of triangles is very common on the price chart, and they mostly always suggest trend continuations. There are various names given to triangles, depending on how they form and the bias before their formation. There are ascending/descending triangles and symmetrical triangles. Pennants are also types of triangle patterns.
The ascending triangle pattern appears during a bullish trend, with the price being constrained between a horizontal upper trendline and an upward-slanting trendline. The descending triangle pattern appears during a downtrend. But this time, the price is constrained between a horizontal lower trendline and a downward-sloping trendline. The symmetrical triangle, wherever it appears, constrains the price within two trendlines that are sloping towards each other. The pennant can easily be any of these triangles.
Regardless of what the triangle is, you expect a breakout in the direction of the previous trend.
7. Flag Pattern
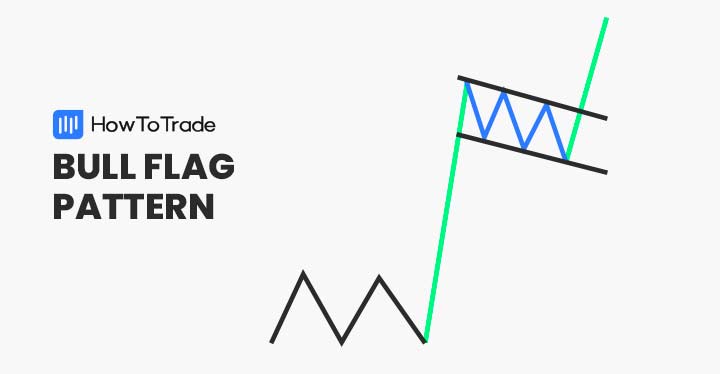
A flag pattern is another continuation pattern that resembles a rectangle. It typically appears after a sharp move and suggests a brief pause before the trend resumes. It’s easy to trade once it appears. You simply wait for the breakout in the direction of the trend and ride it to the next support or resistance zone.
The flag pattern comes in various types, including the bull flag, bear flag, and high-tight flag pattern.
8. Wedges
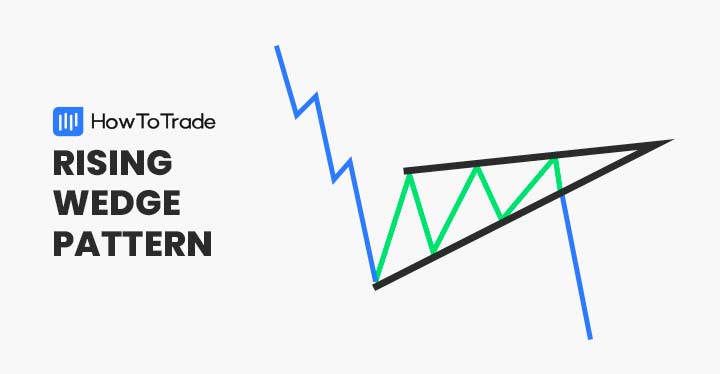
Wedges can be reversal or continuation patterns, depending on whether they’re rising or falling and where they appear.
A falling wedge coming after a downtrend suggests that the price is likely to serve as a bullish reversal pattern. A falling wedge that appears after an uptrend suggests a continuation of the existing trend to the upside. Similarly, a rising wedge after a bullish trend suggests that the trend will likely reverse. And a rising wedge in a downtrend suggests that we may get a continuation of the bearish trend.
The Price Action Patterns Free PDF Download
You’re learning about so many price action patterns, but you don’t have to memorize them all. Here’s a free Price Action Patterns PDF you can always refer to whenever you need it:
How to Confirm Price Action Patterns
While price action patterns are highly reliable, confirming them with other tools is important to increase the probability of success.
1. Locate the Volume
A spike in volume during a breakout or reversal pattern can confirm the move’s strength. If you don’t see a significant increase in volume, however, this may be a sign that the move is a false breakout. Volume and price analysis give you a complete picture of the market sentiment.
2. Indicators aren’t the enemy
Some traders prefer to stick to price action patterns alone and swear never to touch indicators. However, this is not the best way to go about trading chart patterns. While price action patterns may be your primary trading tool, you can always use indicators to confirm the trend. The Moving Averages, for instance, are good indicators to rely on for this purpose.
3. Consider the larger market context
Any price action pattern can appear anywhere on the chart. But it makes no sense in and of itself unless it matches a higher timeframe narrative. Otherwise, you’ll be trading bullish patterns when the trend is bearish on a higher timeframe, and vice versa.
Risk Disclosure: The information provided in this article is not intended to give financial advice, recommend investments, guarantee profits, or shield you from losses. Our content is only for informational purposes and to help you understand the risks and complexity of these markets by providing objective analysis. Before trading, carefully consider your experience, financial goals, and risk tolerance. Trading involves significant potential for financial loss and isn't suitable for everyone.