The inside bar candle pattern is one of the most frequently occurring chart patterns in financial markets. It is called an inside bar because the first candle completely covers the second candle, which is a chart formation that helps traders predict the next price movement.
- The inside bar candlestick is a prevalent chart pattern signaling potential market shifts.
- Always weigh the tangible benefits against challenges when diving into inside bar trading.
- Before engaging in inside bar trading, be aware of both its promising rewards and potential pitfalls.
In this guide, we’ll talk about an inside bar candlestick chart pattern and how you can trade with it.
- What is the inside bar candlestick pattern?
- What’s the Difference Between the Inside Bar and Inside Day Candlestick Patterns?
- How to identify and use the inside bar candle pattern in forex trading?
- Inside bar pattern trading strategies and examples
- The inside bar pattern – Pros and cons
- Is the Inside Bar a Good Trading Strategy?)
- What is the Best Time Frame for Trading the Inside Bar Candle Pattern?
- Is the Inside Bar Candle Pattern Bullish or Bearish?
- The Free Inside Bar Trading PDF
- More Trading Tips on the Inside Bar Pattern
- Key takeaways
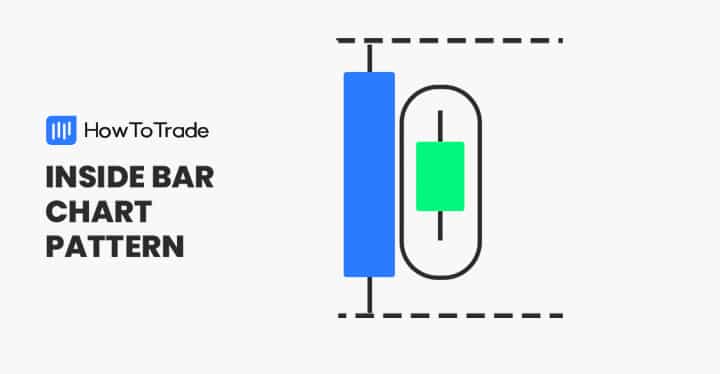
What is the Inside Bar Pattern?
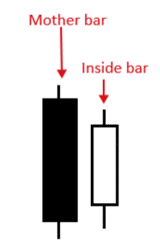
The inside bar is a two-candlestick pattern that signals trend continuation or reversal. The first candle of the pattern is usually large, while the next candle is a small candle with its high and low range contained within the high and low range of the previous bar. The first candle is called the mother bar, while the second candle is also called the baby candle. In another case, when the mother bar does not appear, it’s also called the abandoned baby candle pattern.
The concept behind the inside bar pattern is that there is a temporary consolidation when the inside bars are formed or a decline in buying or selling pressure in the market following a large and significant price movement. Now, the inside bar setup may appear on both sides – meaning, when the pattern appears in an uptrend, it’s called a bullish inside bar pattern, while when it appears in a downtrend, it is called a bearish inside bar pattern.
Moreover, the pattern could be either a trend reversal or continuation chart pattern, depending on the context of the markets. It is also one of the most frequently seen patterns that appear regularly in any market condition. So, as you can assume, there’s no one version of the inside bar pattern.
Even though the pattern is known as having a structure with one large bullish or bearish first candle and a second smaller candle, it could have many other chart formations. For example, the inside bar pattern could also be formed with a large first candle and a second tiny Doji candle. Technically, as long as the first candle covers the second candle, then it’s an inside bar pattern.
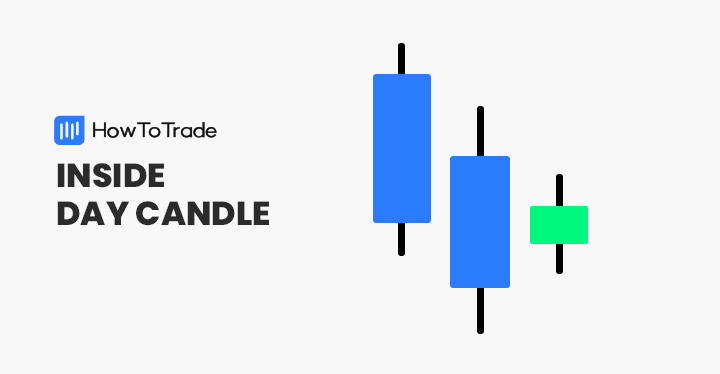
What’s the Difference Between the Inside Bar and Inside Day Candlestick Patterns?
In structure, the inside bar is similar to the inside day candle pattern with the only difference that inside day is used on a daily chart time frame while the inside bar candle pattern is used for intraday trading. Furthermore, the inside bar may appear inside another chart pattern formation, such as the three inside-up pattern, where the first two candles are, in fact, inside bars.
How to Identify the Inside Bar Candlestick Chart Pattern in Trading?
As mentioned above, the inside bar is a two-candlestick pattern that may appear in any market scenario. Identifying the inside bar is not rocket science, and once you have a basic understanding of what it looks like, you will be able to locate it instantly on price charts. You just need to remember a few rules to identify the pattern correctly.
- The first candle has a tall body, sometimes very large wicks, and is called the mother bar.
- The second candle has a small body, sometimes having low wicks, and is called the baby candle.
- It is a confirmed inside bar formation when the high and low of the baby candle are within the range of the high and low of the mother candle.
Here’s an example of what it looks like:
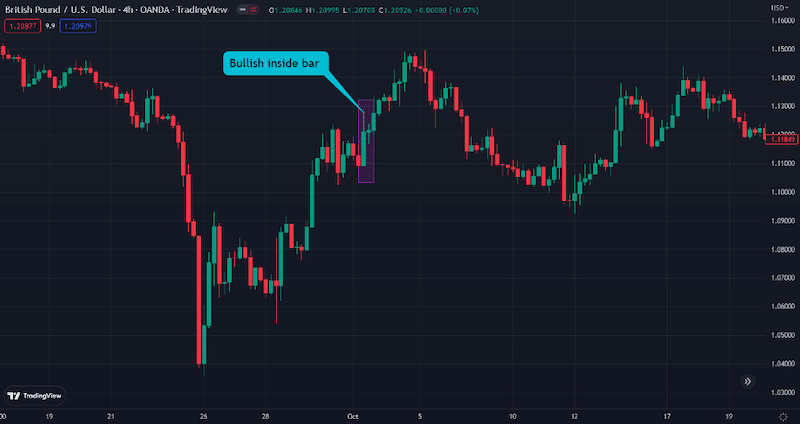
On the GBP/USD chart above, you can see a bullish inside bar.
Inside Bar Chart Pattern Trading Strategy
You can apply plenty of trading strategies when trading inside bars. As mentioned, the inside bar candle pattern can appear in a downtrend or an uptrend and indicate a reversal or trend continuation.
So, you cannot trade every single inside bar in the same way, as you may not know if the trend will reverse or continue. Instead, it would be best to interpret the pattern differently on the market scenario and decide the next price direction. Still, the inside bar allows you to identify a pause in price action and a good market entry level before the next price movement. That’s what this pattern is all about.
Below, we will show you a market example of trading the inside bar pattern as a breakout strategy.:
Inside Bar Trading Example: Breakout Trading
The inside bar pattern also gives great breakout trading opportunities, and it’s very simple to trade.
1. Trade Entry
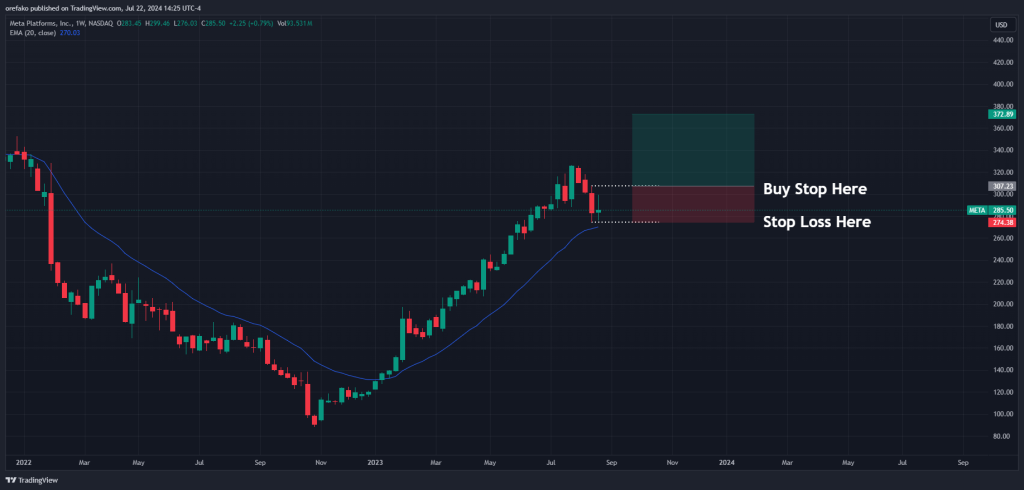
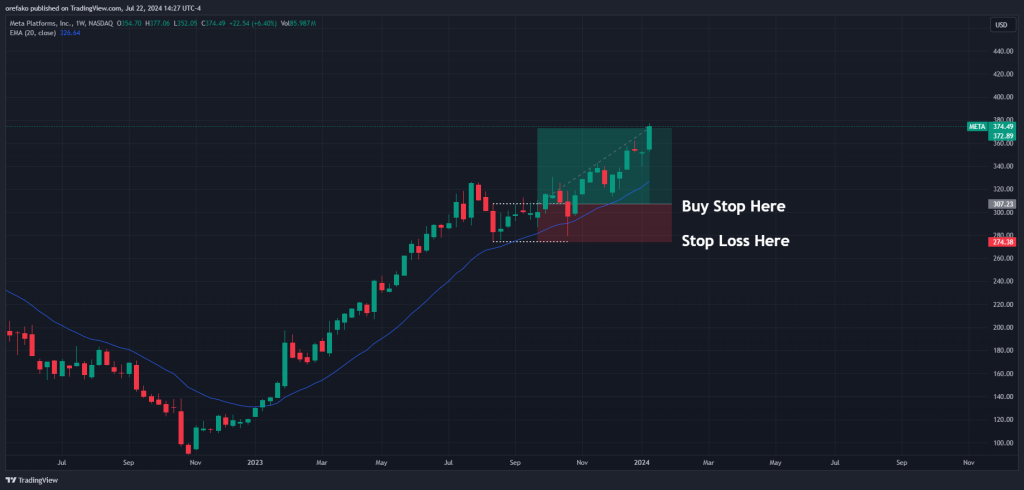
The first thing you want to do is to identify your pattern and the current market trend. The reason for this is that you want to trade your breakout in the direction of the current trend. Once you identify the current trend, set your stop order at the top or bottom of the mother candle, depending on the trend.
For instance, you place a buy stop at the high of the mother candle in a bullish trend. And in a bearish trend, you put your sell-stop order at the low of the mother candle. This way, you can take advantage of the breakout as it happens.
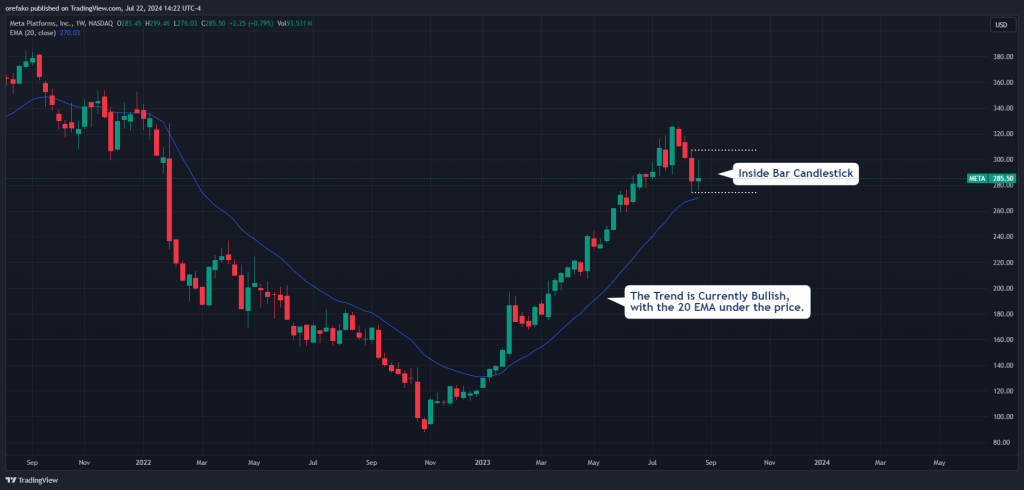
If you need more clarity on the market trend, you can place the 20 EMA indicator as a trend guide just as we did on the Meta chart up there.
2. Stop Loss Placement
Ideally, your stop loss should be at the other end of the mother candle. So, in a bullish trade, your stop loss will be at the low of the mother candle. And in bearish trade, your stop loss will be at the high of your mother candle. If the mother candle is unusually big, however, you may place your stop loss at the 50% level of the complete candle range.
3. Take Profit Target
Your profit target will often depend on the market volatility and behavior of the instrument you’re trading. Stocks, for instance, have a habit of going in one direction for longer than forex pairs. As a result, you may often get away with placing your take-profit target a little farther away from your entry in the stock market than in the forex market.
But for the sake of generality, place your profit target at a minimum 1:1 risk-to-reward ratio. Also, watch out for potential supply and demand zones in the opposite direction of your trade, as they may impact the fulfillment of your take profit target.
What are the Benefits and Limitations of the Inside Bar Candlestick Pattern?
No pattern is the holy grail of trading, and the inside bar pattern, like many other classical chart patterns, has strengths and weaknesses. So, let’s see what these are.
Pros
- Inside bar patterns frequently appear in the markets
- You can identify the pattern easily
- The inside bar can be used as a trend reversal and continuation signal
- The profitable inside bar setup pattern enables you to find many trading opportunities, especially for intraday trading techniques
Cons
- Signals from the inside bar pattern can be pretty confusing as it is unclear where the market is heading
- The pattern must be combined with other tools
- Traders that trade the inside bar pattern must interpret and analyze the market’s sentiment
Is the Inside Bar a Good Trading Strategy?
Yes, it is. When combined with other tools or indicators, trading with the inside bar provides an excellent and straightforward smart trade management strategy. Although it is not a decisive chart pattern like many other chart patterns, it certainly enables traders to find many trading opportunities.
What is the Best Time Frame for Trading the Inside Bar Candle Pattern?
Generally, the longer the time frame, the better the signals the inside bar pattern provides. However, the pattern is certainly more suitable for short-term trading techniques. If you are a scalper, you can use the inside bar in a 15-minute timeframe or lower.
Using this forex trading strategy, you look for the inside bar in an uptrend or downtrend, wait for the pattern to fully appear, and double-check the price action through an indicator or support/resistance levels. After that pause in price action, you can find an inside bar trade.
Is the Inside Bar Candle Pattern Bullish or Bearish?
The inside bar pattern can be bullish, bearish, or neutral. It is one of the few chart patterns that does not necessarily signal a directional change. Instead, it provides a price pause before the next price movement.
The Free Inside Bar Trading PDF
Here’s a free PDF that contains the Inside Bar trading strategy if you need it for easy access or for whatever reasons:
The Inside Bar Trading Strategy PDF
More Trading Tips on the Inside Bar Pattern
When trading the inside bar setup, here are some tips to keep in mind:
- We have found that the high probability inside bar setups form soon after breakouts. However, that isn’t the only place where high-probability setups can be found.
- We recommend that you scout for favorable inside bar setup in a trending market and in the direction of the trend. The inside bar on its own does not predict price reversals well enough, so it may not be worth much as a reversal pattern, especially if used in isolation.
- Whatever you do, try not to use the pattern in isolation. Treat inside bars as only a part of a system that contains other technical analysis tools.
Key Takeaways
In a nutshell, here are the main takeaways from identifying and trading the inside bar chart pattern.
- The inside bar is a multiple inside bars chart pattern, providing a short pause in price action
- Depending on market conditions, the inside bar pattern can be a trend reversal or continuation pattern
- The pattern consists of a mother candle and a baby candle. Though it is a two-candle pattern, the third candle indicates the market’s direction
- To use the pattern correctly, it is best to add indicators or tools like support, resistance, moving averages, RSI, and Fibonacci
- Inside bar patterns on higher timeframes and on trading instruments that tend to remain in trend for long have higher potentials. Those on the smaller timeframes, however, tend to have more false signals.
Risk Disclosure: The information provided in this article is not intended to give financial advice, recommend investments, guarantee profits, or shield you from losses. Our content is only for informational purposes and to help you understand the risks and complexity of these markets by providing objective analysis. Before trading, carefully consider your experience, financial goals, and risk tolerance. Trading involves significant potential for financial loss and isn't suitable for everyone.