Single Candlestick Patterns in Forex
A typical Japanese candlestick depicts the price activity of a currency pair within a unit period in a specific time frame. But that’s not all it does. A candlestick tells the story of the battle between buyers and sellers. And what’s more? Some traders have identified candlestick patterns they use to predict where the price is going next on the forex chart.
In this lesson, we’ll discuss single candlestick patterns in forex and what they mean. And right off the bat, the patterns we’ll be talking about are:
- Hammer (bullish reversal pattern) and Hanging Man (bearish reversal pattern)
- Inverted Hammer (bullish reversal pattern) and Shooting Star (bearish reversal pattern)
These two sets of candlestick patterns are some of the most popular among the single candlestick patterns in forex.
1. The Hammer and Hanging Man Candlestick Patterns
Hammer and Hanging Man are popular candlestick patterns many traders use to form the basis of their technical analysis. Both candlestick formations appear as a candle with a small body at the top and a wick at the bottom two or three times longer than the previous candle’s body. There is no wick above the body, and the color of the body is not essential. What matters is the nature of the trend in which the candlesticks appear.
The Hammer and the Hanging Man candlestick patterns look identical but occur in opposite conditions and give opposite trade signals.
The Hammer candlestick pattern appears during a bearish trend. And when it appears, the market will likely reverse and start rising. Hence, it is a bullish candlestick pattern. Conversely, the Hanging Man appears during rising markets. And when it does, the market is likely about reverse to the downtrend. That’s why it is a bearish candlestick pattern.
The Hanging Man Pattern
In the image below, the hanging man forms at the end of an uptrend, signifying a weakened buyer’s pressure and a potential price reversal.

The hanging man depicts a scenario where sellers gather much momentum to push prices down, giving rise to a long wick beneath. However, the residual effect of the buyers pushes the closing price back up close to the opening price level. This informs us of a weakening buyer pressure and an increased seller pressure.
The Hammer Candlestick Pattern
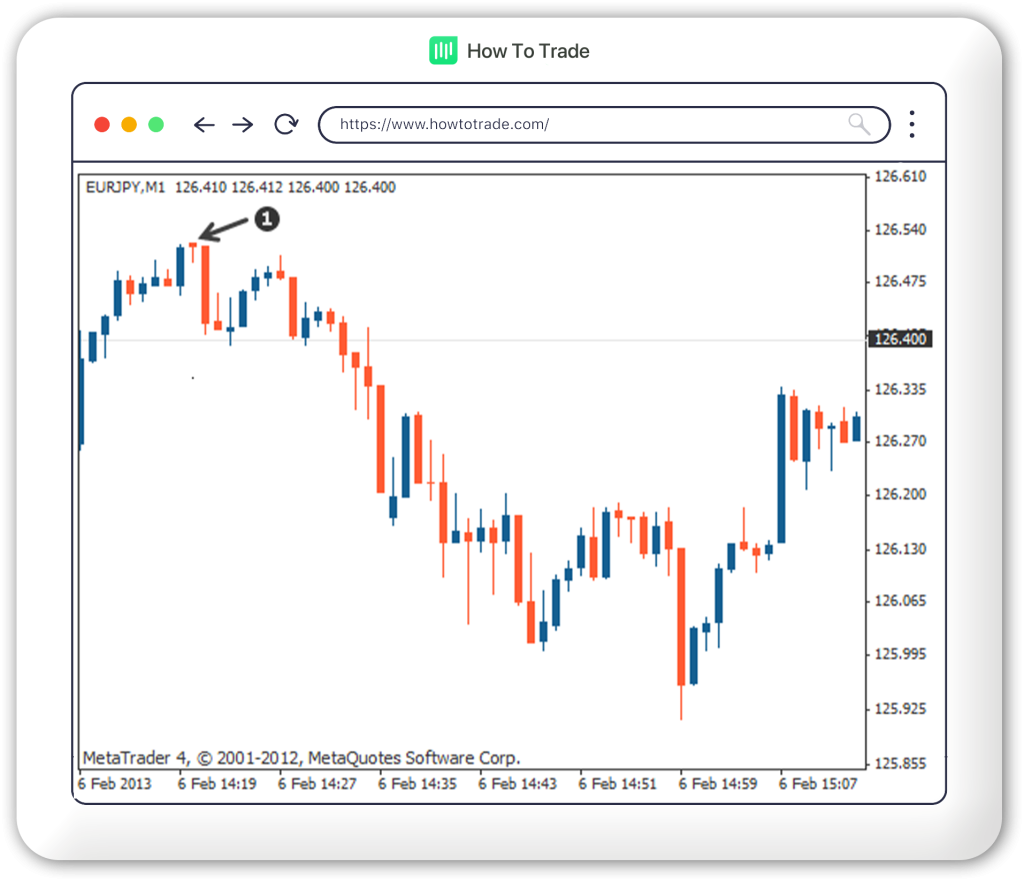
On the other hand, when the same candlestick pattern appears at the end of a downward trend, it is called a bullish hammer pattern, and it indicates a weakening seller’s pressure. The name “hammer” derives from the notion that the market is hammering out a bottom, and a bullish trend could potentially set in. The image below depicts a hammer candlestick pattern.
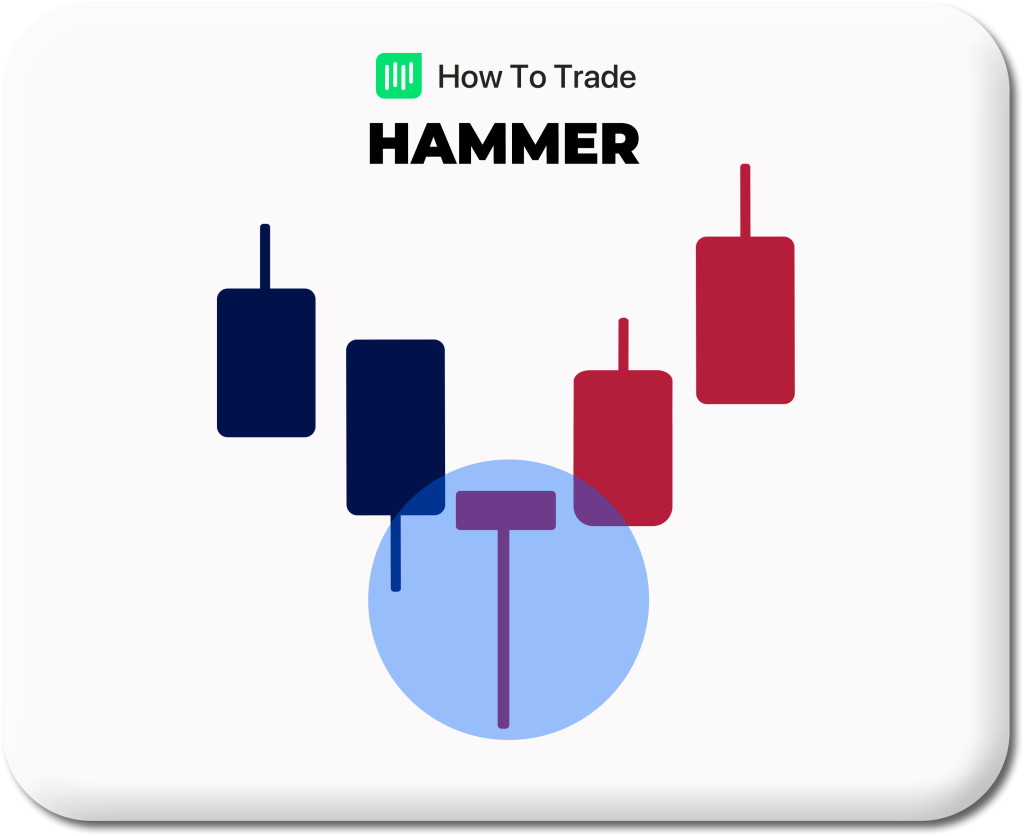
The hammer candlestick pattern shows strengthening buyers’ pressure, which was able to close the price above the open level after the sellers drove the price down, resulting in the long wick beneath the body.

IMPORTANT: Remember, just because you see just a hammer form in a downtrend doesn’t mean you automatically place a buy order! More bullish confirmation in the first and second candle after the hammer is needed before it’s safe to pull the trigger.
How to Identify a Hanging Man or a Hammer on Candlestick Charts
With our knowledge so far, there are some rules you need to take into account to quickly spot a hanging man or a hammer candlestick pattern on candlestick charts:
- The long lower shadows are about two or three times the size of the real body.
- There is a small or no upper shadow in the candle’s body.
- It is likely to appear within an uptrend or downtrend.
- It should break a recent high/low or be near a recent high/low.
- Before confirming, one or two bearish or bullish candlesticks must form after the hanging man or hammer patterns.
2. What is an Inverted Hammer and Shooting Star Candlestick Patterns?
Similar to the candlestick patterns we already discussed, the Inverted Hammer and Shooting Star patterns are important single candlestick patterns commonly used by traders in their technical analysis. Again, the Inverted Hammer and Shooting Star also look identical. The difference lies in the trend in which the candlesticks form.
Both candlestick patterns appear as a candle with a small body at the bottom and a long upper shadow at the top (two or three times longer than the body). There is no lower shadow below the body, and the color of the body is not essential. The only difference between the two candlestick patterns is whether they are in a downtrend or uptrend.
The Inverted Hammer Pattern
An Inverted Hammer is a bullish reversal candlestick pattern that appears when prices fall and indicates that the downtrend selling pressure may have reached a trough and that prices could reverse upwards. An Inverted Hammer signals a buying opportunity.
The image below depicts the Inverted Hammer candlestick pattern. Observe how it forms after a downtrend.

The pattern suggests that while sellers still managed to push down the price, forming the long wick, buyers’ pressure started to gain traction, causing the candle to close higher than it opened. This scenario suggests that the sellers’ momentum is weakening, and buyers may soon begin to have their way.

The Shooting Star Pattern
A Shooting Star is a bearish reversal candlestick that appears when prices rise, indicating that the uptrend may have peaked and that prices could reverse downwards. A Shooting Star signals a selling opportunity and is very similar to a Doji candlestick pattern.
Consider a Shooting Star bearish candle pattern in the image below.

Observe that the shooting star forms after an uptrend, leading to a potential downtrend. This shows that buyers tried to push the price high up, signified by the long wick, but sellers won the shift by pushing the close lower than it opened.

Key Takeaways
- The basic single candlestick chart patterns are the hammer, hanging man, inverted hammer, and shooting star candle patterns. They all are trend reversal patterns.
- The difference between the hammer and the hanging man lies in the trend in which they occur.
- The hammer pattern forms after a downtrend, while the hanging man forms after an uptrend.
- The inverted hammer and the shooting star patterns are the upside-down shapes of the hammer and hanging man, respectively. They have long upper shadows.
- The inverted hammer forms after a downtrend, while the shooting star forms after an uptrend.
- These patterns depict current market dynamics and help to predict future price movements.
Conclusion
While the single candlestick patterns portray the pattern of price movement within a specific time frame and could help predict future market sentiment, you must confirm your bias with other helpful technical analysis and tools before trading. In addition, always wait for two candlesticks to form after your single candlestick pattern before deciding what next step to take.
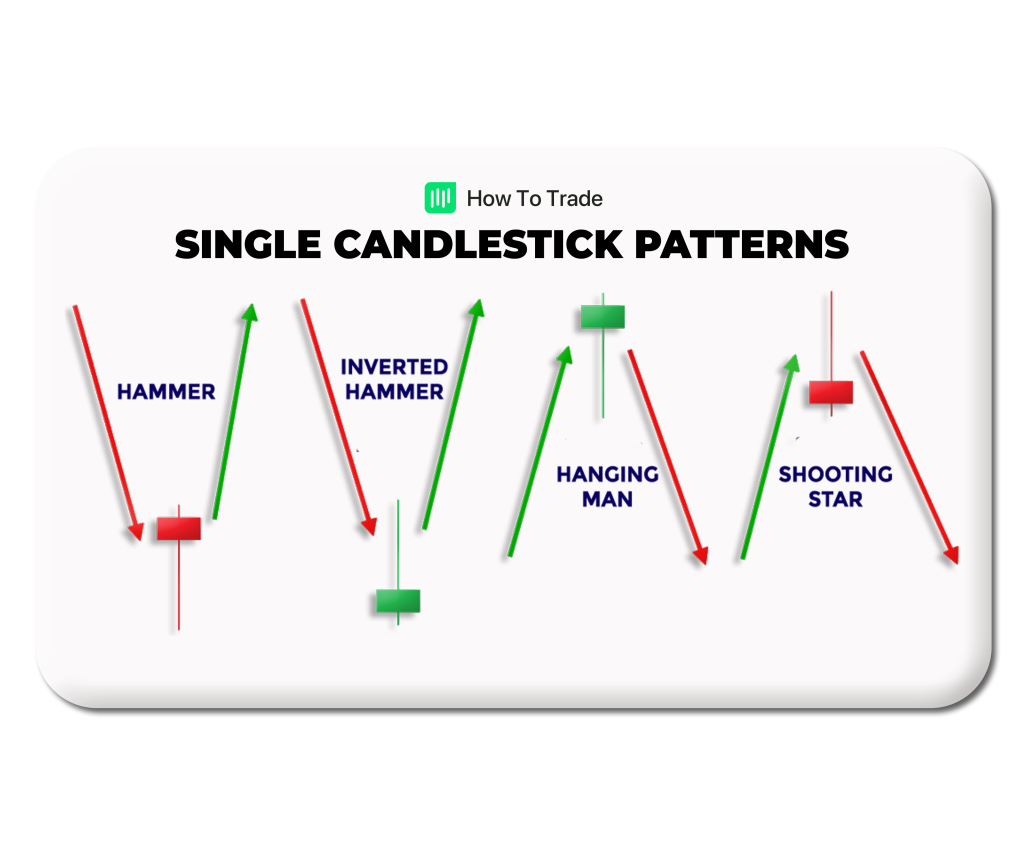
Can you spot the Hammer, Hanging Man, Inverted Hammer, and Shooting Star candlestick patterns on your own now? The image below summarizes the four single candlestick patterns we discussed in this lesson and the context of their occurrences.


Up To $5,000 Credit!
- Trade 1,000’s of global markets.
- 0% deposit and withdrawal fees.
- Rapid funding turn-around times.
- Trade on MetaTrader 4 and 5.