Japanese candlestick charts? Bear pennants? Do you want to learn more about these technical analysis tools? Then read on and take a closer look at a powerful chart indicator — the bear pennant pattern.
This article will teach you to recognize and trade currency pairs using the bear pennant chart pattern.
 Table of Contents
What is the Bear Pennant Pattern?
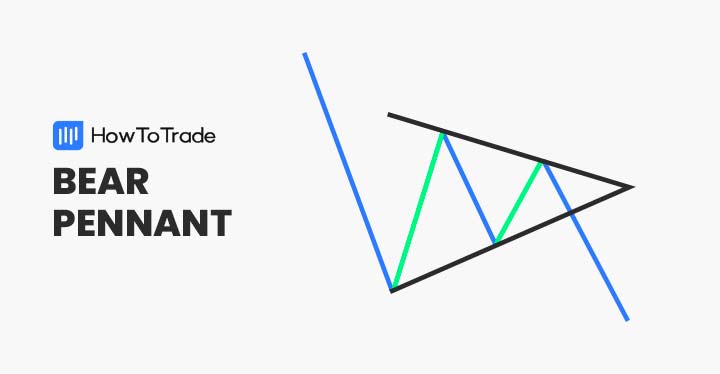
The bear pennant is a continuation pattern that signals that the ongoing trend is likely to continue. It occurs during a bearish trend and indicates a possible extension of a downtrend. Traders use this classical chart pattern to join the existing trend and short sell an asset.
How to Identify and Use the Bear Pennant?
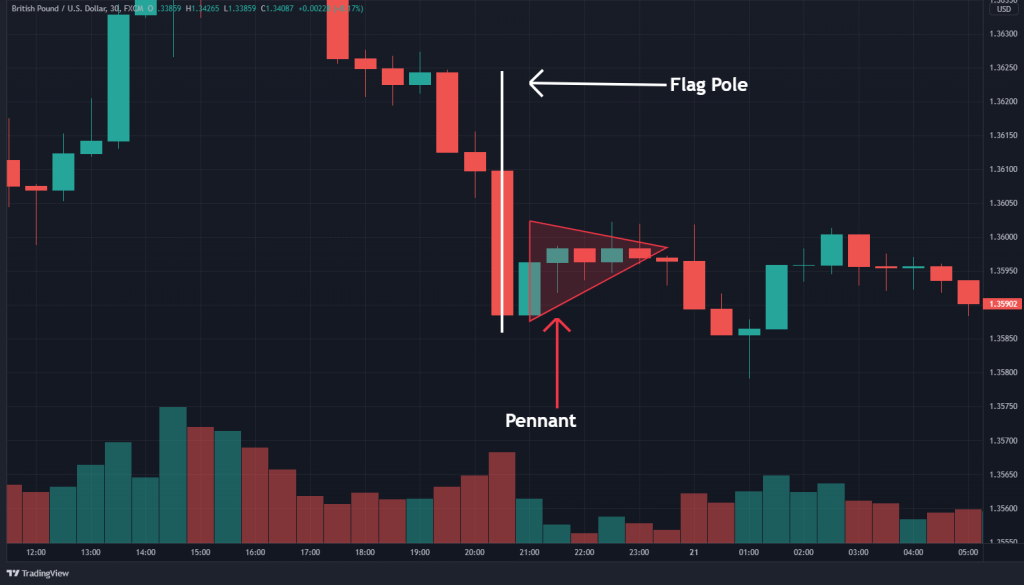
The bear pennant occurs during a pronounced downtrend in price. It consists of two parts: the flagpole and the pennant. The GBP/USD chart below gives us a great illustration of the formation.

Follow the progression below to identify the bear pennant:
- Spot a downtrend in price
- Draw the flag pole
- Recognize a period of subsequent market consolidation
- Draw trend lines on the upper and lower bounds
Draw the Flag Pole
A downtrend in price is a series of lower periodic highs and lows. For the bearish pennant, the downtrend is the flag pole. Once identified, a trendline may be drawn to help contextualize price action.
Draw the Pennant
The pennant is a period of consolidating price action. It signifies a tightening of the market over time. To define pennant, draw a line that connects the upper bounds of price action and a line to connect the lower bounds.
Bear Pennant Pattern vs. Bullish Pennant Pattern
Bullish and bearish pennants are both continuation technical analysis indicators. However, they differ in several ways:
- The bullish pennant suggests an extension of an uptrend.
- The bearish pennant signals the extension of a downtrend.
- The bullish pennant is a buy signal.
- The bearish pennant is a sell signal.
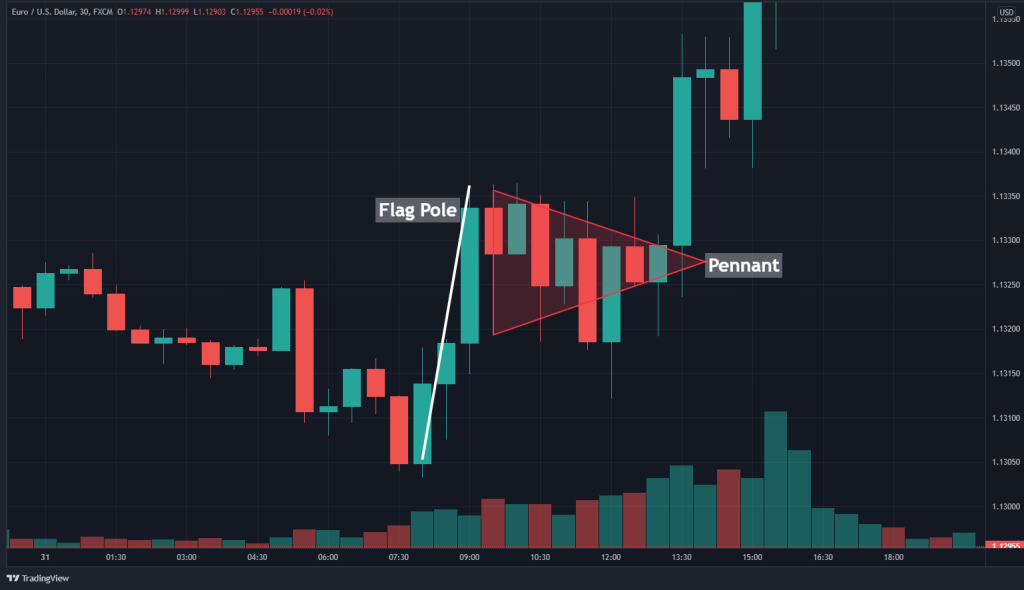
Below is a picture of a bull pennant. Note that the bull pennant pattern forms during an uptrend, not a downtrend. Bearish pennants form in downtrends.

How to Trade the Bear Pennant Chart Patterns?
Like many other chart patterns, there’s a process to trading bear pennant patterns. The process is simple and includes three steps: determine market entry, set the stop-loss, and assign a profit target.
1. Market Entry
The bearish pennant pattern suggests that downward pressure is on the market. Thus, a short-side market entry is appropriate. To enter the market, place a sell market or sell stop-limit/market order beneath the pennant’s lower trend line.
A new short position is opened upon the sell being executed.
2. Stop Loss
When trading the bear pennant pattern, stop losses are easy to locate. Place the stop loss above the upper trend line of the pennant.
Remember, buying and selling currency pairs is done on margin. And margin carries significant risk. That’s why using stop losses in your trading strategies is highly recommended.
3. Profit Target
The bear pennant pattern is a signal to short the market. So, profit targets will be located beneath the pennant’s lower trend line.
Profit targets are typically aligned according to risk/reward ratios. However, no matter how you place a profit target, it will be below the bear pennant pattern on your price chart.
Trading Example
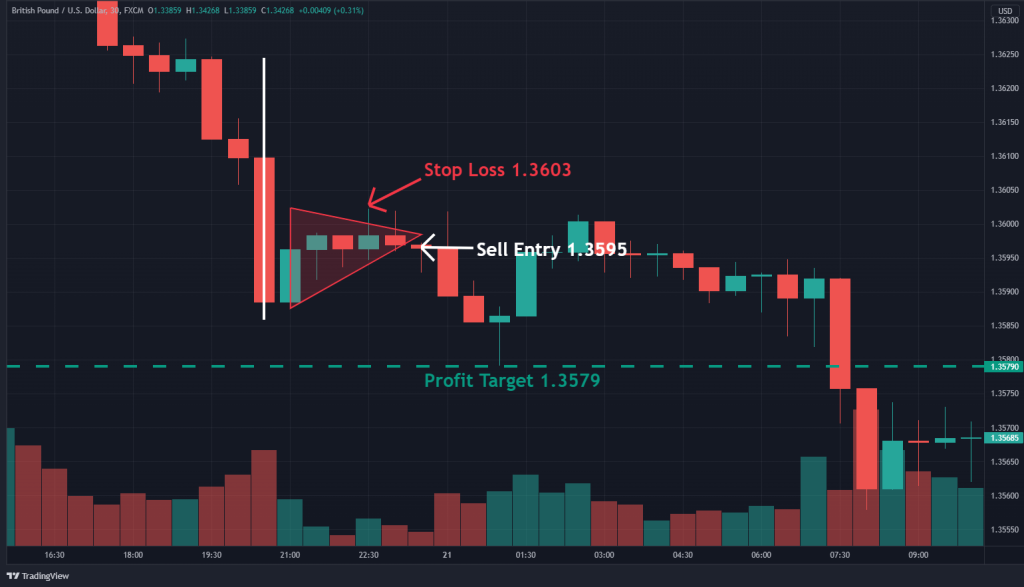
One of the best things about bearish pennant patterns is that they are simple to trade. The GBP/USD chart below illustrates the concepts of market entry, stop loss, and profit target location.

The GBP/USD trade above was executed as follows:
- The flag pole and pennant were constructed
- A sell order was placed at 1.3595.
- Stop-loss was placed at 1.3603.
- A profit target was placed at 1.3579 in adherence to a 1:1 risk vs. reward ratio.
- Once the price fell beneath 1.3595, a new short position was opened.
The Bearish Pennant— Pros and Cons
Although bear pennant patterns are reliable, they do have a few drawbacks. Below is a list of the essential pros and cons.
Pros
- Simple to identify, visually apparent
- Occur frequently on all financial market charts on all timeframes
- Ideal for use as a trend following strategy
Cons
- Can produce false signals
- Pennant ranges are often large
- Extensive stop losses are often required, enhancing risk
Everything About the Bear Pennant Pattern in One Video
Watch this video to learn how to identify and trade the bear pennant pattern with a real-time example.
Key Takeaways
Here are the key takeaways you need to consider when trading the bear pennant pattern.
 Key TakeAways
- Bear pennant patterns are continuation patterns. They signal the extension of a prevailing downtrend.
- Bear pennants are commonly found on all financial market charts on all time frames.
- To trade the pattern, the market is sold beneath the pennant’s lower trend line. Stop losses are located above the pennant’s upper bounds, and profit targets are placed below the pennant.
- The bear pennant is not 100% accurate. It’s essential to use the pattern with proper risk management in mind.
Related Chart Patterns to the Bear Pennant Pattern
As we already mentioned the bear flag pattern, here are the additional most related chart patterns to the bear pennant pattern:
- Descending Triangle chart pattern
- Falling Wedge chart pattern
- Head and Shoulders chart pattern
- Double Top chart pattern
- Bearish Flag pattern
Risk Disclosure: The information provided in this article is not intended to give financial advice, recommend investments, guarantee profits, or shield you from losses. Our content is only for informational purposes and to help you understand the risks and complexity of these markets by providing objective analysis. Before trading, carefully consider your experience, financial goals, and risk tolerance. Trading involves significant potential for financial loss and isn't suitable for everyone.


