- The Dow Theory is based on the idea that markets move in three types of trends: primary, secondary, and minor trends. This helps traders better understand market behavior.
- It emphasizes the concept that markets reflect all available information, making price movements a real-time indicator of collective sentiment.
- Dow Theory’s principles remain relevant, though modern applications adapt to today’s diversified, technology-driven markets.
- Traders can use Dow Theory, along with tools like moving averages and line charts, to refine strategies for different timeframes, including intraday and long-term trades.
The Dow Theory is one of the bedrock principles of technical analysis. Developed over a century ago by Charles Dow, it remains a valuable tool for traders and investors who aim to profit more consistently from following market trends. This guide explores the Dow Theory, how it works, and its relevance in today’s markets.
 Table of Contents
- What is the Dow Theory in Technical Analysis?
- Dow Theory in Technical Analysis – How Does It Work?
- Why is the Dow Theory Important?
- How to Trade Using the Dow Theory – Trade Example
- The Dow Theory Trading Strategy PDF
- The Benefits and Limitations of the Dow Theory
- Does the Dow Theory Still Work?
- FAQs
What is the Dow Theory in Technical Analysis?
If you’ve been trading or even thinking about trading for a while, you’ve probably heard of the Dow Theory. It’s one of those foundational concepts in technical analysis that keeps popping up. But what exactly is it, and why does it matter?
The Dow Theory all started with Charles H. Dow, one of the brilliant minds behind The Wall Street Journal and the Dow Jones Industrial Average (DJIA). Dow didn’t sit down one day and write out “The Dow Theory.” Instead, it came from a series of articles he published, where he casually dropped pure gold about how the stock market works.
Dow’s work was so insightful that after his death, others, such as William Peter Hamilton, S.A. Nelson, and Robert Rhea, took his scattered ideas and compiled them into what we now call the Dow Theory.
What makes this theory stand out is how it lays the groundwork for understanding market trends. Dow believed that markets follow trends—primary, secondary, and minor ones. He also pointed out that these trends reflect everything happening in the world: politics, economic changes, and even public sentiment. Essentially, if it’s affecting the market, it’s already baked into the price.
Here’s something interesting about the Dow Theory: it introduced the idea of market confirmation. This means that if one market index, like the DJIA, is trending upward, another related index, like the Dow Jones Transportation Average, should confirm the movement. If not, something’s fishy. And this concept of confirmation? This is the foundation to the asset correlation trading strategy. It’s still super relevant to how traders analyze markets today.
Another gem is the emphasis on volume. According to the Dow Theory, volume should increase in the direction of the trend. It’s a simple idea, but it’s a game-changer when you’re trying to figure out if a trend is valid or is just part of market noise.
In sum, even though the Dow Theory has been around for more than a century, it’s still incredibly useful. After all, when it comes to spotting trends and timing your trades, why not learn from the guy who started it all?
Dow believed that markets follow trends—primary, secondary, and minor ones. He also pointed out that these trends reflect everything happening in the world: politics, economic changes, and even public sentiment. Essentially, if it’s affecting the market, it’s already baked into the price.
Dow Theory in Technical Analysis – How Does It Work?
The Dow Theory is built on six essential principles that form a comprehensive framework for understanding market trends and making better trading decisions. Here’s a straightforward rundown:
1. The Market Discounts Everything
Dow believed that all available information—economic data, political events, and even unexpected occurrences—shows up in market prices. This means that prices reflect the collective knowledge and sentiment of all participants, giving you a real-time view of market conditions.
2. The Market Has Three Movements
Markets don’t move randomly. Dow identified three distinct types of movements:
- Primary Trends: These are the long-term trends lasting months or even years, defining whether the market is in a bull market or a bear market.
- Secondary Trends: These are shorter trends that last weeks to months, often acting as corrections to the primary trend. They typically retrace 33% to 66% of the primary move.
- Minor Trends: These are short-term fluctuations lasting a few days to weeks. They are less significant and don’t hold much weight in long-term analysis.
3. Primary Trends Have Three Phases
Every major trend develops in three stages:
- Accumulation Phase: Experienced investors start buying or selling assets before the broader market notices a shift.
- Public Participation Phase: This is when the trend becomes apparent, and more participants begin trading in the same direction, accelerating price changes.
- Excess Phase: This phase, which is also called the distribution phase, is when speculation increases and stock prices reach extreme levels, often signaling that the trend is nearing its end.
4. Averages Must Confirm Each Other
Dow emphasized the importance of confirmation between market averages. For instance, for a trend to be valid, both the industrial average and the transportation average should move in the same direction. If one moves up while the other doesn’t, it raises questions about the trend’s strength.
This correlation trading approach adds an extra layer of reliability to trend analysis. However, with how much of the use cases of the strategy have evolved into different market and asset classes, you don’t have to confirm the trend using the Industrial Average and Transportation Average while trading with the Dow Theory again. We’ll cover this more later in the article.
5. Volume Confirms the Trend
In a healthy trend, volume should increase in the direction of the movement. Rising prices with higher trading volume point to a strong uptrend, while declining prices with high volume confirm a strong downtrend.
6. A Trend Continues Until a Clear Reversal Occurs
Trends persist until there’s definitive evidence of a reversal. This principle warns against making premature assumptions about a trend ending without clear signs, encouraging traders to rely on confirmed signals.
Why is the Dow Theory Important?
If you’re exploring technical analysis, understanding Dow Theory is a must. So, what makes it such a powerful concept to master?
The Foundation of Technical Analysis
You might have heard something like this before: “The trend is your friend.” Indeed, the truth is the Dow Theory introduces the idea that markets follow identifiable trends.
This concept of “following the trend” has formed the basis of technical analysis, giving traders a structured way to understand how market prices reflect all available information.
Identifying Market Trends
One of Dow Theory’s strengths is its classification of market movements into three types: primary, secondary, and minor trends. This categorization helps traders pinpoint the market’s overall direction and make up their minds about when to enter or exit trades with respect to what the market is currently doing.
Volume as a Key Indicator
The Dow Theory emphasizes trading volume as a way to confirm the strength of a trend. Higher volume in the direction of the primary trend signals its validity, helping traders distinguish between genuine moves and temporary ones.
Timeless Relevance
Even after over a century, Dow Theory remains a cornerstone of market analysis. Its principles continue to shape modern technical analysis tools and trading strategies, proving that solid ideas can stand the test of time.
How to Trade Using the Dow Theory – Trade Example
As we’ve mentioned earlier in the article, the way you should trade the Dow Theory today is a lot more different from how it was used over a hundred years ago, and it’s a lot simpler, too. The reason for such change is not far-fetched: we’re simply reacting to how the market evolves over time.
So, before we go straight into using a real-time example, here are some things to note:
- For intraday trading, don’t go lower than a 15-minute timeframe, especially if you’re just starting out. You can use 1-hour, 4-hour, daily, weekly, or even monthly and yearly timeframe for your analysis.
- We make use of a line chart rather than a candlestick chart while analyzing the chart.
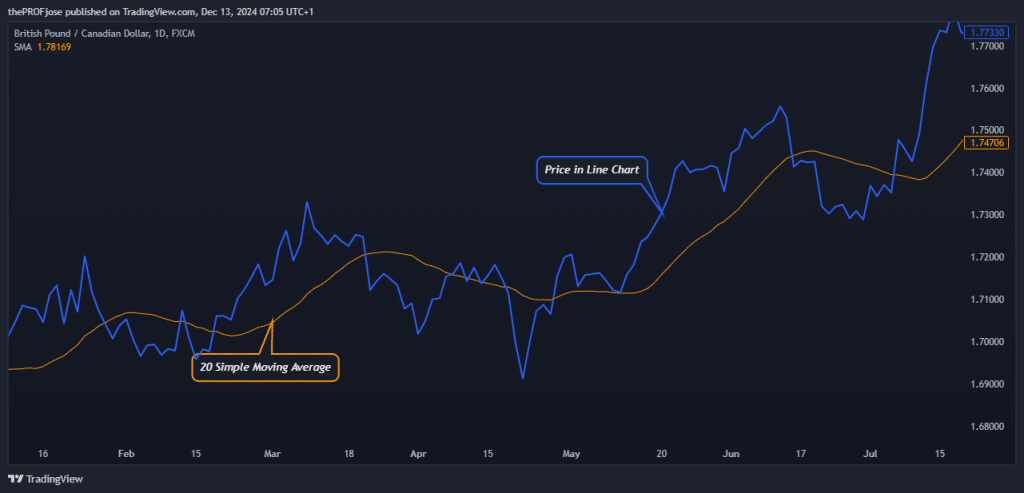
- We add the 20 Simple Moving Average to give us a directional bias while also helping us filter out counter-trend trades.
Now that we’ve covered the basics, let’s examine how to trade using the Dow Theory, using the GBP/CAD pair as our case study.
The first thing you want to do is to set the chart to a line chart and add a 20 SMA to the chart, as shown below:

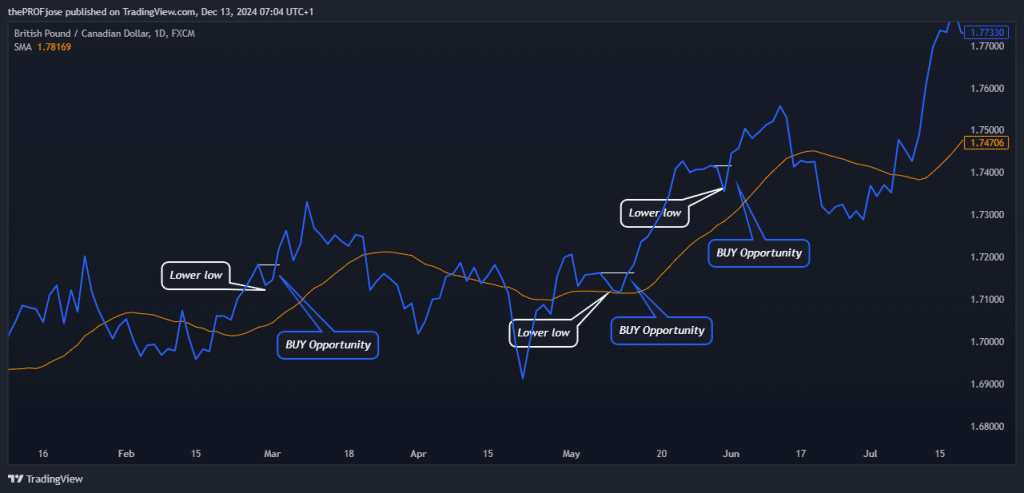
After that, we can discuss how to enter the trades using some chart patterns suggested by Dow Theory. If the price is trading above the 20 SMA, we wait for it to form a higher low, and then we take our BUY trade immediately after it breaks the high, as seen in the charts below.

On the other hand, if the price is trending below the 20 SMA, we must wait for it to form a lower high and then break the low created by the downside before we open a SELL trade.
To manage your risk, you can simply set the stop-loss below a swing low if you are in an uptrend or place the stop-loss above a swing high if you are selling. Knowing where to take profit requires some skill. Some traders take profit at a 1-2 risk-reward ratio, while others close their trades after an opposing pattern is forming.
The key ideas of Dow Theory, such as identifying market trends and the notion that markets reflect all available information, remain central to technical analysis today. These concepts provide traders with a structured framework for understanding market behavior and making informed decisions.
The Dow Theory Trading Strategy PDF
If you need something to read on the fly about the Dow Theory, here’s something for you:
The Benefits and Limitations of the Dow Theory
Dow Theory, like any framework, offers both strengths and limitations that traders and investors should keep in mind. Let’s check out some of its pros and cons.
Benefits of Dow Theory
Dow Theory has several strengths that have kept it relevant for over a century. These advantages make it an essential framework for traders and investors who want to understand market trends and make more informed decisions. Let’s explore its key benefits.
Simplicity and Clarity
One of Dow Theory’s biggest advantages is its straightforward approach. Its principles are easy to understand, making it accessible to traders at all experience levels. The clear guidelines help identify market trends without requiring complex calculations or trading tools.
Long-Term Perspective
Dow Theory encourages a focus on primary trends, which can last several months or years. This long-term outlook helps investors avoid being swayed by short-term market fluctuations, promoting more disciplined decision-making. With that in mind, the Dow Theory is typically more suited for swing trading and the position trading strategy.
Trend Identification
The emphasis on identifying and following trends aligns perfectly with the old market saying, “The trend is your friend.” By sticking to the prevailing market direction, investors can make more informed decisions and potentially improve their outcomes.
Limitations of Dow Theory
Despite its strengths, Dow Theory is not without its challenges. Here are some of the main drawbacks to consider.
Lagging Indicators
One of the biggest drawbacks of Dow Theory is that it often confirms trends only after significant price movements have already occurred. This delay can lead to missed opportunities for traders seeking to optimize their entry and exit points.
Subjectivity in Interpretation
The theory relies on interpreting price movements and chart patterns, which can be subjective. Different analysts might draw different conclusions from the same data, leading to inconsistencies in application.
Overemphasis on Averages
The theory emphasizes the movements of specific market averages, such as the Dow Jones Industrial Average and the Dow Jones Transportation Average. However, this focus may not always provide a complete picture of the broader market or other sectors, increasing the risk of misinterpretation.
Does the Dow Theory Still Work?
When it comes to trading philosophies and strategies, there are more inconsistent systems than consistent ones. This leaves us with the question: “If the Dow Theory was used over 100 years ago with many positive results, does it still work today?”
Well, while its foundational principles have shaped the way we analyze markets, their effectiveness in modern conditions requires a closer look.
The key ideas of Dow Theory, such as identifying market trends and the notion that markets reflect all available information, remain central to technical analysis today. These concepts provide traders with a structured framework for understanding market behavior and making informed decisions.
Despite its enduring relevance, the complexities of today’s financial markets present challenges to the traditional applications of Dow Theory:
- Dow Theory emphasizes confirmation between industrial and transportation averages. However, in an economy dominated by technology and service sectors, this approach may not fully capture market trends.
- The rapid flow of information and the rise of high-frequency trading can create behaviors that deviate from the historical patterns observed during Dow’s time.
While the Dow Theory’s foundational ideas still offer valuable insights into market trends, applying them in today’s dynamic environment requires a modern perspective. Therefore, to achieve the best results, you must balance timeless concepts with current realities to enhance decision-making and improve outcomes.
Frequently Asked Questions About Dow Theory in Technical Analysis
To deepen your understanding of Dow Theory, here are some frequently asked questions that address its key concepts and applications.
What is the main point of the Dow Theory in technical analysis?
The main purpose of the Dow Theory is to identify and analyze market trends. It categorizes market movements into three types: Primary trends, secondary trends, and minor trends.
The theory posits that understanding these trends helps traders and investors make informed decisions about entering or exiting positions. It also emphasizes that markets reflect all available information and that trends persist until there’s clear evidence of a reversal.
What is the best timeframe for using the Dow Theory?
Dow Theory is traditionally favored by long-term investors, as it focuses on identifying primary trends that span months or years. However, its principles are versatile and can also be applied to shorter timeframes.
For instance, secondary trends lasting weeks to months can guide swing traders, while minor trends lasting days may offer insights for short-term traders. The choice of timeframe depends on the trader’s goals and risk tolerance.
What are the best tools to add for the Dow Theory strategy?
Since the Dow Theory is a broad concept of trading, then there are plenty of tools, chart patterns and indicators to add for best results. For instance, the order flow in trading is a great tool that can be incorporated with the Dow Theory. The Wyckoff chart pattern/theory is another excellent technique since it helps traders identify the market cycle. Additionally, tools such as the level 2 market data, and volume indicators like the Volume Profile indicator, and the On-Balance Volume indicator can be highly effective when utilizing the Dow Theory strategy.
Risk Disclosure: The information provided in this article is not intended to give financial advice, recommend investments, guarantee profits, or shield you from losses. Our content is only for informational purposes and to help you understand the risks and complexity of these markets by providing objective analysis. Before trading, carefully consider your experience, financial goals, and risk tolerance. Trading involves significant potential for financial loss and isn't suitable for everyone.


