As fantastic as the idea of trading the trend sounds, there’s one fundamental truth: trends don’t last forever. So, how do you anticipate reversals or price corrections? Even better, how do you trade them? That’s where the counter-trend strategy comes in.
This style of trading is often the riskiest of all. However, if done properly, it can lead to significant profit, and this makes the topic worth exploring.
- Counter trend trading involves taking positions against the prevailing market trend with the aim of identifying market reversals and entering new trends.
- To trade against the trend effectively, traders use indicators like RSI, Stochastic RSI, Bollinger Bands, Fibonacci retracement levels, moving averages, MACD, and volume analysis.
- Most traders who venture into counter trend trading encounter frequent losses, with only a small number managing to attain profitability.
So, if you’ve always wanted to learn about counter-trend trading strategy, this article is your ultimate guide. Let’s get started.
- What is Counter Trend Trading?
- How Does the Counter Trend Trading Strategy Work?
- Best Counter Trend Indicators
- Counter Trend Trading – Trade Examples
- The Free Counter Trend Trading Strategy PDF
- Final Word – The Risks and Benefits of the Counter Trend Trading Strategy
- Frequently Asked Questions (FAQs)
What is Counter Trend Trading?
Counter-trend trading involves taking positions against the prevailing market trend. The objective is usually to identify market reversals and take positions at the beginning of a new trend or to trade price corrections. The latest refers to a pause in a market trend before the price continues to trend in a specific direction.
Generally, counter-trend trading can be profitable, but it is also risky. This style of trading embodies a contrarian mindset. It involves going against the crowd and stepping into the market when most others are riding the trend.
This approach demands a profound understanding of market dynamics, technical analysis, and precise identification of potential reversal points. In many cases, counter-trend traders use repetitive chart patterns and technical indicators that may provide concrete trading signals for a price correction or market trend reversal.
At basic, counter trading is the opposite of the trend trading strategy in which traders try to capture profits by raising the momentum of market trends. Typically, the trend trading strategy is considered the safest and easiest trading method of all. However, many traders lack the skill to identify a prevailing trend. Those traders are always looking for a price correction or a trend reversal. They are counter-trend traders.
How Does the Counter Trend Trading Strategy Work?
The general idea of countertrend strategy is the belief that markets, regardless of their long-term direction, experience fluctuations and corrections, and counter-trend traders see this as their opportunity to enter the market.
Imagine a scenario where a stock has been on a bullish run. Trend followers ride the wave, while counter-trend traders always look for signs that the momentum is waning, seeking entry points during corrections or reversals.
This strategy spans various timeframes, from intermediate-term to short-term. In fact, some hold positions for weeks, while others, like day traders, enter and exit within hours.
There’s no better way to explain how a counter-trend works without referring to how trend following works. After all, counter-trend traders take the opposite direction of the trend. So, while trend followers focus on impulsive price moves, aligning with the larger trend, counter-trend traders thrive on corrective moves, profiting from temporary shifts.
Best Counter Trend Indicators
Trading against the trend requires a lot of confluence to make it work, some of which include the use of indicators. Here are some of the best indicators to use while using the counter-trend trading strategy:
1. Relative Strength Index (RSI)
You must have heard about the Relative Strength Index (RSI) indicator. In counter-trend trading, we focus on using the indicator to spot RSI divergence. The overbought and oversold signal also comes in handy.
2. Stochastic RSI
Similar to the traditional RSI, the Stochastic RSI is also good for identifying overbought and oversold conditions to recognize price correction. Additionally, since the Stochastic RSI is among the best momentum indicators, it can be used to identify the strengths and weaknesses of a trend.
3. Bollinger Bands
The bands of this indicator serve as dynamic support and resistance levels. So, irrespective of the trend, when the price touches or crosses one of the outer bands, it can signal potential reversals.
4. Fibonacci Retracement Levels
We only focus on key Fibonacci levels, such as 50% and 61.8%, to identify potential turning points in the market. These retracement levels can be powerful indicators for counter-trend trading.
5. Moving Averages
In counter-trend trading, moving averages can be used to identify when a trend may be losing momentum or reversing.
6. MACD
The Moving Average Convergence Divergence (MACD) is a trend-following and momentum indicator, but it can also be useful for counter-trend traders. When the MACD histogram starts to converge or diverge from the signal line, it can signal potential reversals in the price direction.
7. Volume Analysis
While not a traditional indicator, analyzing trading volume can provide valuable insights for counter-trend traders. An increase in trading volume during a price correction or reversal can indicate strong market sentiment and potential turning points.
Counter trend trading can be profitable, but it is also risky. This style of trading embodies a contrarian mindset. It involves going against the crowd and stepping into the market when most others are riding the trend.
Top Counter Trend Trading Strategies
So far, we’ve presented some facts about the counter-trend trading strategy. Now, let’s bring everything together to show you how trading a counter-trend looks on the trading chart.
1. Trading Price Corrections with Bollinger Bands
As mentioned, Bollinger bands have been an essential part of many profitable trader’s trading arsenal. While they are excellent trend-following indicators, they can also be effective for trading price corrections as countertrend trading strategies.
As you can see in the image below, Bollinger Bands are mostly used by counter-trend traders to identify price corrections. When the price gets out of the upper and lower bands, traders interpret that as price levels where the price might reverse and correct.
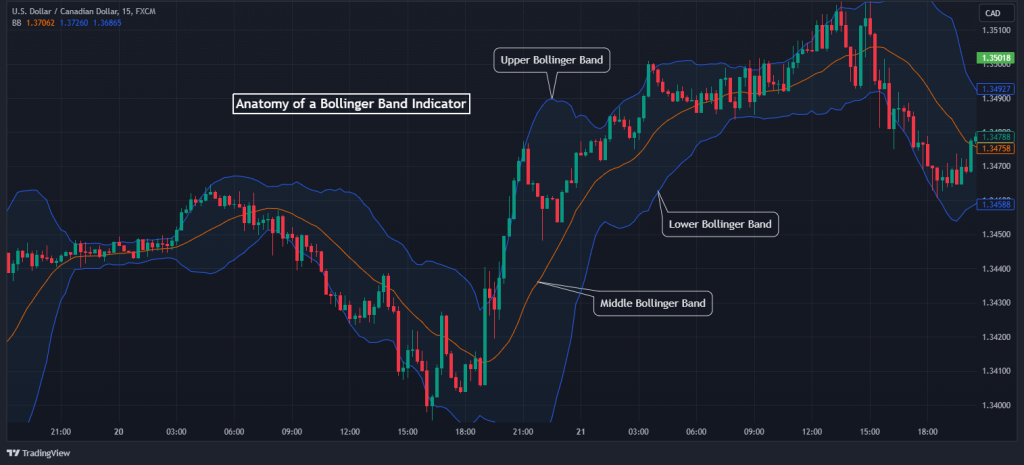
Also, the Bollinger band middle line can be used to determine the trend of the market and the volatility, and its bands can serve as dynamic support and resistance levels.
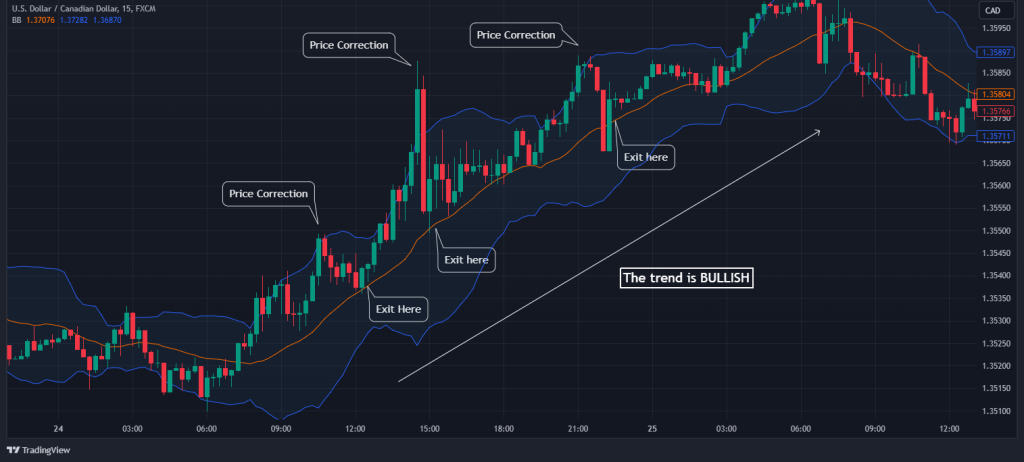
In an uptrend, counter-trend traders often wait for prices to hit the upper Bollinger bands before they enter a short-term or intermediate-term SELL position, as shown in the chart above.
These types of trades are taken cautiously as traders only seek to target the middle Bollinger bands as their take-profit area while trailing their stops.
2. Trading Reversals with Stochastic RSI and MACD
Another way counter-trend traders enter trades is by predicting a market trend reversal using oscillators. Popularly, most traders use more than one oscillator to achieve a more accurate entry.
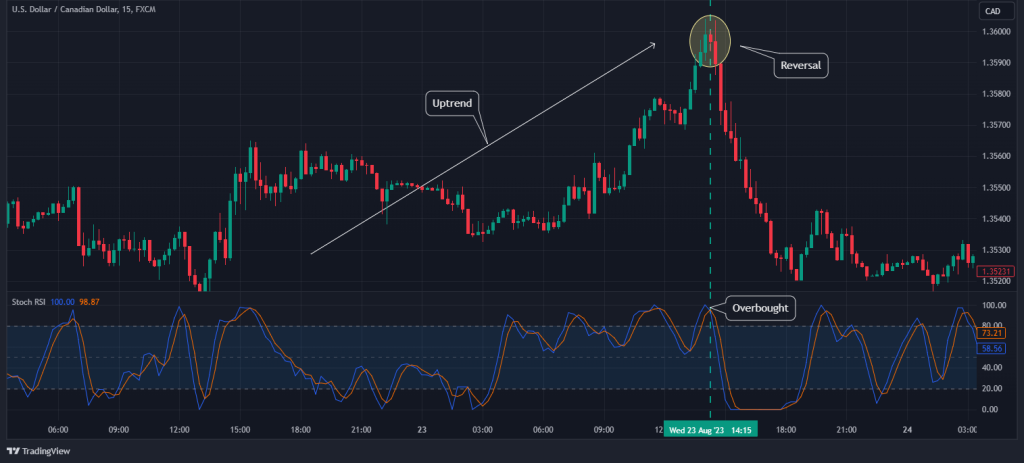
For instance, as seen in the above chart, traders can use Stochastic RSI and MACD to note when a trend is finishing. For example, when the Stochastic indicator is overbought, counter-trend traders can start looking to sell the asset.
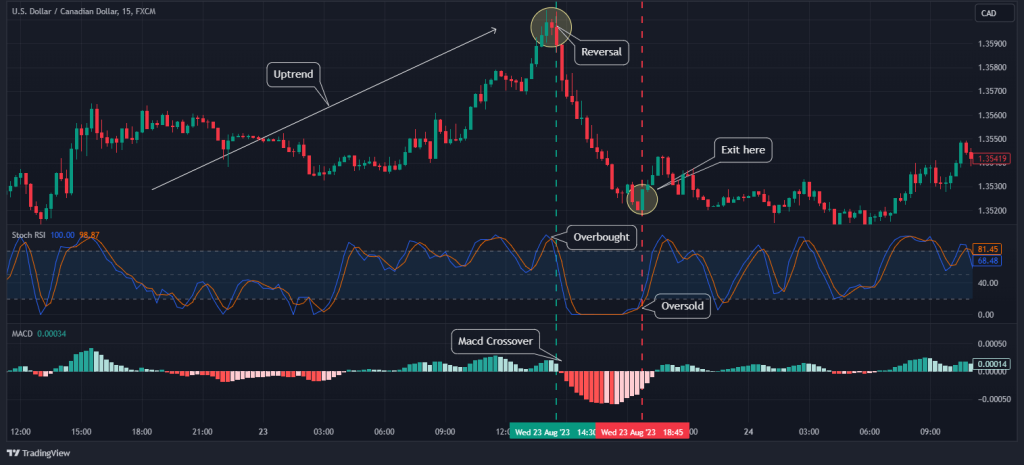
Moreover, to confirm the trade, the MACD crossover at these regions further strengthens these signals. Stop loss is usually placed some pips above the high while they ride the new trend till it’s oversold on the Stochastic RSI. Take profit target can be placed at the starting level of the previous trend prior to the reversal.
The Free Counter Trend Trading Strategy PDF
If you need something to easily carry around and refer to when it comes to counter-trend trading, this PDF is for you:
The Free Counter Trend Trading Strategy PDF
The Risks and Benefits of the Counter Trend Trading Strategy
In trading, the ability to weigh the risk of a strategy to its potential is important for a successful career. As we conclude this guide, the counter-trend trading strategy is not the ideal strategy. Surely, it’s not very likely for someone who starts trading to choose counter trading as the main approach to making profits.
After all, it is among the most riskiest strategies of all. Not only that, you need to have a certain personality to succeed as a counter-trend trader. In short, only some succeed using the counter-trend trading strategy. Usually, those with good trading instincts and the skill of utilizing proper risk management techniques.
But trading is a different animal. You can’t really choose a strategy. The strategy chooses you. You’ll form your own strategy several weeks or months after you start trading. And who knows, maybe you’ll become a counter-trend trader. So, while the counter-trend strategy might be risky, it can also be profitable.
Frequently Asked Questions About the Counter Trend Trading Strategy
Here are some frequently asked questions on counter-trend trading:
Is counter-trading profitable?
Counter-trading is rarely profitable for the majority of traders. It is considered one of the riskiest trading approaches because it involves going against the prevailing market trend.
While it is possible to make profits with counter trading, doing so consistently is challenging and requires a high level of skill, experience, and discipline. Many traders who attempt counter-trend trading face frequent losses, and only a select few become successful counter-traders.
Is it good to trade against the trend?
Trading against the trend or going against the prevailing market trend can be a high-risk strategy. Whether a counter-trend trade is “good” or not depends on various factors, including a trader’s risk tolerance, experience, and trading goals.
Going against the trend, as in counter-trend trading, can offer opportunities for profit during price corrections or reversals. However, it comes with the risk of mistimed entries, substantial losses, and psychological stress. Traders should carefully consider their risk tolerance and trading skills before deciding to rage against the trend.
What Is the best Counter-Trend indicator?
There isn’t a single “best” counter-trend indicator, as the effectiveness of an indicator can vary depending on the market conditions and the trader’s specific trading style. Counter-trend traders often use a combination of technical indicators (most of which we’ve pointed out in the article) to identify potential reversal points accurately.
Some commonly used indicators for counter-trend trading include the Relative Strength Index (RSI), Stochastic, and so on. You need to test and fine-tune your chosen indicator to align with your trading strategy and objectives.
Risk Disclosure: The information provided in this article is not intended to give financial advice, recommend investments, guarantee profits, or shield you from losses. Our content is only for informational purposes and to help you understand the risks and complexity of these markets by providing objective analysis. Before trading, carefully consider your experience, financial goals, and risk tolerance. Trading involves significant potential for financial loss and isn't suitable for everyone.