


If you trade multiple assets, you might have noticed that some assets seem to move in the same (or even opposite) directions most of the time. But have you ever asked why that happens? Or how can you turn this knowledge into profit? This is where the asset correlation trading strategy comes in.
- Asset correlation is a critical concept in trading and investment, indicating the statistical relationship between two or more financial instruments.
- Asset correlation is underscored as a critical risk management tool, aiding in hedging, diversification, and the development of informed trading strategies.
- Traders use several asset correlation techniques, including a strategy in which they look for temporary correlation breakdowns to identify trade opportunities.
In this article, we cut through the noise, delivering a concise exploration of asset correlation types, their impact on your trading, and various examples of how you can start applying them to your trading starting today.
What is Asset Correlation?
Asset correlation is a fundamental concept in the world of trading and investment that refers to the statistical relationship between two or more financial instruments. When assets move in tandem, exhibiting similar price changes over a specific period, they are considered to be positively correlated. Conversely, assets that move in opposite directions have a negative correlation.
Understanding asset correlation is crucial for traders and investors aiming to diversify their portfolios and mitigate risks. Also, identifying the correlation between different assets can help you balance risk and reward and make profitable decisions. Asset correlation analysis is a simple yet powerful trading strategy.
Based on this strategy, traders monitor two correlated assets and look for anomalies when one asset’s price moves in the opposite direction of the other. Then, with the assumption that the correlation would get back to its average values, traders can find trading opportunities.
However, it is crucial to note that the correlation between assets is not static; it can change over time due to various factors such as economic events, market conditions, and changes in supply and demand.
For instance, during economic downturns, certain assets typically have low correlation and might move more correlatedly. Therefore, traders and investors must regularly reassess the correlations of their portfolio assets to ensure that their trading strategies and risk management practices remain effective.
How Correlation is Calculated
The most common method to calculate asset trading correlation is using the Pearson correlation coefficient. This statistical measure ranges from -1 to 1. A coefficient close to 1 implies a strong positive correlation, while a coefficient close to -1 indicates a strong negative correlation. A coefficient around 0 suggests no correlation.
The formula for this coefficient is:
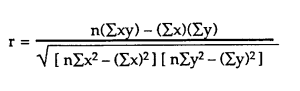
- r represents the correlation coefficient.
- n is the number of pairs of scores.
- Σxy is the sum of the product of paired scores.
- Σx and Σy are the sum of the scores for each variable.
Traders and analysts can derive a quantitative measure of their correlation by inserting the historical price data of the two assets in question into this formula.
Types of Correlation
Here are the three types of correlation that exist in the financial world:
Positive Correlation: When two assets move in the same direction, they share a positive correlation. A classic example can be seen in the relationship between oil prices and the stocks of oil companies. As oil prices rise, the revenue and profits of oil companies generally increase, leading to a rise in their stock prices. This direct relationship highlights a positive correlation. Companies such as Exxon Mobil and Chevron often exhibit this trend.
Negative Correlation: In contrast, negatively correlated assets move in opposite directions. Consider the relationship between gold and the stock market. Investors often flock to gold during market instability, leading to a rise in gold prices as stock asset prices fall. This inverse correlation relationship exemplifies a negative correlation.
No Correlation: Although it’s very rarely in financial markets, some assets have unrelated movements, showcasing no correlation, meaning zero correlation. For instance, the price of wheat and technology stocks generally do not follow a predictable movement pattern with each other.
The Misconceptions and Challenges of Using Asset Correlation
While asset correlation is a powerful tool, it is not without its misconceptions and challenges. Some traders might mistakenly assume that historical correlation will continue, which is not always the case. For example, crude oil and natural gas are highly correlated; however, in some cases, you might see these two assets completely lose correlation for a certain period.
This is because many factors influence the financial markets, and past relationships between assets can change, sometimes abruptly. Thus, relying solely on asset correlation for trading decisions can be risky.
Furthermore, correlation does not imply causation. Just because two assets have moved in tandem in the past does not mean that one is causing the other to move. External factors might similarly influence both assets, or the observed correlation could be coincidental.
Based on the asset correlation strategy, traders follow two highly correlated assets and monitor them closely. Once they notice a movement of one asset before the other, they make a trade, assuming that the statistical correlation is strong enough so the temporary discrepancy is likely to reverse.
Ways to Use Asset Correlation in Trading
Understanding asset class correlation equips traders with the ability to craft robust portfolios. It is not only a critical risk management tool, helping identify assets that can be paired to create a balanced and diversified portfolio, but also an excellent trading method to find plenty of trading opportunities.
Here are the different ways a trader can use asset correlation:
- Strategy Development: Primarily, professional traders leverage correlation in developing trading strategies. Understanding how different assets interact enables them to make informed predictions about future market movements, opening up lucrative trading opportunities. Based on the asset correlation strategy, traders follow two highly correlated assets and monitor them closely. Once they notice a movement of one asset before the other, they make a trade, assuming that the statistical correlation is strong enough so the temporary discrepancy is likely to reverse.
- Hedging: By investing in assets that are negatively correlated to their primary positions, traders can mitigate risk. For instance, a portfolio heavy in technology stocks, susceptible to market volatility, can be balanced by investing in assets like government bonds, which tend to move in the opposite direction.
- Diversification: Asset correlation is instrumental in portfolio diversification. By spreading investments across assets that do not move in tandem, traders can reduce the impact of market fluctuations on their portfolio, enhancing its overall stability.
Setting Multi-Asset Correlation on a Price Chart
When engaging with asset correlation trading strategies, visualizing the relationship between different assets on a price chart becomes crucial. There are several methods to set multi-asset correlation on a price chart, and here are some of them:
1. Overlaying and Side-by-Side Comparison
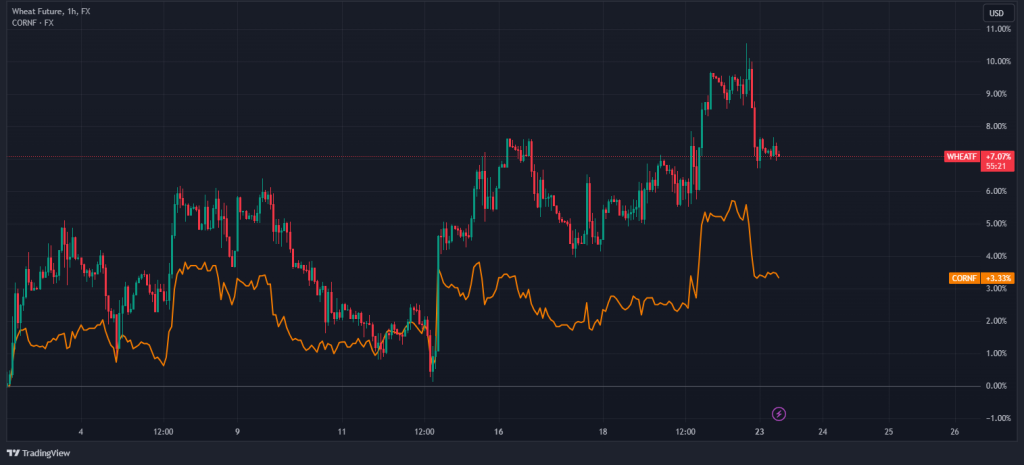
One of the simplest methods to observe asset correlation is to overlay two charts or place them side-by-side. This allows for a manual inspection of how the assets move in relation to each other. In the chart below, we simply overlay Wheat and Corn to compare their movements.
When overlaying charts, ensure that the time frames and scales are identical for an accurate comparison. On the other hand, a side-by-side setup enables you to scrutinize each asset’s behavior while still being able to draw parallels between their movements.
Another option is to set two correlated assets, one next to each other. This is usually easier on most platforms since you can view three or four charts simultaneously.
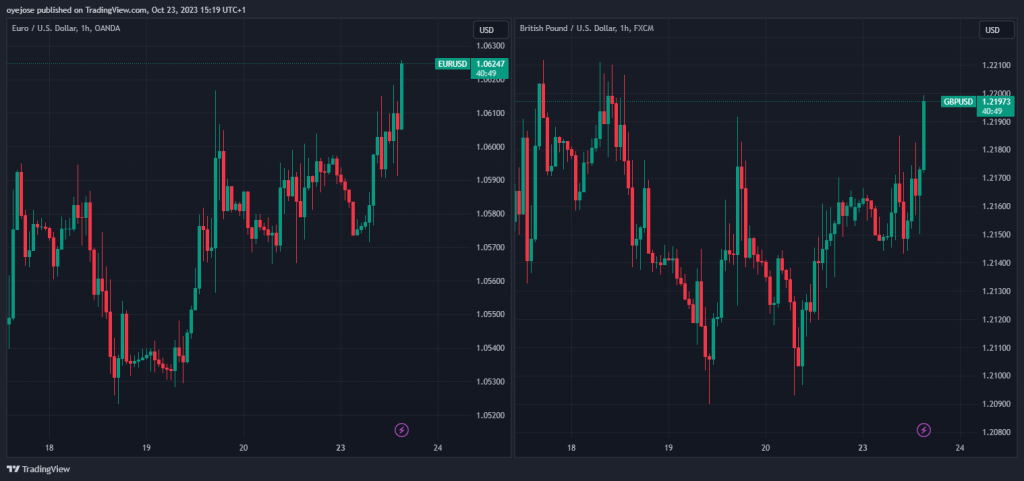
To set two correlated assets side-by-side on TradingView, as shown in the chart above, you only have to click the “select layout” button on the main toolbar at the top of your chart and select how you want these assets to be displayed. On MT4/5, you can easily achieve similar results by opening the two charts separately and minimizing the view.
2. Utilizing the Correlation Coefficient Indicator
For a more quantitative approach, traders can use the correlation coefficient indicator on TradingView. This statistical tool calculates the correlation between two assets, providing a value between -1 and 1. A value close to 1 indicates a strong positive correlation, whereas a value close to -1 denotes a strong negative correlation.
Here’s a simple interpretation of the correlation coefficient:
- 0.90 to 1.00 (-0.90 to -1.00): Very high positive (negative) correlation.
- 0.70 to 0.90 (-0.70 to -0.90): High positive (negative) correlation.
- 0.50 to 0.70 (-0.50 to -0.70): Moderate positive (negative) correlation.
- 0.30 to 0.50 (-0.30 to -0.50): Low positive (negative) correlation.
- 0.00 to 0.30 (0.00 to -0.30): Negligible correlation.
The chart below shows that Wheat and Corn futures have a high positive correlation, with a coefficient of 0.95.
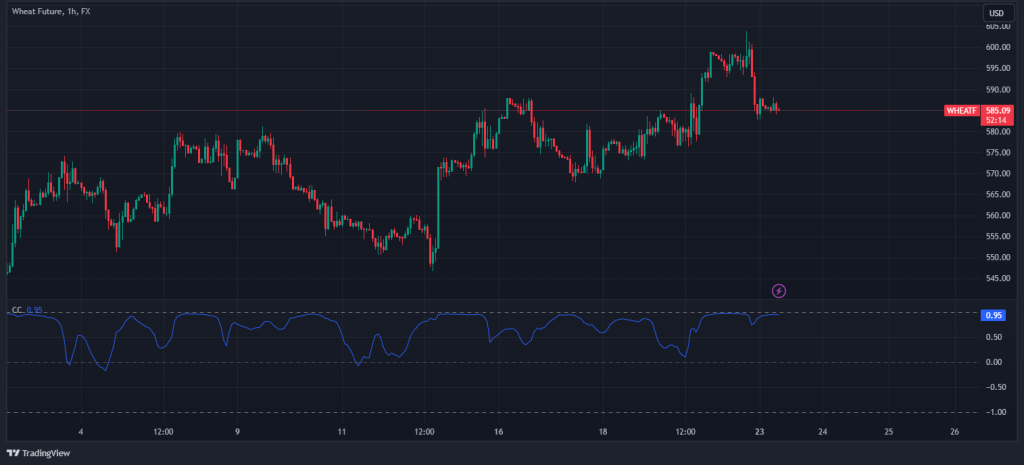
Having both the visual representation and the numerical value helps traders swiftly ascertain the nature of the relationship between the assets, ensuring they are well-equipped to make informed trading decisions.
Examples of Correlated Assets
As mentioned, there are different types of correlated assets, so you must treat each pair of assets differently. The table below serves as a comprehensive guide to understanding how various asset pairs correlate with each other, the type of assets involved, and the influencing factors.
| Asset Pair | Type of Assets | Correlation Type | Influencing Factors |
| Oil and Natural Gas | Commodities (Energy) | Positive | Geopolitical events, global energy demand, innovations in extraction technology |
| Wheat and Corn | Commodities (Agriculture) | Positive | Weather conditions, agricultural policies, global demand for crops |
| US Oil (WTI Crude) and American Airlines Group Inc. (AAL) | Commodities and Stocks | Negative | Oil supply and demand dynamics, geopolitical events, technological advancements in oil extraction, global economic conditions, airline operational efficiency |
| Dow Jones and Nikkei 225 | Stock Indices | Positive/Negative (depends on global market conditions) | Interest rates, geopolitical issues, currency strength |
| NASDAQ 100 and DAX 30 | Stock Indices | Positive/Negative (depends on global market conditions) | Global economic health, geopolitical issues, currency strength |
| USD/ZAR, EUR/ZAR, GBP/ZAR | Currency Pairs | Positive | Performance of the South African Rand against developed market currencies, economic conditions in South Africa |
| USD/TRY, EUR/TRY, GBP/TRY | Currency Pairs | Positive | Performance of the Turkish Lira against developed market currencies, economic conditions in Turkey |
| Chevron and ExxonMobil | Stocks (Oil and Gas) | Positive | Oil prices, industry regulations, global energy demand |
As you can see in the table above, trading correlated assets involves leveraging the relationship between two financial instruments to make informed trading decisions.
Now, let’s delve into practical examples and the dynamics of trading correlated assets. Understanding the nuances of asset correlation requires familiarity with commonly correlated assets. So, let’s explore some clear examples:
Oil and Natural Gas
When you think about correlated financial assets, the first that pops up in mind is oil and natural gas. These energy commodities often exhibit a positive correlation because similar market factors influence them, such as geopolitical events and changes in global energy demand. For example, a surge in oil prices can lead to an increase in natural gas prices and vice versa.
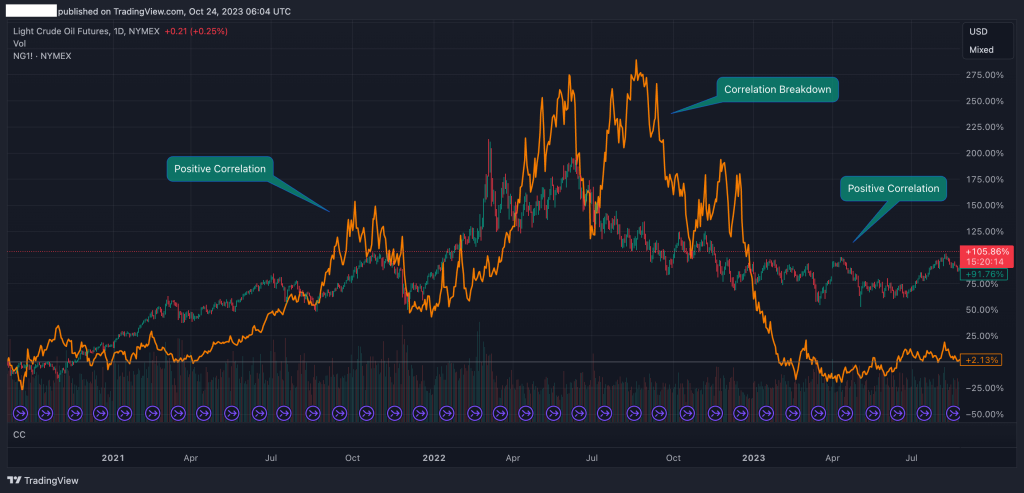
From the chart above, we see that both Oil and Natural Gas have a high positive correlation due to the fact that the same factors, such as Geopolitical events, global energy demand, and innovations in extraction technology, often influence them.
However, as we previously mentioned, correlated assets often may move in the opposite direction, a phenomenon known as a correlation breakdown. As seen in the chart above, although oil and natural are highly correlated, they may lose correlation for a while. This presents a risk for many investors; however, it might also provide an opportunity for traders to enter a position, as they assume the two assets’ correlation will return to their average values.
Wheat and Corn
As agricultural commodities, wheat and corn prices are influenced by similar factors, including weather conditions, farming innovations, and changes in global crop demand. As such, these two grain commodities that are traded in the US have a very high correlation.
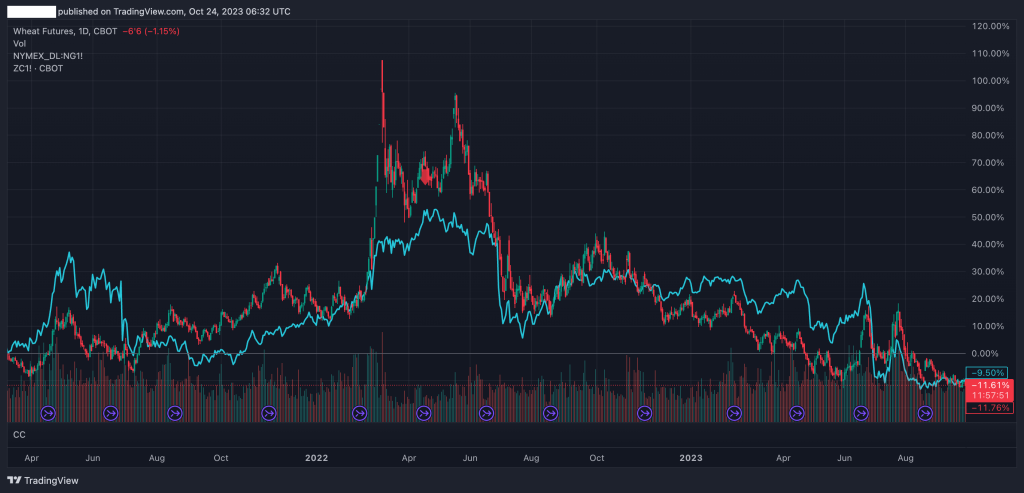
The chart above shows the relationship between Wheat and Corn. When adverse weather conditions harm wheat crops, corn crops are likely to be affected similarly, leading to a positive price correlation. Very rarely, these two variables move in opposite directions. When they do, some traders interpret it as an opportunity for correlation trades.
NASDAQ 100 and DAX 30
Though these two assets are not widely known as two correlated assets, I’ve seen many professional traders use this correlation as a signal to enter trades and analyze the markets. As a matter of fact, one of the best traders I’ve seen in my life was trading these two assets, trying to monitor any anomaly in their correlation.
Generally, these stock indices represent the performance of 100 major companies listed on the NASDAQ stock exchange and 30 major companies listed on the Frankfurt Stock Exchange, respectively. Despite being from different regions, these indices can show a correlation due to globalization and the interdependence of global markets.
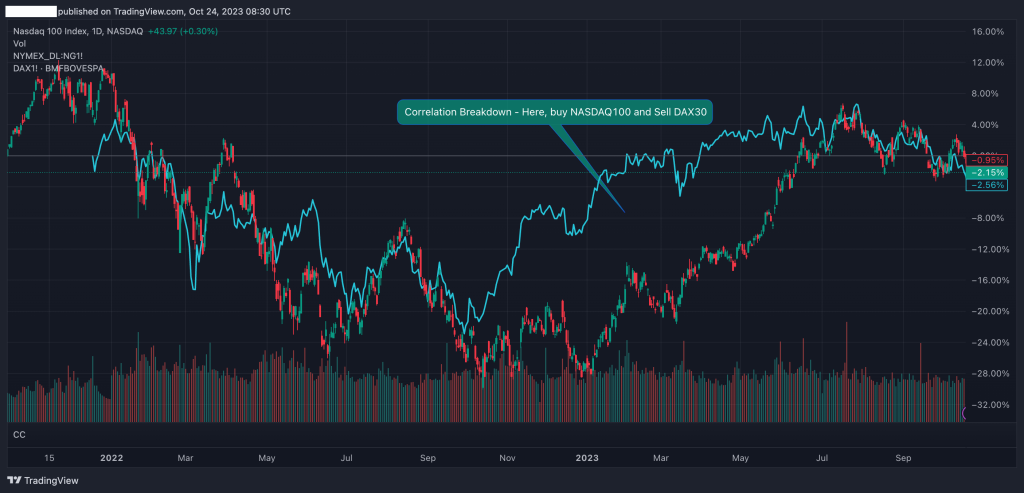
As you can see, Nasdaq 100 and Dax 30 have a special price correlation. Usually, these two assets are positively correlated. However, as seen in the chart above, whenever you notice a break of correlation, you take a trade with the assumption that the assets’ correlation will be met again.
US Oil and American Airline Stocks
The correlation between US oil prices and American airline stocks is an intriguing aspect of the financial markets, often characterized by a negative relationship. This is primarily because fuel costs constitute a significant portion of an airline’s operating expenses. The chart below shows the negative correlation between the US Oil and American Airline Groups Inc. Stock Price.
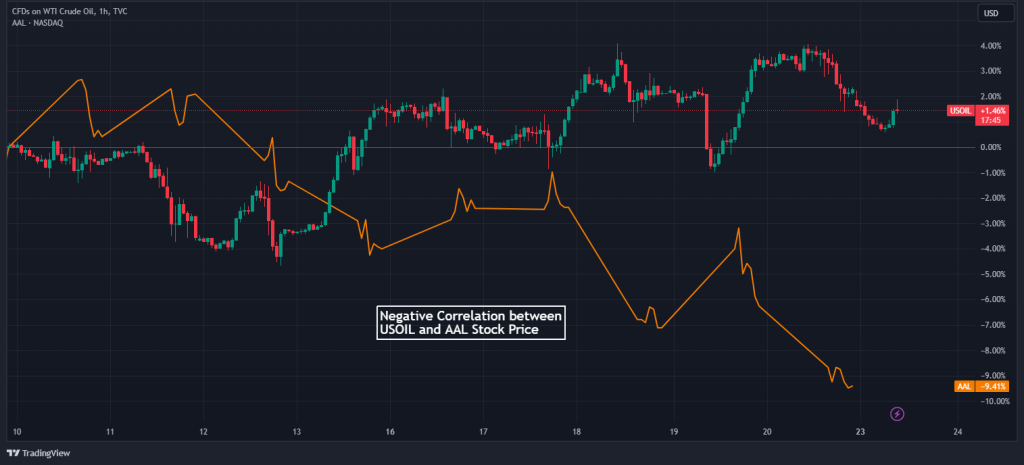
So, when oil prices rise, the cost of jet fuel increases, leading to higher expenses for airlines and potential reductions in their profit margins. Conversely, when oil prices drop, airlines tend to benefit from lower fuel costs, which can contribute to higher profits.
In that aspect, while many traders use this correlation to identify trade opportunities, it can also be used for hedging. Hence, a strategy of buying crude oil and selling airline stocks.
Trading Correlated Indices
Indices like the Dow Jones, S&P 500, and Nikkei 225 provide a snapshot of market performance. For example, from the chart below, you can notice that when the U.S. indices, such as the Dow Jones, end the trading day in the red, it is common to see Asian indices like the Nikkei 225 open lower, illustrating a positive correlation influenced by global market sentiments. Therefore, it is an excellent technique to monitor two indices when trading the opening range breakout trading strategy.
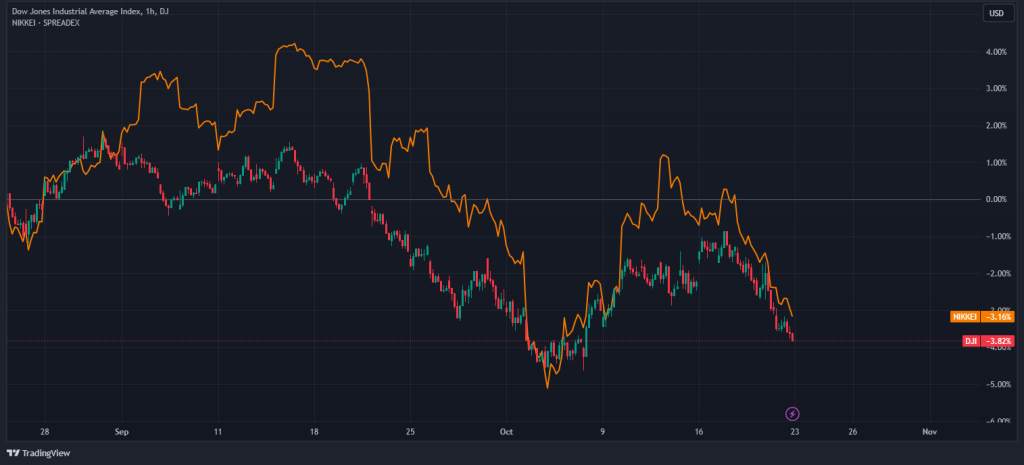
However, once again, the correlation between indices is not permanent. When broken, traders use this correlation breakdown to find trading opportunities.
Currency Pairs and Their Relationships
Currency pairs, particularly when involving emerging market (EM) currencies paired with developed market currencies, showcase interesting correlation patterns.
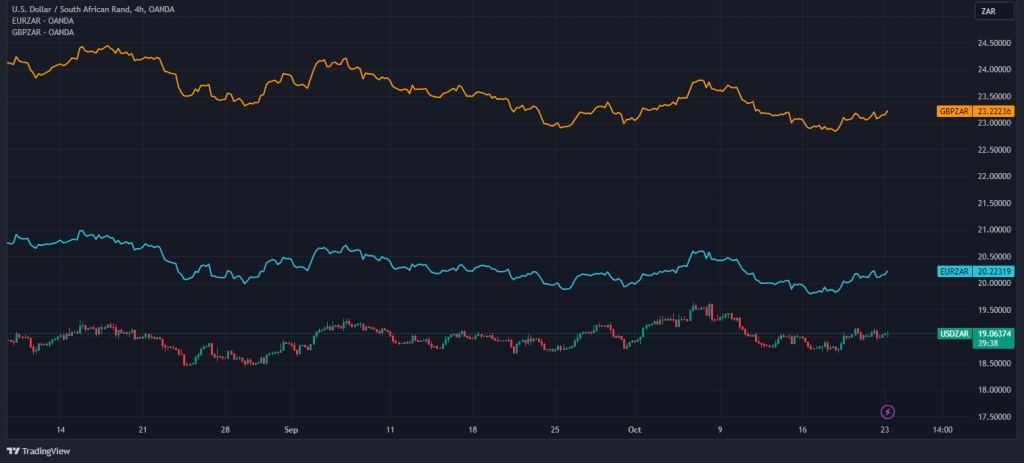
For instance, as seen in the chart above, if USD/ZAR rises, there’s a strong likelihood that EUR/ZAR and GBP/ZAR will follow suit, as shown in the chart above. This is because the common denominator here is the performance of the EM currency, in this case, the South African Rand.
To learn more about currency pairs correlation, we suggest to download out Forex correlation cheat sheet.
Correlated Stocks
Observing sectors like energy and technology, we notice that stocks within these sectors often move in tandem. For instance, oil and gas giants Chevron and ExxonMobil typically showcase highly correlated price movements due to their reliance on oil prices. The chart below shows that Chevron and ExxonMobil have a correlation coefficient of 0.97.
Similarly, technology companies, influenced by innovation trends, market demand, and regulatory changes, tend to experience correlated stock movements.
How to Trade Correlated Assets
So, how do you trade correlated assets? As mentioned several times, when you trade correlated assets, you assume that the temporary break of correlation is about to pause at some point. This is the most conventional method of trading correlated assets, although very rarely, correlated assets can lose their correlation for a while (or even forever), which can also be used as a trading strategy.
However, let’s stick to the first technique. In the example below, you can see wheat and corn cash contracts (wheat is displayed in candlesticks). Remember, when trading correlations, you should not look for a significant correlation breakdown. Often, a minor breakdown can be an excellent indicator for entering a trade.
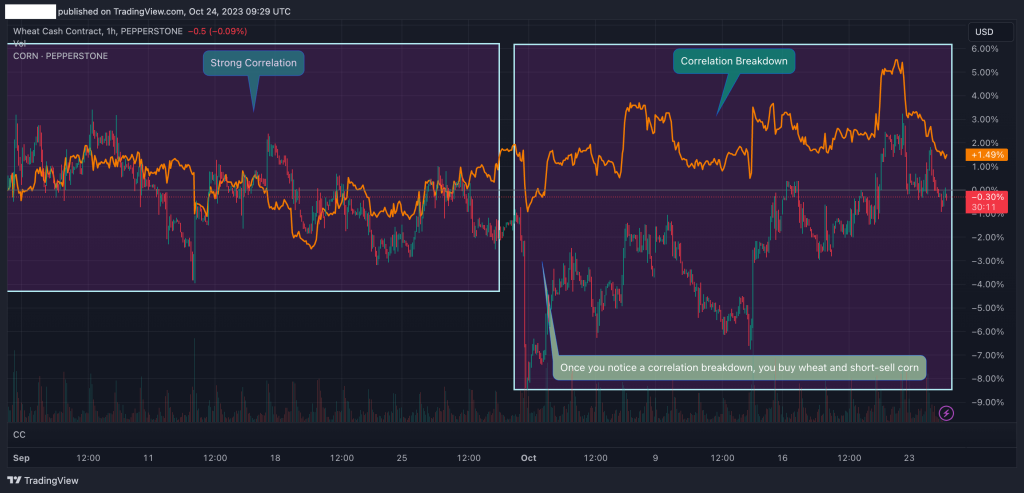
In the chart above, you can see how the two assets move in correlation throughout the day. Then, at some point, wheat and corn slightly lost their correlation. When this happens, one technique is to trade the wheat-corn spread; hence, buying wheat and selling corn. However, if you can notify an unusual movement of one of the instruments, you can trade just one of the assets. So, let’s say, in the above example, wheat’s price has dropped significantly without any significant reason, while corn’s price seems fairly stable. In that case, you’ll buy wheat, assuming the correlation between the two will likely return to its average values.
Summary
In sum, the asset correlation trading strategy is certainly one of the most interesting techniques traders can utilize. It does not involve sophisticated trading tools or analysis methods. Instead, you simply closely monitor several assets that are positively (or negatively correlated) to find anomalies in the markets.
One key aspect of the strategy is that it is full of signals and ways of interpretation. There’s no right or wrong when trading correlated assets; it is just a basic concept you must follow. Moreover, within time, you’ll be able to identify these correlation breakdowns without much effort by just looking at the watchlist window on your trading platform.
Frequently Asked Questions About the Correlation Trading Strategy
Here are some frequently asked questions about correlation trading strategy:
What is the correlation between assets?
Asset correlation is a statistical measure showing how two or more financial instruments move in relation to each other. It ranges from -1 to 1, where 1 is a perfect positive correlation, -1 is a perfect negative correlation, and 0 means no correlation. For example, a correlation of 0.8 between two stocks suggests they move in the same direction 80% of the time. Traders and investors use this data for portfolio diversification and risk management, balancing assets with different correlations to optimize returns while mitigating risk.
Does the asset correlation trading strategy work?
The asset correlation trading strategy’s success depends on accurate correlation interpretation, market conditions, and robust risk management. While it provides valuable insights and trading opportunities in stable markets, correlations can break down during volatile periods, potentially leading to losses. Having said that, there’s no doubt that the correlation strategy is a powerful and simple tool to conduct market analysis.
How do you trade highly correlated assets?
Trading highly correlated assets involves capitalizing on their synchronous movements, often employing a trading strategy where one asset is bought while the other is sold short. This approach aims to profit from the convergence or divergence of their prices. However, traders must closely monitor these positions and adjust them according to changes in correlation and market conditions, ensuring robust risk management practices are in place to mitigate potential risks and protect their trading capital.
Risk Disclosure: The information provided in this article is not intended to give financial advice, recommend investments, guarantee profits, or shield you from losses. Our content is only for informational purposes and to help you understand the risks and complexity of these markets by providing objective analysis. Before trading, carefully consider your experience, financial goals, and risk tolerance. Trading involves significant potential for financial loss and isn't suitable for everyone.


