


- Pullbacks are temporary retracements in asset prices within a prevailing trend, often caused by short-term traders taking profits.
- The pullback trading strategy is built on the concept of trend following, where traders aim to capitalize on the prevailing market trend, requiring key levels to join an existing trend.
- Successful pullback trading involves mastering a variety of technical analysis tools, including Fibonacci retracement levels, Parabolic SAR, trend lines, and moving averages, each providing unique insights and entry signals.
Several of the most successful traders attribute their trading success to their ability to “follow the trend.” While this sounds reasonable and simple, traders are often faced with this question: “How do I enter a position in an ongoing trend?”
The answer to this question is wrapped up in the pullback trading strategy. So, this article will give you an in-depth insight into this strategy, explain how it differs from reversals, and show you the right way to use it.
What Are Pullbacks in Trading?
Every trend trader needs pullbacks to catch a trend, making it an important part of any trend-following strategy. But what exactly are pullbacks? Simply put, a pullback is a temporary retracement in the price of an asset or security from its prevailing trend. For instance, this phenomenon is observed when there is a brief dip in the price of a steadily climbing asset or a small rise in the price of an asset that is generally on the decline.
Technically, pullbacks look something like that:
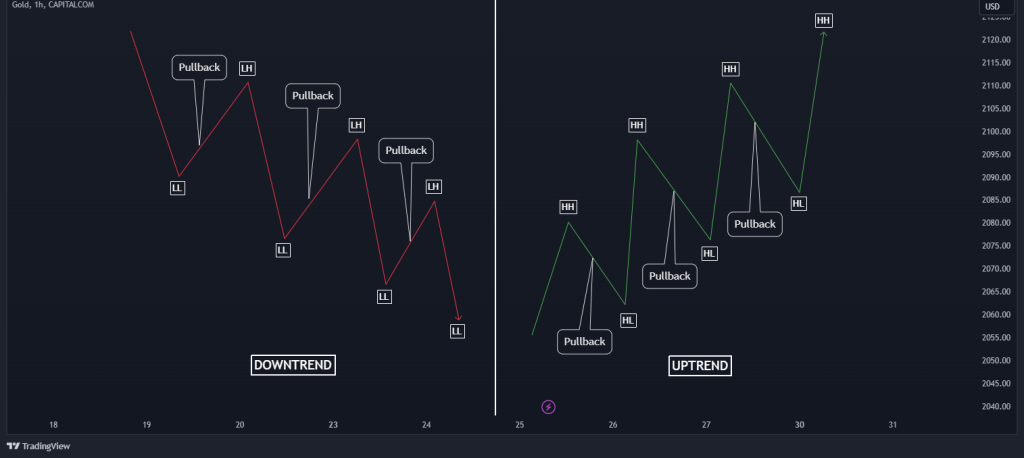
Pullbacks are a natural part of market fluctuations and are primarily driven by short-term traders taking profits, which momentarily disrupts the existing trend. They are also a vital part of the smart money concept strategy, which includes market scenarios like the break of structure and the change of character.
While identifying pullbacks can be a game-changer for traders, as it allows them to enter a trade at a more favorable price, it also requires a keen eye and a thorough understanding of market conditions to distinguish it from genuine reversals. However, once traders learn how to identify market pullbacks, they get a vital tool in knowing when to join an existing market trend.
Pullback vs Reversal – What’s the Difference?
Differentiating between a pullback and a reversal is paramount for traders. Making the wrong call can result in missed opportunities or substantial losses.
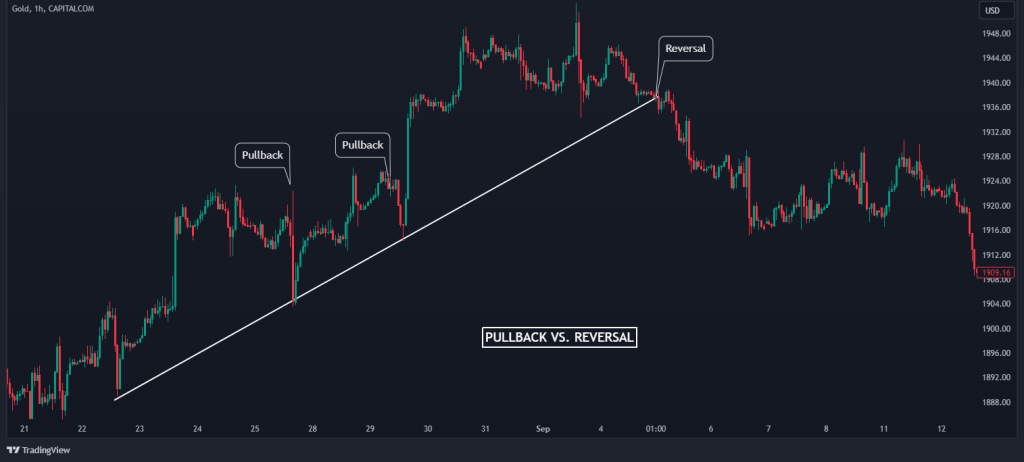
As mentioned earlier, a pullback represents a temporary retracement or correction in the price of an asset occurring within the prevailing trend. It is a brief moment when the price goes against the dominant trend, only to return to its initial direction eventually. Picture a thriving uptrend; a pullback, also known as price correction, in this scenario would be a slight dip in prices. Conversely, in a downtrend, a pullback would manifest as a short-lived rise in prices.
In contrast to pullbacks, a reversal is a more profound and lasting change in the direction of the price. It’s not just a brief interruption in the trend; it’s a complete about-face. A bullish trend turning bearish or a bearish trend turning bullish are classic examples of reversals.
In the chart below, you can see the difference between pullbacks and reversals:
Many traders view the occurrence of pullbacks as golden opportunities to join the trend at more favorable prices. Traders who are good at identifying pullbacks and distinguishing them from reversals can potentially enhance their trading performance by entering trades at optimal positions.
On the other hand, identifying reversals is crucial as they mark the end of an existing trend and the beginning of a new one. Traders who can spot reversals early can position themselves to capitalize on new emerging trends.
To accurately identify pullbacks, traders often use various technical analysis tools. Trend lines can help in visualizing the direction of the market, while moving averages assist in smoothing out price action to identify the underlying trend. Fibonacci retracement levels are another vital tool, helping to pinpoint potential reversal points in the price of an asset, and the list goes on and on.
Moreover, understanding the interplay between support and resistance levels and price action is vital in recognizing reversals. Traders look for signs that the price is losing momentum in its current trend and is starting to show signs of a potential shift. This could be in the form of double tops or bottoms, head and shoulders patterns, or other technical formations.
In sum, differentiating between pullbacks and reversals is all about analyzing the market conditions, understanding the context of price movements, and making informed decisions based on a comprehensive evaluation of available data.
A pullback represents a temporary retracement or correction in the price of an asset occurring within the prevailing trend. It is a brief moment when the price goes against the dominant trend, only to return to its initial direction eventually.
4 Effective Tools to Spot Pullbacks
Identifying pullbacks is essential in knowing when to join a trend. But, as always in trading, the challenge is to identify market conditions. Mastering these tools allows traders to equip themselves with a powerful arsenal to accurately identify pullbacks, differentiate them from reversals, and make informed decisions that align with their pullback trading strategies.
So, here are the four indispensable tools that can significantly enhance your ability to spot pullbacks:
1. Fibonacci Retracement Levels
Well, if you are a fan of our site, you already know we are big fans of Fibonacci retracement levels. These magical levels are derived from a sequence known for its prevalence across various natural phenomena. In trading, these levels provide predictive insight into potential reversal points of an asset’s price. By drawing horizontal lines across a price chart at the key Fibonacci levels of 38.2%, 50%, 61.8%, and 100%, traders can identify potential support and resistance zones.
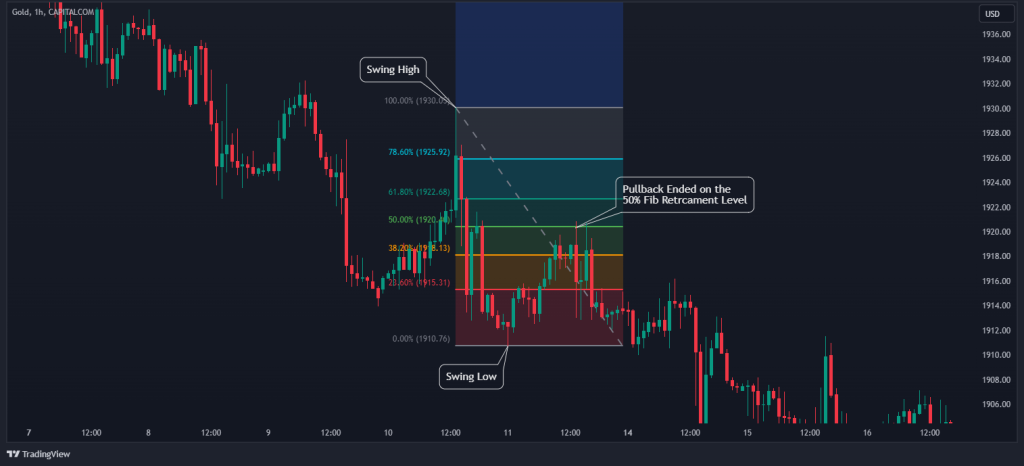
Specifically, during a pullback, these levels can act as zones where the price might pause or bounce back, signaling a potential continuation of the previous trend. Understanding how to draw and interpret these levels correctly is key, and our article on how to use Fibonacci retracement in trading goes into that in detail. You can check it out.
2. Parabolic SAR
The Parabolic SAR is a unique tool that not only helps in identifying the prevailing trend but also provides potential entry and exit points. Represented as dots placed above or below the price on a chart, it’s more like a visual guide for traders. In an uptrend, the dots are positioned below the price, and vice versa for a downtrend.
The good thing about Parabolic is that it can help identify pullbacks using the crossover between the price and the indicator’s line.
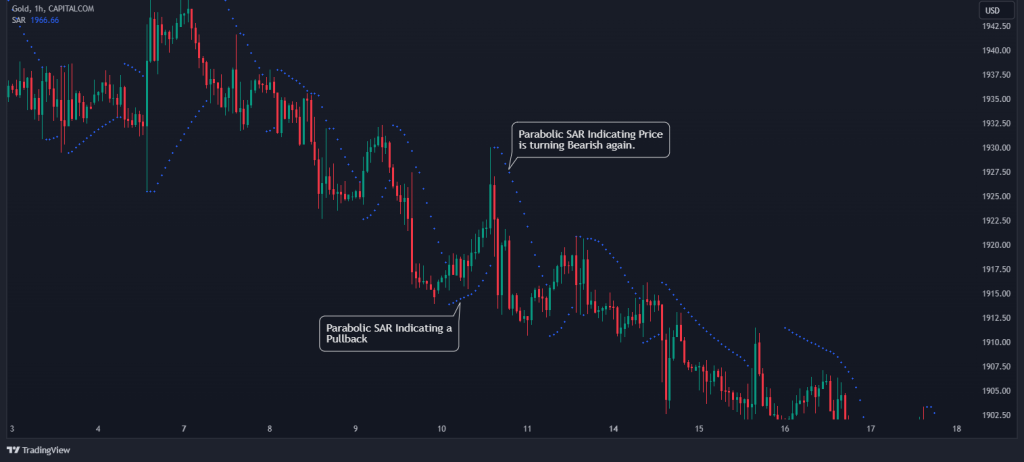
During a pullback, observing the behavior of the Parabolic SAR dots can provide invaluable insights; if the dots remain on the same side of the price as they were before the pullback, it can be an indicator that the pullback is temporary, presenting a potential entry point for traders in line with the prevailing trend.
3. Trend Lines
Trend lines are foundational tools in technical analysis, aiding traders in visualizing the overall direction of an asset’s price movement. They are simple to use, and at the same, they are highly effective. By connecting the lows in an uptrend or the highs in a downtrend, a trend line is formed, providing a visual representation of the prevailing trend.
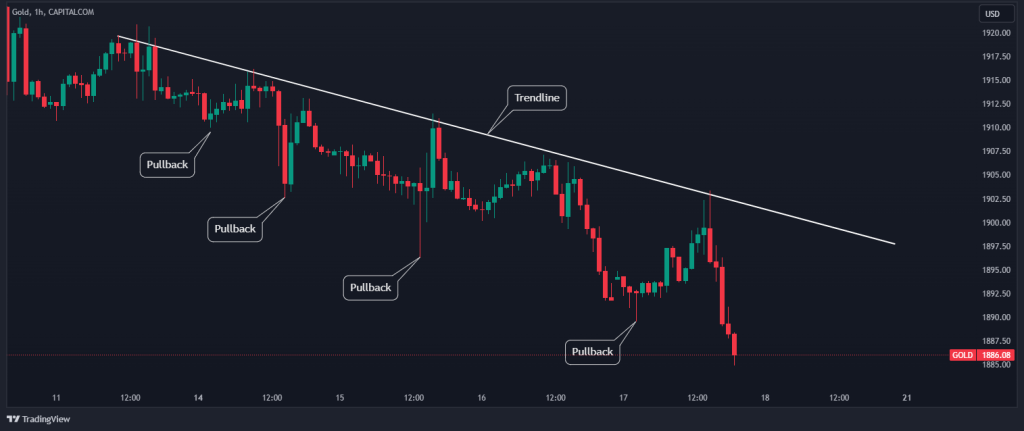
The price might deviate from this line during a pullback but not break through it significantly. This subtle deviation could serve as a crucial indicator of a pullback, providing traders with a potential opportunity to enter the market while anticipating a trend continuation.
4. Moving Averages
Moving averages are another excellent tool to help in smoothing out price action, providing a clearer picture of the prevailing trend. These averages are especially useful in identifying potential pullbacks. Essentially, MAs are used in a similar way to trend lines, where the line is treated as a dynamic support or resistance level.
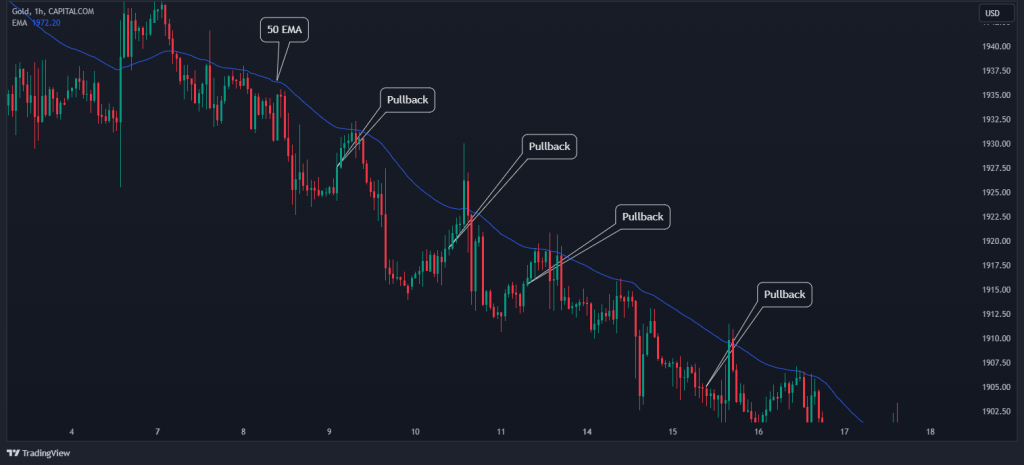
When an asset’s price starts to deviate from a moving average, such as the 50-day or 200-day moving average, without crossing it decisively, it can signal a pullback. Traders often look for these moments when the price approaches but does not significantly breach the moving average, as it can indicate the pullback is coming to an end and the prevailing trend is about to resume.
How to Trade Pullbacks – Trading Strategy
If you understand the article so far, this section is going to be a walkover. We are simply going to tie everything we’ve learned together to show how to trade the pullback trading strategy in real-time.
For this example, we will be using the EUR/USD currency pair to illustrate how the pullback trading strategy works. However, bear in mind that you can use this strategy for any asset you frequently trade. With that said, let’s see how it works.
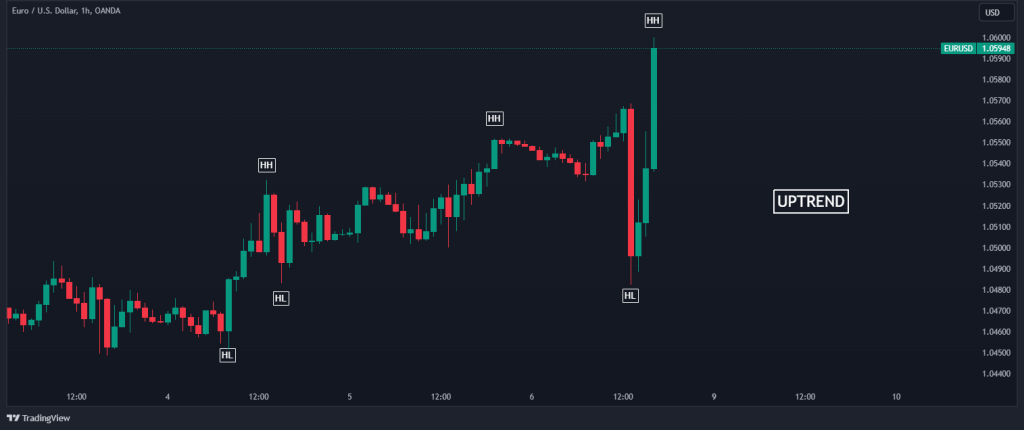
Step 1: Determine the Prevailing Trend
The pullback strategy is a trend-following strategy. Hence, we need to determine the prevailing trend. Doing this will save us from taking unnecessary losses.
There are many ways to determine the trend of an asset. For this example, we will be using the market structure to gain insight into what’s going on in the market. From the chart below, we can clearly see that the price is forming higher highs and higher lows, indicating that the prevailing trend is bullish.
Step 2: Wait for Pullback to Hit the Fibonacci Retracement Levels
Now that we have figured out what trend we are on, it’s time to sit on our hands and expect the price to pull back to our Fibonacci retracement levels. First, you need to draw Fibonacci retracement levels from the lowest to the highest level of the existing trend.
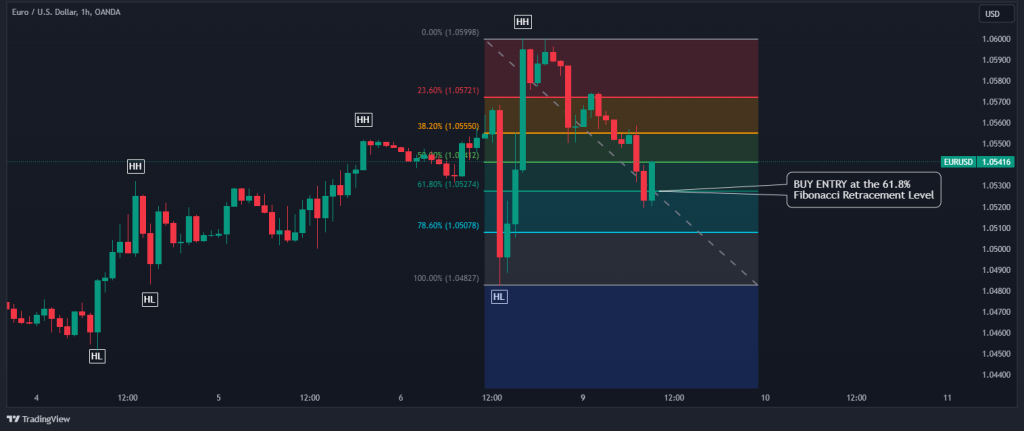
As we can see above, the price has pulled back to the 61.8% Fibonacci Retracement level. Now, as long as the sentiment is still bullish, we can get ready to enter a long buying position.
Step 3: Parabolic SAR Confluence
Although we can safely place our buy trade immediately after the price hits the 61.8% Fibonacci level, we can’t be too sure if the price is ready to take off from this point. One way to find out is to add parabolic SAR to the chart as our confluence.
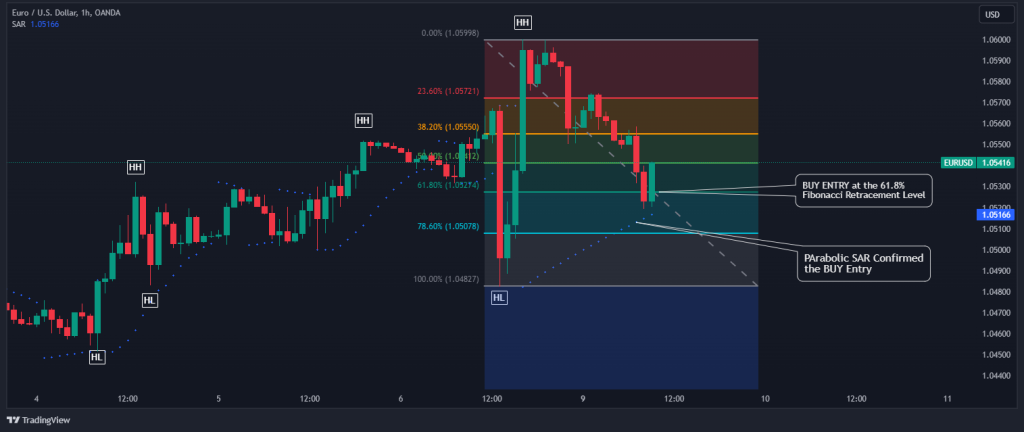
Now that we are cleared with the direction and are ready to buy, we will simply wait for the parabolic SAR dots to appear below the price at the 61.8% Fibonacci Level (as seen in the chart above) and place our buy entry as shown in the chart above.
Step 4: Risk Management
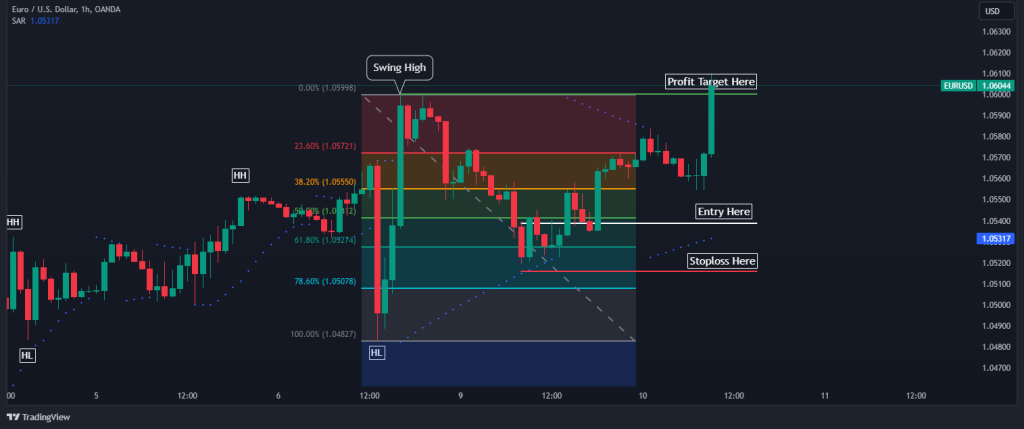
One of the best reasons for adding the Parabolic SAR to our pullback trading strategy is how it helps us figure out where to place our stop loss levels. Once the parabolic SAR agrees with our overall bias, we can assume a new swing low has formed. We can now place our stop loss below the last swing low, as shown below.

Finally, now that we have a high probability setup and our stop loss is in place, setting the target profit is relatively easier. All we have to do is to set our target profit to the swing high of the move, as shown in the chart above.
The Free Pullback Trading PDF
If you need something to easily refer to when you’re trading, here’s a concise pullback trading PDF. It’s free, by the way:
The Free Pullback Trading PDF Download
Summary
In sum, navigating the financial markets demands not just an understanding of price movements but also the ability to decipher when these movements present genuine trading opportunities.
The pullback trading strategy is certainly one that can help trend traders find key levels where they can join the bandwagon. It enables traders to capitalize on temporary retracements in an asset’s price, aligning their entries with the prevailing trend for potential substantial gains.
It is also important to mention that, like any other trading strategy, trading pullbacks pose significant challenges, including the risk of false signals where apparent pullbacks are actually reversals, leading to potential losses. Furthermore, accurately timing entries is complex. It’s like catching a wave just at the right moment – miss it, and you’re left behind; catch it too early, and you might wipe out. But that’s the skill a trader must acquire to become profitable.
Nonetheless, pullbacks are not something one can ignore. Even if you are not directly employing this strategy, you must know how to trade pullbacks.
Frequently Asked Questions about the Pullback Trading Strategy
Here are some popular questions on the pullback trading strategy:
Is pullback trading profitable?
Yes, pullback trading can be highly profitable when executed correctly. This strategy capitalizes on short-term retracements within a prevailing trend, allowing traders to enter the market at more favorable prices. It is especially useful for trend traders who use the trend trading strategy, looking to find key levels to enter traders and ride the momentum.
What are the best indicators for trading pullbacks?
Several indicators prove invaluable when trading pullbacks. For instance, the Fibonacci Retracement Levels are pivotal in marking possible support and resistance zones, guiding traders to anticipate where a pullback might pause or reverse. The Parabolic SAR, a trend-following tool, assists in pinpointing potential reversal points, aiding traders to distinguish between short-term retracements and more significant trend changes.
Moving Averages serve as visual aids, signaling potential entry points when prices deviate slightly but do not decisively cross these averages, indicating a temporary pullback. Additionally, Trend Lines help in visualizing the prevailing trend, offering insights when the price deviates temporarily, suggesting a pullback.
What is pullback and breakout?
As discussed throughout this article, a pullback is a temporary reversal or pause in the prevailing trend of an asset’s price, providing traders an opportunity to enter the market in the direction of the trend at a better price.
On the other hand, a breakout occurs when the price of an asset moves outside a defined support or resistance area, often accompanied by increased volume. Breakout pullbacks can signal the beginning of a new trend or the continuation of an existing trend after a period of consolidation. Traders often use the combination of the pullback and the breakout trading strategy to identify entry points, looking to capitalize on the momentum as the price moves outside of its previous range.
Risk Disclosure: The information provided in this article is not intended to give financial advice, recommend investments, guarantee profits, or shield you from losses. Our content is only for informational purposes and to help you understand the risks and complexity of these markets by providing objective analysis. Before trading, carefully consider your experience, financial goals, and risk tolerance. Trading involves significant potential for financial loss and isn't suitable for everyone.