- The Ichimoku Cloud, created by Goichi Hosoda, is a comprehensive technical analysis tool that uses five components to provide insights into market trends and potential trading signals.
- It indicates bullish or bearish trends based on the price’s position relative to the cloud’s color and the crossover of the Tenkan Sen and Kijun Sen lines.
- The cloud’s angle and thickness offer insights into the trend’s strength and market volatility.
- The Ichimoku Cloud trading strategy includes identifying trends, generating buy/sell signals, and using various components like Chikou Span and Senkou Span cross for trend confirmation and potential reversals.
The development of the Ichimoku Cloud, or Ichimoku Kinko Hyo, is credited to Japanese journalist Goichi Hosoda, who, along with his team, spent over two decades perfecting this trading tool. Their goal was to create an “all-in-one” indicator that could quickly analyze and provide detailed insights into market charts. And many traders would tell you they succeeded in their mission.
In this article, we will discuss what they are, their use cases, and how you can start using them to refine your overall trading plan.
- What is Ichimoku Cloud and How Does It Work?
- How to Use the Ichimoku Cloud Indicator – Ichimoku Cloud Components
- Ichimoku Cloud Trading Strategies
- Ichimoku Cloud Strategy – Trade Example
- The Free Ichimoku Cloud Trading PDF
- Is Ichimoku Cloud a Good Strategy to Predict Price Movements?
- Ichimoku Cloud Trading Strategy FAQs
What is Ichimoku Cloud and How Does It Work?
The Ichimoku Cloud, developed in the late 1930s by Japanese journalist Goichi Hosoda, is a multifaceted technical analysis tool that provides insights into market trends, momentum, and potential trading signals. Its five main components—the Tenkan Sen, Kijun Sen, Chikou Span, Senkou Span A, and Senkou Span B—collectively form the “cloud” or “Kumo.” This cloud is central to the Ichimoku strategy, as it helps traders discern market direction and momentum.
Here’s what the Ichimoku indicator looks like on a chart.
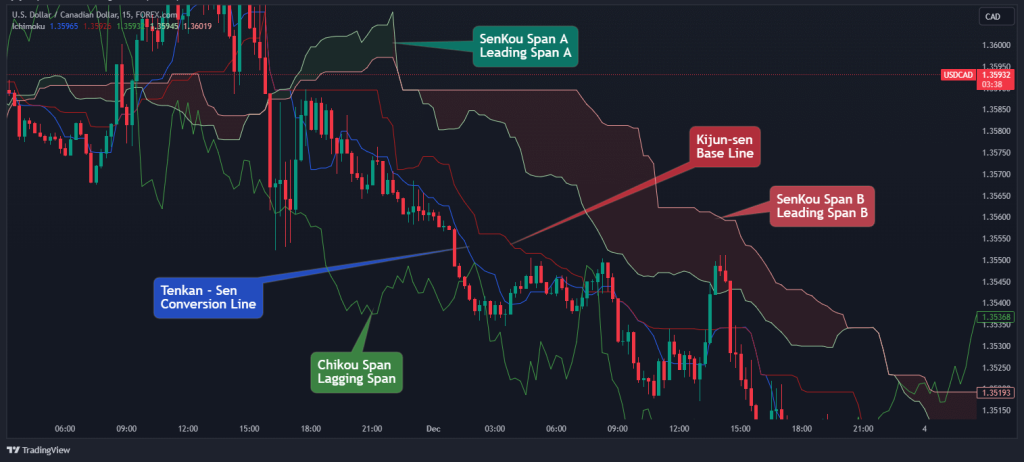
Well, aesthetically, the Ichimoku indicator is certainly not a favorite choice. In fact, some traders prefer not to use it since it makes their trading charts a bit messy. However, despite its not pleasant visualization, its effectiveness is undoubtedly phenomenal.
In practice, the Ichimoku Cloud system, also known as the Ichimoku Kinko Hyo indicator, is interpreted through several key signals. A bullish trend is typically indicated when the price is above a green cloud, and a bearish trend is suggested when the price is below a red cloud. The crossovers of the Tenkan Sen and Kijun Sen lines further contribute to buy or sell signals, depending on their relative positioning and the overarching trend shown by the cloud.
The cloud’s angle is another critical aspect of this strategy, offering insights into the strength of a trend. A steeply ascending cloud often signals a strong bullish trend, while a sharply descending cloud implies a bearish trend. Additionally, the thickness of the cloud can indicate market volatility, with a thicker cloud pointing to higher volatility and a thinner cloud suggesting less.
How to Use the Ichimoku Cloud Indicator?
Using the Ichimoku Cloud Indicator effectively requires understanding its components and how they interact to provide trading signals. The indicator has five main lines, each offering unique insights into market trends and momentum.
1. Tenkan Sen (Conversion Line)
This line represents the midpoint of the highest high and lowest low over the past nine periods. It’s faster moving and sensitive to price changes, making it a key market momentum indicator. When the Tenkan Sen moves sharply upwards or downwards, it signals strong bullish or bearish momentum, respectively.
2. Kijun Sen (Base Line)
Calculated as the midpoint of the highest high and lowest low over the past 26 periods, the Kijun Sen is slower moving than the Tenkan Sen. It acts as a significant indicator of market trend. A price above the Kijun Sen suggests bullish trends, while a price below indicates bearish trends. The relationship between Tenkan Sen and Kijun Sen can also provide valuable signals; for instance, a crossover of these lines can indicate potential trend reversals.
3. Senkou Span A (Leading Span A)
This line is the average of the Tenkan Sen and Kijun Sen, plotted 26 periods ahead. It forms one edge of the Kumo or cloud. When this line is above the Senkou Span B (Leading Span B), it suggests bullish market sentiment.
4. Senkou Span B (Leading Span B)
Calculated as the midpoint of the highest high and lowest low over the past 52 periods and plotted 26 periods ahead, this line forms the other edge of the Kumo. The cloud formed between Senkou Span A, and B is crucial in understanding market volatility and potential support and resistance areas. A thicker cloud indicates higher volatility and stronger support or resistance, while a thinner cloud suggests lower volatility.
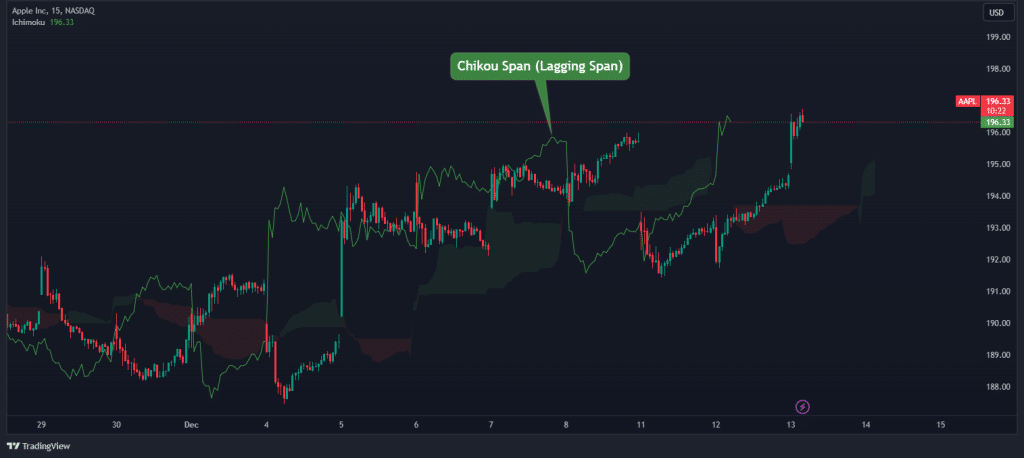
5. Chikou Span (Lagging Span)
This line is the current closing price plotted 26 periods back. It provides a historical perspective, allowing traders to compare current market trends with past price actions. When the Chikou Span crosses the price from below, it may indicate a bullish trend and a cross from above can suggest a bearish trend.
Ichimoku Cloud Trading Strategies
The Ichimoku trading strategy encompasses various techniques that leverage the unique components of the Ichimoku indicator to identify trading opportunities. Here are some key strategies when using the Ichimoku trading indicator:
1. Trend Identification
Primarily, the Ichimoku Cloud is excellent for identifying market trends. A bullish trend is indicated when the price is above the cloud, and conversely, a bearish trend is signaled when the price is below the cloud. The thickness of the cloud can also provide insights into market volatility – a thicker cloud indicates higher volatility, and a thinner cloud suggests a lower volatility.

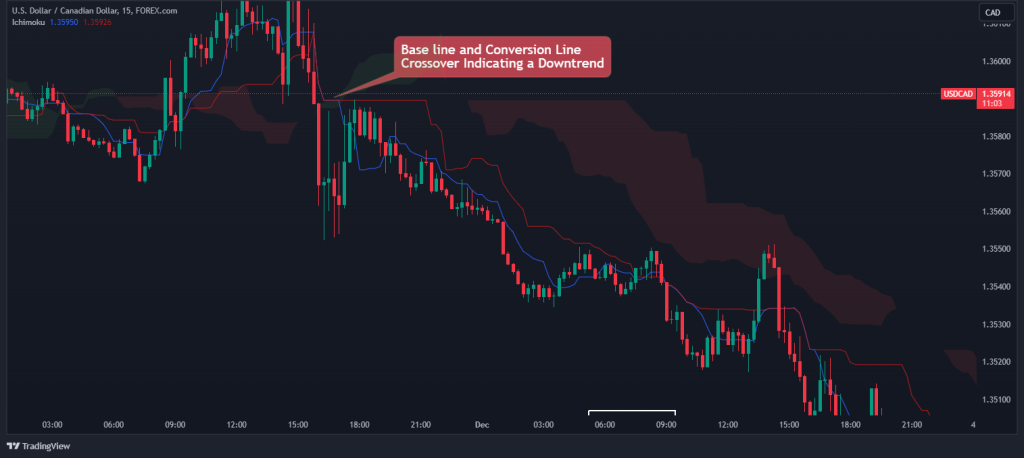
2. Base Line and Conversion Lines Crossover
These are generated based on the positioning of the Ichimoku lines relative to the cloud and each other. A typical buy signal occurs when the price moves above the cloud and the cloud turns from red to green, while a sell signal is indicated when the price falls below the cloud and turns red. Additionally, the Tenkan Sen (Conversion Line) crossing above the Kijun Sen (Base Line) is a bullish signal, and the opposite crossing is bearish.
3. Chikou Span (Lagging Span)
Another unique strategy is to solely use the Chicou Span. This component, plotted 26 periods behind the current price, helps confirm trends and identify potential reversals. As you can see in the Apple chart below, a bullish signal is noted when the Chikou Span crosses above the price, and a bearish signal is indicated when it crosses below.
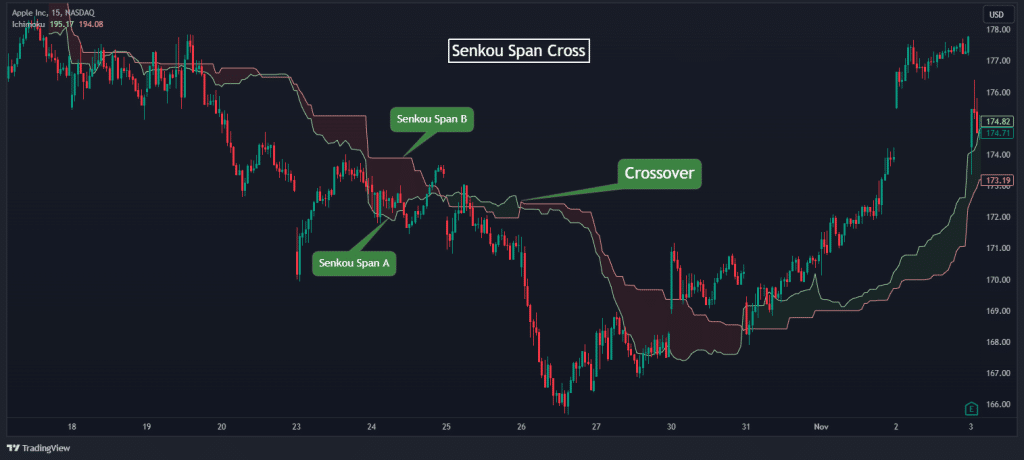
4. Senkou Span Cross
Like the Chikou Span, traders can also use the Senkou Span Cross as a trading strategy. Basically, the idea of this strategy is similar to any other crossover between indicators, such as the moving average crossover strategy. This occurs when Senkou Span A crosses above or below Senkou Span B. Then, a crossover to the upside is a bullish signal, and a crossover to the downside is bearish.
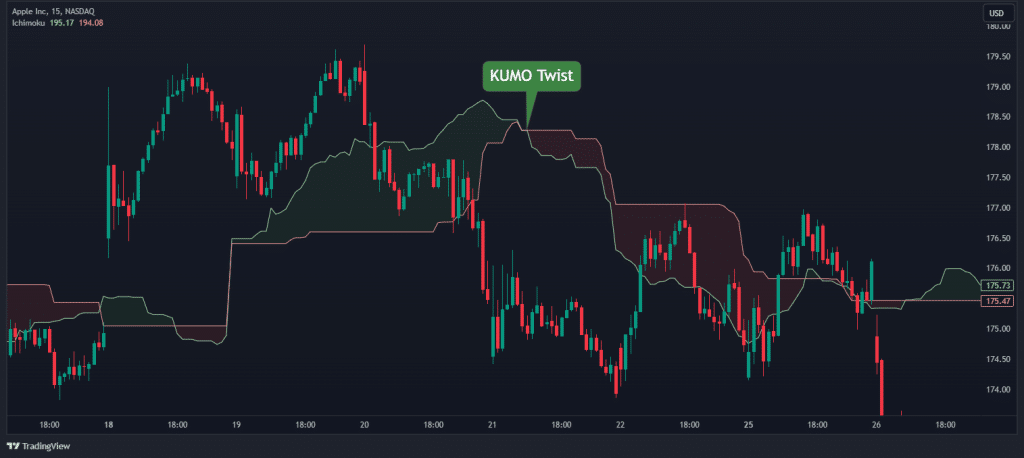
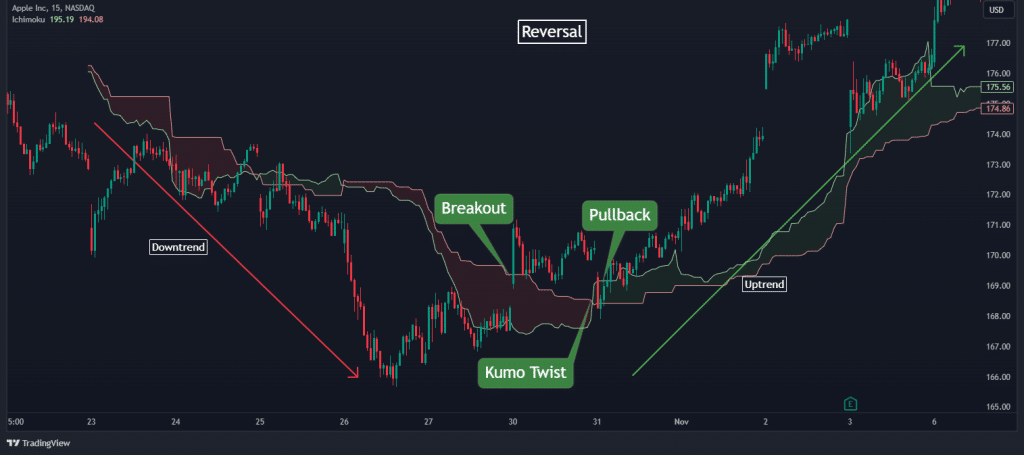
5. Kumo Twist
The Kumo Twist is not a widely used strategy among traders. Yet, it is known as a very effective one. Technically, based on the Kumo Twist strategy, a change in the cloud’s color, from red to green or vice versa, indicates a potential trend reversal. This is often used as a confirmation rather than a primary signal.
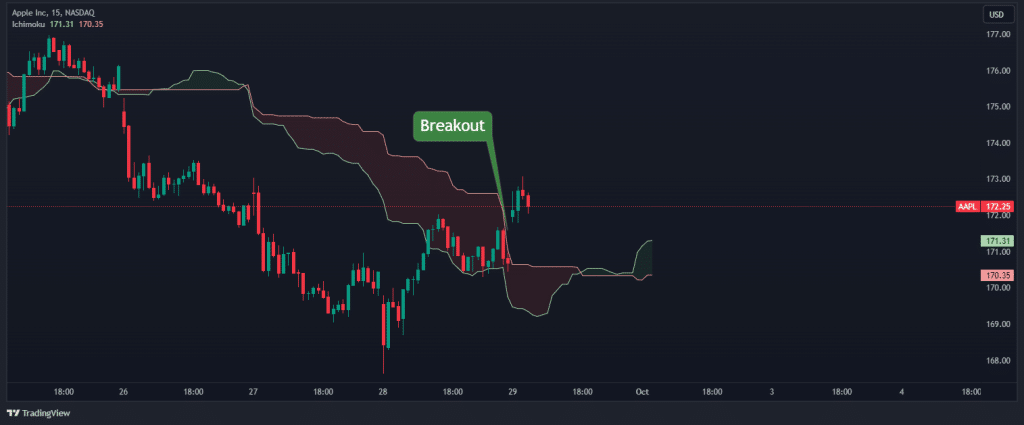
6. Breakout Strategy
Another way to use the Ichimoku is to identify breakouts. This breakout strategy involves trading breakouts above or below the cloud. The idea is to capture shifts in market sentiment as indicated by the price breaking through the cloud.
7. Reversal Strategy
Finally, the Ichimoku can also be used to identify trend reversal. Here, traders look for signals like a Chikou Span cross or a Kumo twist to indicate a possible reversal in the current trend.
Ichimoku Cloud Strategy (Trading Example)
By now, you pretty much understand how the Ichimoku indicator works. What’s left is to put this into action. Bear in mind, however, that there are plenty of ways to trade the markets using the Ichimoku indicator. This is largely because the Ichimouko is a very intuitive and insightful indicator. The idea of this indicator is to provide a variety of trading signals.
So, in this section, we are going to show two basic techniques for using the Ichimoku indicator. In these examples, we will focus on trading two market scenarios: trend-following and reversals. Let’s get to it.
Ichimoku Cloud Strategy with Key Levels
A very good technique is to identify key levels in the market to determine where to enter a trade. To do so, you must look for support and resistance levels or supply and demand zones. The Ichimoku Cloud, in that case, helps you confirm the trend and find suitable entry levels.
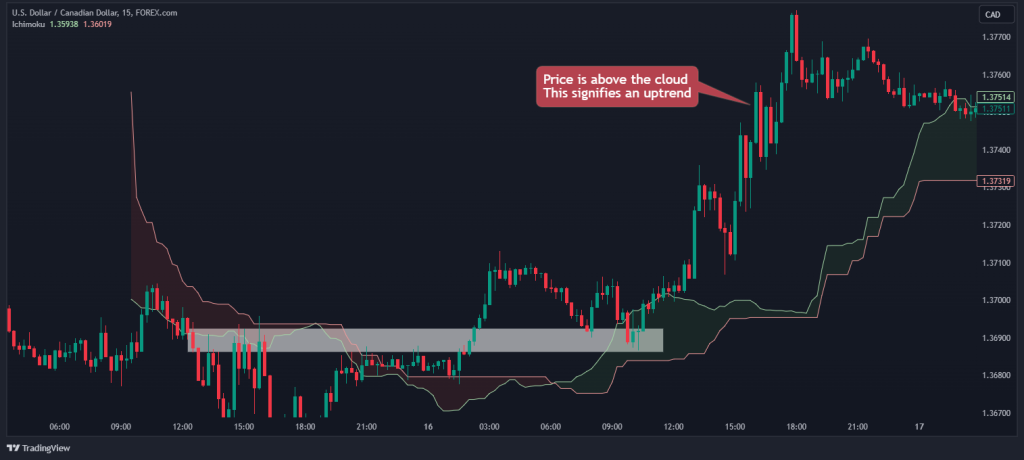
Here’s a practical example using the USD/CAD currency pair in a bullish trend scenario:
Step 1: Identify the Trend
The first step involves identifying the market trend. In our example with USD/CAD, the price is above the Ichimoku Cloud, indicating an uptrend. The cloud acts as a visual representation of the trend’s direction, with the price above the cloud signaling bullish momentum. We can also see that the cloud is fairly narrow, which indicates low volatility in the market.
Step 2: Wait for a Pullback for Intraday Trend Change Confirmation
After identifying the trend and the market’s direction, the next step is to wait for a pullback to a significant support level that aligns with the trend direction. A pullback offers a strategic entry point, especially when you’ve identified a clear key level. Before entering a buy position, you should also look for intraday trend change confirmation, which is essentially a technique of switching to other timeframes to get similar buy signals.

So, as you can see, when the price hits the Ichimoku cloud and bounces back upwards, we have a clear signal to enter a buying position. In that case, you can also use the key levels as a stop loss level in order to effectively manage your risk.
Ichimoku Cloud Break – Pullback Strategy
Another effective method to use with the Ichimoku cloud indicator is to look for a trend change. With this approach, known as the counter-trend trading strategy, you are anticipating a trend change after the price breaks through the Ichimoku Cloud. Let’s see how it works.
Step 1: Identifying the Trend Change
First, you must identify a scenario where the price basically crosses the Ichimoku cloud indicator. When this happens, you get a strong signal for a trend reversal.
Consider an example with the Apple (AAPL) stock chart on a 4-hour (4H) time frame. If the price breaks through the Ichimoku Cloud and switches to a bullish trend, it signals a potential reversal.
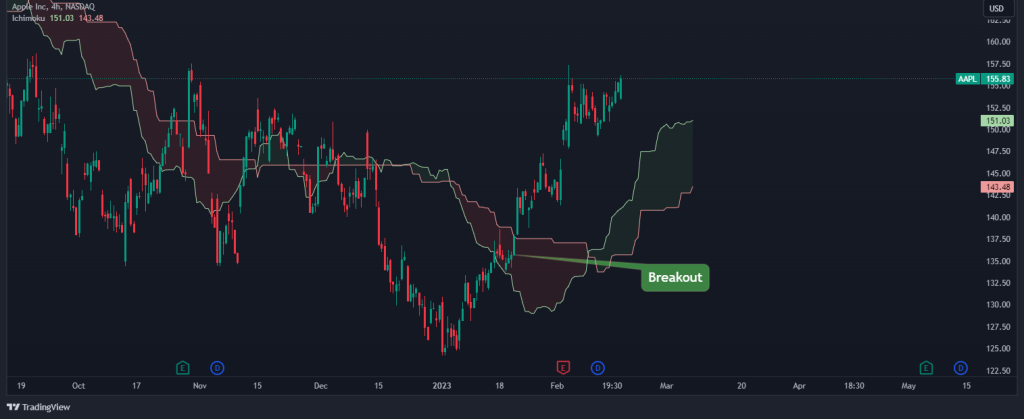
Now, obviously, when the price of an asset breaks through the Ichimoku indicator, you can immediately enter a position. Looking at the example above, you can see that the price indeed reversed and continued to trade higher. However, take note that it is advisable to enter when the price only when it gets out of the Ichimoku channel, meaning it crosses the two lines.
Step 2: Wait for a Pullback and Enter a Trade
Another option is to wait for a pullback. This method is particularly effective for long-term traders who are looking for the ideal entry-level.
So, going back to our trade example, after the price has broken through the Ichimoku Cloud, we can now wait for the price to pull back to the green Ichimoku Cloud and look for an intraday trend change confirmation before going long.

As you can see, the pullback gives us another confirmation to enter a long position. Once the price tests the Ichimoku cloud channel and fails to break it, you can safely enter a position with a tight stop-loss and an excellent risk-reward ratio.
The Free Ichimoku Cloud Trading PDF
If you need something to easily refer to when you’re trading, here’s a concise Ichimoku Cloud trading PDF. It’s free, by the way:
The Free Ichimoku Cloud Trading PDF
Is Ichimoku Cloud a Good Strategy to Predict Price Movements?
To sum up, the Ichimoku Cloud consists of five main components—Tenkan Sen, Kijun Sen, Senkou Span A, Senkou Span B, and Chikou Span—which work together to provide a holistic view of market behavior. This all-in-one indicator aims to eliminate the use of any other technical analysis indicators by offering traders the ability to accurately analyze the markets and constantly receive buy and sell signals.
However, while the Ichimoku Cloud can be a powerful tool for forecasting price movements, its effectiveness greatly depends on the trader’s ability to interpret and utilize its various components correctly. When used correctly, it provides clear signals for buy and sell opportunities, helps identify trend directions and reversals, and can be adapted to various time frames and market conditions.
Ichimoku Cloud Trading Strategy FAQs
Here are some frequently asked questions about the Ichimoku Cloud strategy:
What is the success rate of the Ichimoku Cloud strategy?
The success rate of the Ichimoku Cloud strategy varies and is influenced by several factors, such as market conditions, time frames, and the trader’s proficiency in using the strategy. The effectiveness of Ichimoku Cloud is often debated among traders, with some studies suggesting a success rate of around 40% in bullish setups. However, it’s important to note that in bearish scenarios, the strategy may perform less effectively, with potential losses averaging around -25%.
Does the Ichimoku indicator really predict future price movements?
The Ichimoku Cloud indicator does not necessarily predict future price movements; rather, it provides insights into current market trends, momentum, and potential support and resistance levels. While it can be a useful tool for traders, it is a lagging indicator and might not always give early warnings of market direction changes.
What is the best time frame for the Ichimoku Cloud strategy?
The Ichimoku Cloud Strategy is adaptable across various time frames, from intraday to long-term. However, its reliability might differ across these time frames, with some traders suggesting that longer time frames may yield more dependable signals. Further, many traders claim that the indicator is best when used in multiple time frame analysis setup.
What is the best indicator to combine with Ichimoku?
The Relative Strength Index (RSI) and moving averages like the SMA or EMA are commonly used technical indicators along with the Ichimoku Cloud. These combinations can provide additional insights, such as confirming potential trend reversals signaled by the Ichimoku system and refining trend identifications.
Risk Disclosure: The information provided in this article is not intended to give financial advice, recommend investments, guarantee profits, or shield you from losses. Our content is only for informational purposes and to help you understand the risks and complexity of these markets by providing objective analysis. Before trading, carefully consider your experience, financial goals, and risk tolerance. Trading involves significant potential for financial loss and isn't suitable for everyone.