- The break of structure is a key tool in trading that refers to a shift in price momentum.
- It helps traders to get the first signal that the existing trend is weakening, and a reversal is about to occur.
- Common tools to identify a BOS include support and resistance levels, trend lines and channels, and technical indicators.
Most profitable forex market traders and professionals have built systems around the mantra, “follow the trend.”
But it’s easy to tell that a market is trending when there’s a noticeable rise or fall in the price. However, the market doesn’t always move in apparent trends. In fact, the price only moves in clear market directions 25% of the time. The remaining 75% of the time, it’s either ranging or giving off “hard-to-deduce” trends.
Thankfully, there’s one sure way to identify trends. It’s a mechanical model that doesn’t require indicators or trader discretion. It’s called a Break of Structure (BOS).
In the rest of this piece, we’ll describe what Break of Structure is, how to identify it, and how to trade it.
- What is the Break of Structure in Trading?
- How to Identify Break of Structure – Tools and Techniques
- How to Trade a Break Of Structure in the Markets
- The Free Break of Structure Trading Strategy PDF
- What are the Benefits and Limitations of Break of Structure?
- What’s the Difference Between a Liquidity Grab and a Break of Structure?
- Bottom Line
- Frequently Asked Questions
What is the Break of Structure in Trading?
Typically, the market trends are in steps. It doesn’t just go straight upwards or downwards forever. Instead, it moves in waves of upward and downward movements. Uptrends, downtrends, and consolidations only result from the market moving in these price waves of upward and downward movements.
So, naturally, we have a series of higher highs and higher lows in an uptrend and a series of lower lows and lower highs in a downtrend. This is called market structure. But what happens when this structure is breaking?
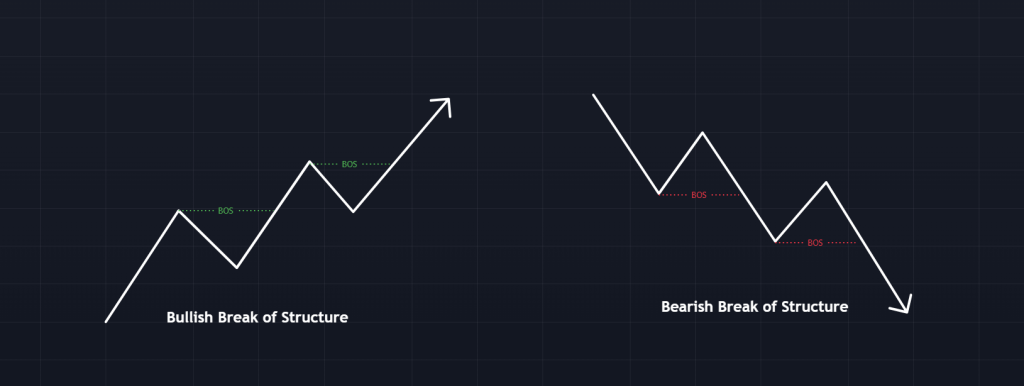
A break of structure is simply the process of forming a higher high on a bullish trend without first creating a lower low. This kind is called a bullish break of structure. In a downtrend, a break of structure occurs when a lower low is created before first developing a higher high, otherwise called a bearish break of structure. In other words, a break of structure signals a continuation in market momentum or market sentiment.
The order is important. It’s a break of structure (BOS) only when a higher high is formed on an uptrend without first breaking the low. In a downtrend, it is only a break of structure when the price forms a lower low before breaking its most recent high. If any of those two scenarios happens, we’re looking at a Market Structure Shift (MSS) or a Change of Character (ChoCh).
Essentially, a break in structure means that you get the first signal that the existing trend is weakening and a reversal is about to occur.
Note that a market structure break doesn’t only happen in a trending market. It can also happen when the price breaks out of a key support or resistance level, an established trendline, or even a chart pattern. Any break out of a usual market structure in the market can be regarded as a break of structure. But going forward, we’ll describe the market structure breaks in a trending market.
Check out our daily market analysis page for insights about leading FX pairs, global indices, and commodities.
Market Structure Shift Vs. Change of Character Vs. Break of Structure
Using the smart money concept strategy, you must learn how to differentiate its elements.
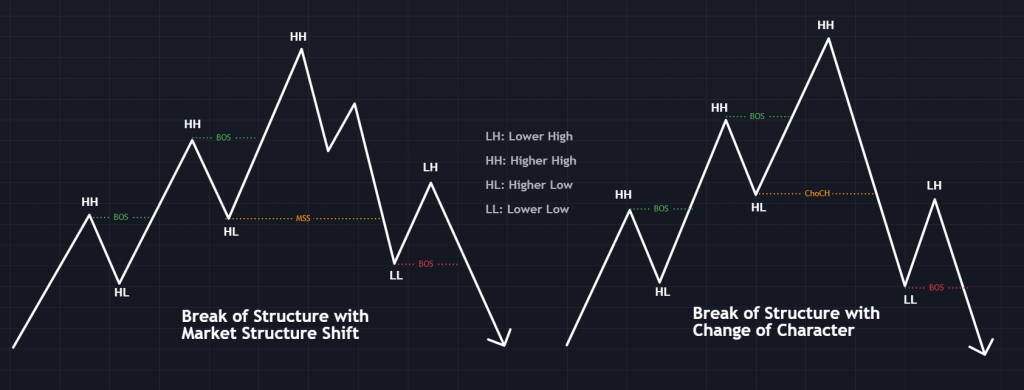
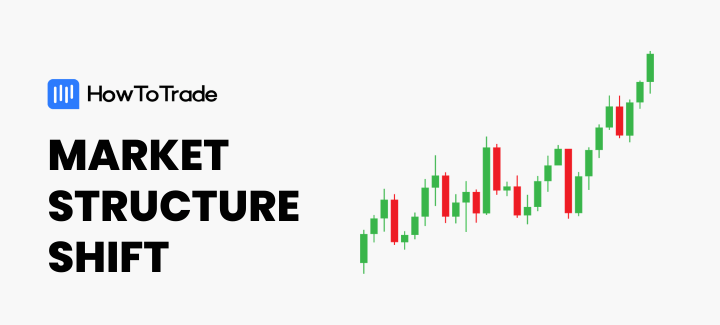
- A Market Structure Shift (MSS) happens when the price makes a significant market shift from bullish to bearish price action, and vice versa. It shows that the market has changed direction, and the new trend is in the opposite direction to the previous one. This is often a sign of a potential trend reversal.
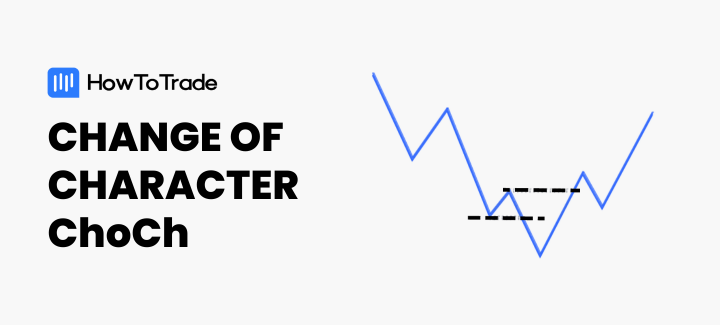
- A change of character (ChoCh) is a slight modification of the Market Structure Shift in that price reverses to take the low in an upward trend direction. For a downtrend, the swing low is taken before the reversal to take the swing high as well.
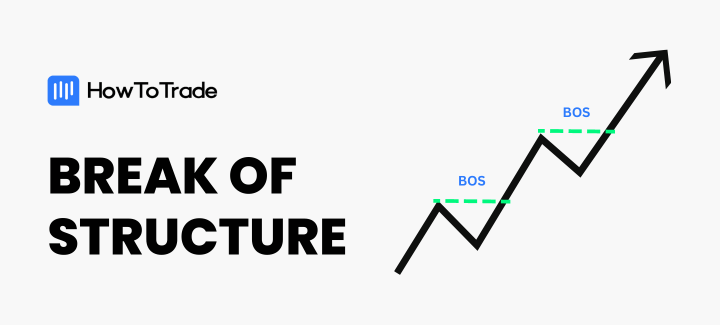
- A Break of Structure (BOS), unlike ChoCh and MSS, suggests that a current market trend is likely to continue. A bullish BOS happens when we have a new high after the most recent higher high, while a bearish BOS happens when the price forms a new lower low after the previous lower low.
Before we move on to the next level, it is important to note that it is not a break of structure if the break above the swing point is only a wick instead of the body of the candlestick.
How To Identify the Break of Structure
Now that you know what a break of structure is, what’s left is to understand how to identify it. Like many other chart patterns and technical analysis indicators, only when you can identify it, will you learn how to trade it. The following tools and techniques will help you spot a break of structure.
Fibonacci Support and Resistance Levels
The Fibonacci retracement tool is excellent for helping you spot a break of structure on your price chart.
To use it, all you have to do is to spot your most recent swing high and most recent swing low. If you’re on TradingView, draw your Fib tool from the first swing to the other. So, in a bullish swing, you draw your Fib from your swing low to the swing high. And in a bearish trend, your swing low is the origin of your Fib tool.
Here’s what it looks like on a price chart:
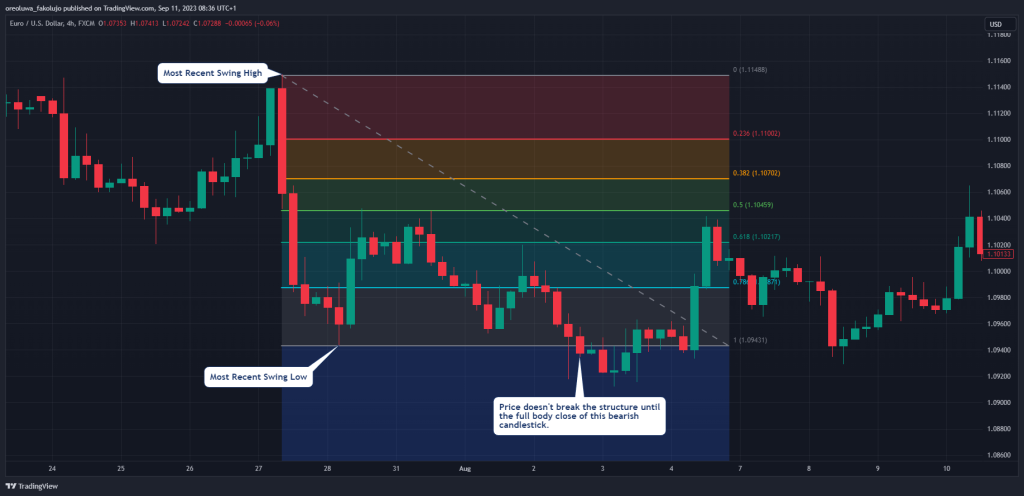
Once you get that right, the rest is easy. You simply wait for the price to retrace into any of your retracement levels before breaking out beyond the most recent swing high or low. Usually, it’s the 1-level on your Fibonacci.
The chart above is a perfect example of identifying your break of structure in forex using a Fibonacci tool. As you can see, once the price retraces up from the support level, the break of structure is confirmed, and you can enter a long-buying position.
Trend Lines and Trend Channels
Trend lines and trend channels are especially great tools in helping you identify breaks of structure. Here’s how you can use any of them:
You first want to mark out the price’s most recent points of contact with your trend channel on both sides.
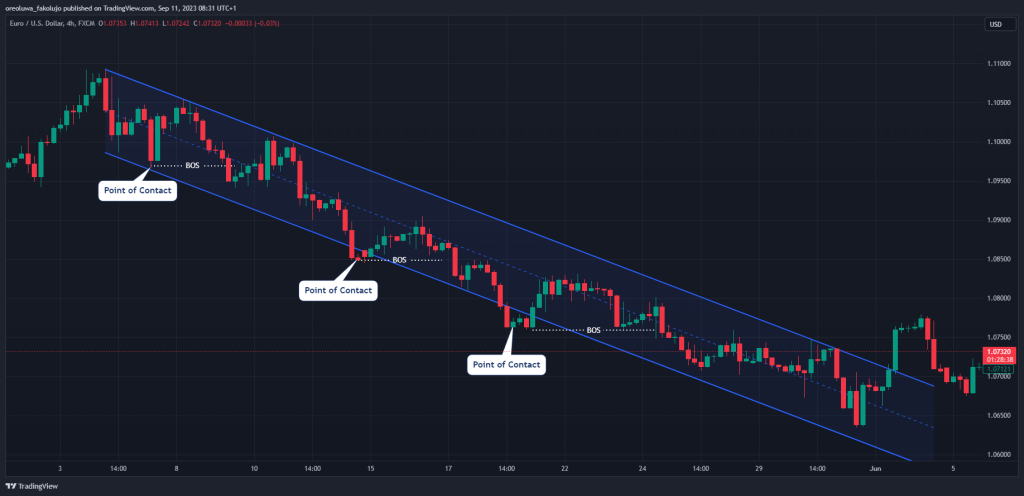
In a bullish market, you have a BOS if the price breaks above the most recent point of contact on the channel’s upper boundary. And if the price breaks below the most recent point of contact with the channel’s lower border, you have a break of structure.
The great thing about using trend channels to identify your break of structures is that they are great at filtering out smaller structures so that you can concentrate on the big picture in your timeframe.
Break of Structure Indicators
You can also use indicators to spot your break of structures. This is the easiest way. A perfect example of a break of structure indicator is the “MTF Break of Structure (BOS) & Market Structure Shift (MSS)” indicator on TradingView, which was developed by Lenny_Kiruthu.
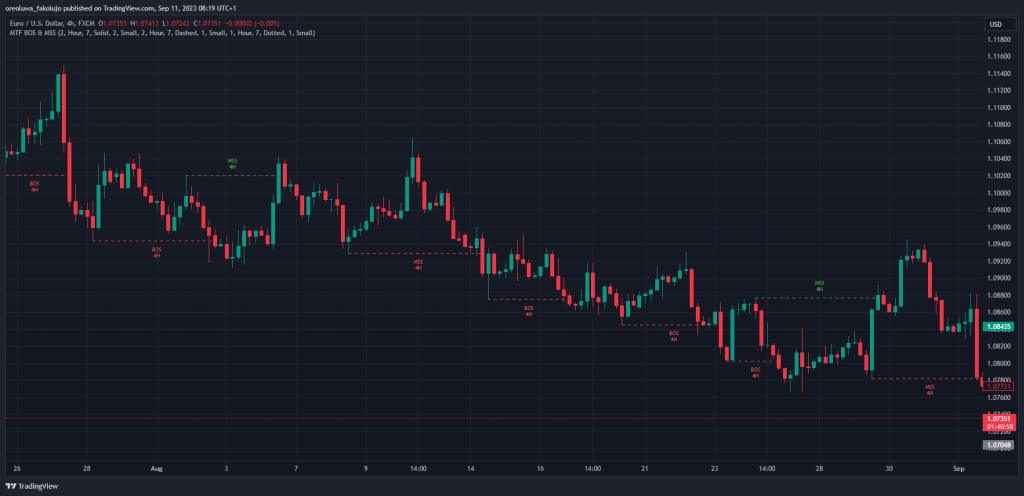
In addition, you can use other trend momentum indicators to identify the break of structure. Those include the Shcaff Trend Cycle indicator, the Stochastic RSI indicator, and the Detrended Price Oscillator indicator.
If you would like to see a video on how Break of Structure is used in trading, here’s one for you:
The Break Of Structure (BOS) Trading Strategy
As mentioned, the first thing you need to do is to identify your break of structure. Using any of the methods we described above, identifying your break of structure should be straightforward. Once you can do this, there are many trading strategies that you can trade based on the concept.
Here’s one:
1. Trade Setup
First, wait for the price to make a pullback after a broken structure. Such pullbacks offer trading opportunities to enter the market and ride the market structure break. You don’t take any kind of pullback, though. Instead, you only trade those that have pulled back by at least half of the most recent swing.
For a finer entry, try to identify these breaks of structure and their pullbacks on higher timeframe charts. This way, you can pick out your entry to a lower timeframe.
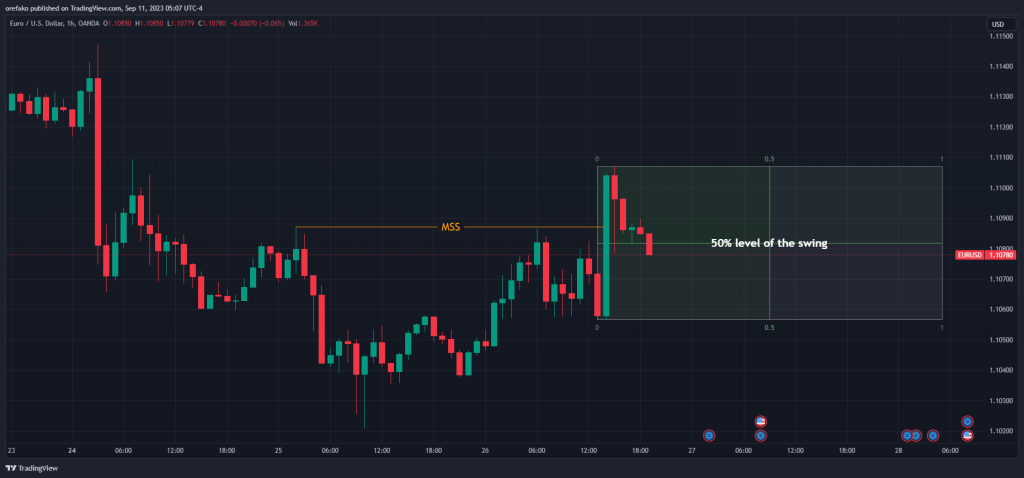
We have a market structure shift in the example of the EURUSD on the 1hr above. Price breaks structure to the upside, and we now have a pullback below the 50% level. Now, we can scout for entries.
2. Trade Entry
At this point, you should delve into a smaller timeframe. Identify any pattern that may suggest a reversal in the direction of your higher timeframe break of structure.
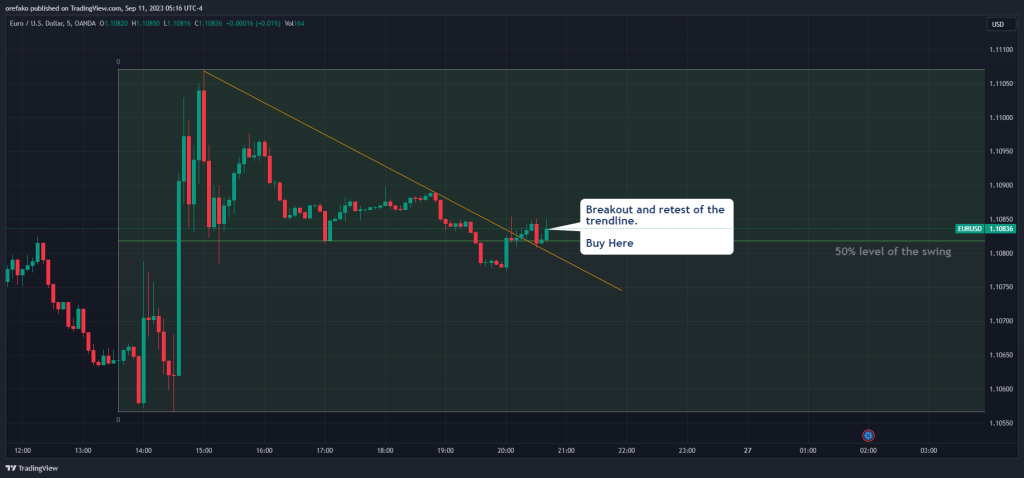
Following our example, we’re delving into the 5 mins chart. You’ll see that the price first embarks on a series of minor breaks of structure while forming a bearish trendline. The break of that trendline is a great trade entry spot.
3. Stop Loss
Your stop loss should always be beneath the most recent swing high or swing low on your smaller timeframe since that’s where you’re getting your entry.
4. Take Profit
Your first take profit target should be at the same level as the swing that led to your pullback on the higher timeframe. So, if you’re looking to take a bullish trade, your first TP should be at the same level as the swing high on the higher timeframe. And if you’re in a bearish trade, your target is the most recent swing low on the higher timeframe.

However, because we expect the newly formed structure to break, you could even set your take-profit targets above or beneath your swing high and swing low, respectively. Just don’t forget to use proper risk management.
The Free Break of Structure Trading Strategy PDF
If you need something you can easily refer to, you can download our free break of structure trading strategy PDF here:
Break of Structure Trading Strategy PDF
What are the Benefits and Limitations of Break of Structure?
When you use the break of structure in your trading, here are some benefits and limitations to be aware of:
Benefits
- BOS can help you identify potential trend continuations or reversals at an early stage.
- BOS can be used as a confirmation signal alongside other technical indicators and trading tools.
- BOS is a relatively simple concept to understand and identify on charts, making it accessible to traders of all experience levels.
- BOS can be applied to various markets and timeframes.
Limitations
- BOS can generate false signals, especially during periods of high volatility or market consolidation.
- BOS alone isn’t a foolproof indicator. It’s at its best when you combine it with other trading tools.
- By time a break of structure happens, you might be already too late to join the trend.
What’s the Difference Between a Liquidity Grab and a Break of Structure?
A liquidity grab differs from a break of structure in that it doesn’t often lead to a continuation of the current trend. Rather, what it does is that it reaches a higher high (in an uptrend) or lower low (in a downtrend), simply wicks past any of these levels, and reverses back into the structure. Usually, a liquidity grab may be a sign that the current trend is getting exhausted, and a reversal may be about to happen.
As you might already know, a break of structure goes past the previous high in an uptrend or the previous low in a downtrend with a full-body break, marking a potential continuation of the trend.
We have an entire article that discusses liquidity grabs, how to use it, and a lot more on how it differs from break of structure:
Bottom Line
Understanding market structure is very important in price action trading. It helps to tell when the market is trending upward, downward, or sideways. And this is where break of structure comes into play. It’s an important tool to master for any trader.
And don’t forget, it isn’t a break of structure yet until there’s a full-body break.
Frequently Asked Questions About Break of Structure in Trading
Here are answers to questions you may have about the Break of Structure in forex trading.
What is the Break of Structure entry?
Your break of structure entry is the one you take based on your break of structure trading strategy. This entry can be formed using any chart pattern or structure, including fair value gaps, premium and discount levels, order blocks, and supply and demand zones. Pretty much anything that can help identify the break of a market structure.
What is the Break of Structure indicator?
The break of structure indicator makes it easy to spot market structure breaks on the chart. Often, it does this by marking out areas of breaks of structure on the chart.
What is the Difference Between ChoCh and BOS in Trading?
Break of Structure (BOS) in trading refers to the break of the most recent swing high in an uptrend without first breaking the most recent swing low. Choch stands for Change of Character, and it occurs when a structure breaks in the opposite direction. So, a ChoCh on a bullish market trend would lead to a bearish reversal. Similarly, a change of character on a bearish market structure would lead to a bullish reversal.
Risk Disclosure: The information provided in this article is not intended to give financial advice, recommend investments, guarantee profits, or shield you from losses. Our content is only for informational purposes and to help you understand the risks and complexity of these markets by providing objective analysis. Before trading, carefully consider your experience, financial goals, and risk tolerance. Trading involves significant potential for financial loss and isn't suitable for everyone.