If you think the Moving Average is a powerful indicator, wait until you see the Moving Average Ribbon indicator. This Moving Average Ribbon indicator is a group of moving averages with different lengths/periods bound together like a ribbon would wrap a gift. And with this gift of moving averages, you can identify trends and spot trade entry and exit signals.
- The Moving Average Ribbon indicator is a band of multiple moving averages with varying periods on the same chart.
- There can be as few as 4 moving averages in the band and as many as the trader wants.
- Typically, the Moving Averages on the MA Ribbon are Simple Moving Averages. However, you can choose to mix things up with other moving average types, such as the exponential moving average and the weighted moving average.
This piece describes everything you need to know about using the Moving Average Ribbon indicator in your trades. We’ll show you how to use the indicator and trade with it.
- What is the Moving Average Ribbon Indicator?
- How to Setup the Moving Average Ribbon Indicator
- How to Use the Moving Average Ribbon Indicator in Trading
- Moving Average Ribbon Indicator Trading Strategy
- What are the Benefits and Limitations of the Moving Average Ribbon Indicator?
- Key Takeaways
- Frequently Asked Questions about Moving Average Ribbon Indicator
What is the Moving Average Ribbon Indicator
The Moving Average (MA) Ribbon is a band of moving averages with different periods plotted together as one indicator on the same chart. The idea behind this indicator is to help you do things you would normally be skeptical of doing with a single moving average.
Indeed, the MA Ribbon is a bit complicated to interpret and unaesthetic on a price chart. Yet, it is a trendy indicator primarily due to its accuracy in predicting market price movements.
For instance, you could be skeptical of using a single moving average line alone to take your trade entry, and this is understandable because it’s just one line. But with the MA Ribbon, you have many moving averages to help you confirm your trends. The price has to cross a good number of the component moving averages before you have confirmation for your trend. And this way, you can enter your trade with more confidence.
That’s, in a nutshell, what the MA Ribbon indicator is all about. It allows you to view a series of moving averages of different periods that are plotted on the same chart. Whenever you notice the price rises or falls below or above the MA Ribbons lines, you have a pretty strong signal to enter a trade.
How to Setup the Moving Average Ribbon Indicator on TradingView
The Moving Average Ribbon indicator is often made up of as few as four simple moving averages of different periods. Usually, these periods are different by the same multiple. So, you could have simple moving averages of 10, 15, 20, and so on. You may decide to use up to 10 or even more Moving Averages, though. No rule says you can’t.
Generally, the MA Ribbon that comes with the TradingView indicator only has 4 moving averages. But it gets better when you consider the option to tweak it. This indicator allows you to use any moving average of your liking, including weighted and exponential moving averages. It also allows you to change their periods to what suits you.
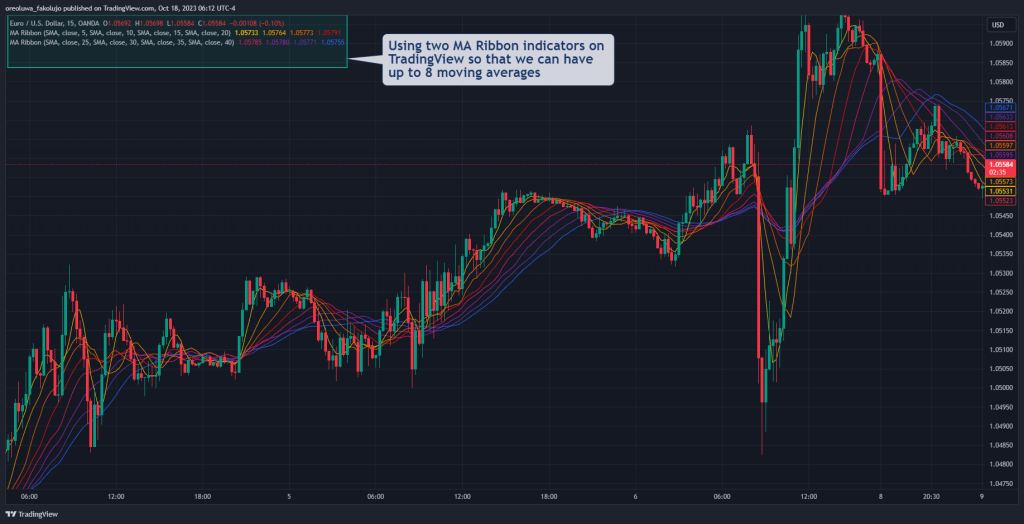
TradingView wouldn’t allow you to use more than three indicators at once without upgrading to a paid version. So, if you want to have more than the four moving averages that come with their MA Ribbon indicator, you might have to place more MA Ribbons on your chart. This way, you have up to 12 moving average bands on the free version.
How To Setup the Moving Average Ribbon Indicator on MT4
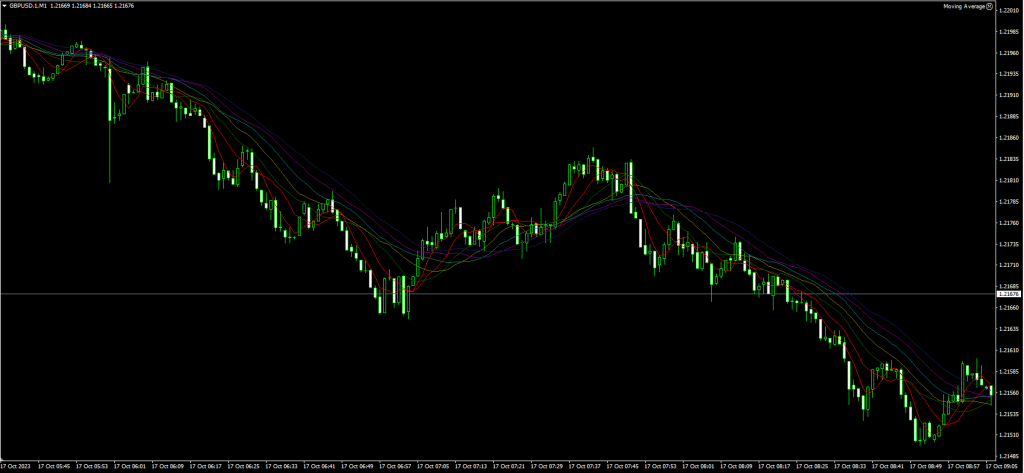
You can also make your own MA Ribbon indicator like we did above by simply slapping as many moving averages as you want on your chart. In fact, since the MA Ribbon doesn’t come custom-made with the Meta trader platforms, this is the best way to go.
Alternatively, you can also download a custom indicator and install it on your MT4/5 trading platform. To do that, simply search the Moving Average Ribbon indicator on one of the search engines online and follow the instructions in the above guide.
How To Use the Moving Average Ribbon Indicator
So, what can you do with this indicator? How do you use it?
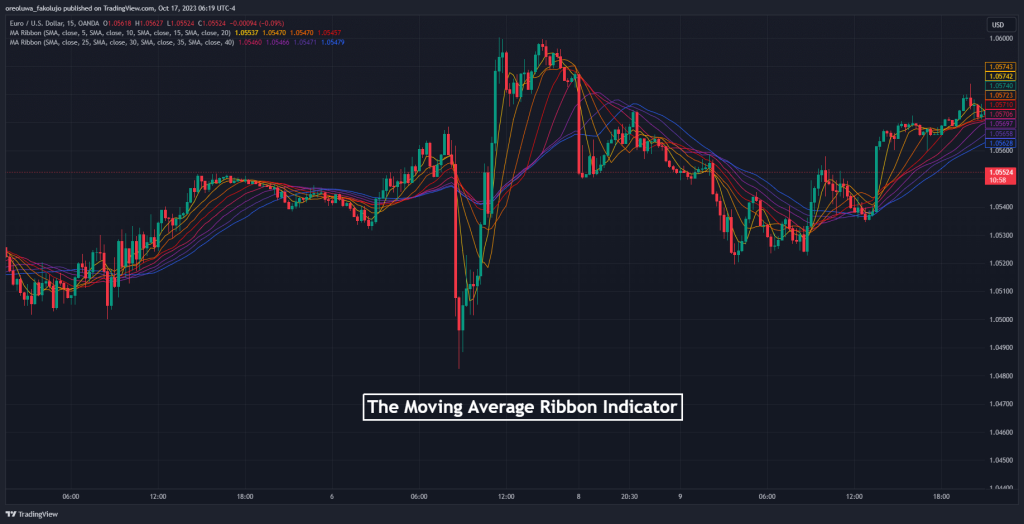
Primarily, you can identify strong trends with the indicator. Typically, you can say it’s a strong trend if the lines are evenly spaced while all the averages move in the same direction. But when we have an MA Ribbon contraction, the trend may be flat or growing too slowly. And finally, when the averages are expanding, it may mean that the current trend is nearing its end.
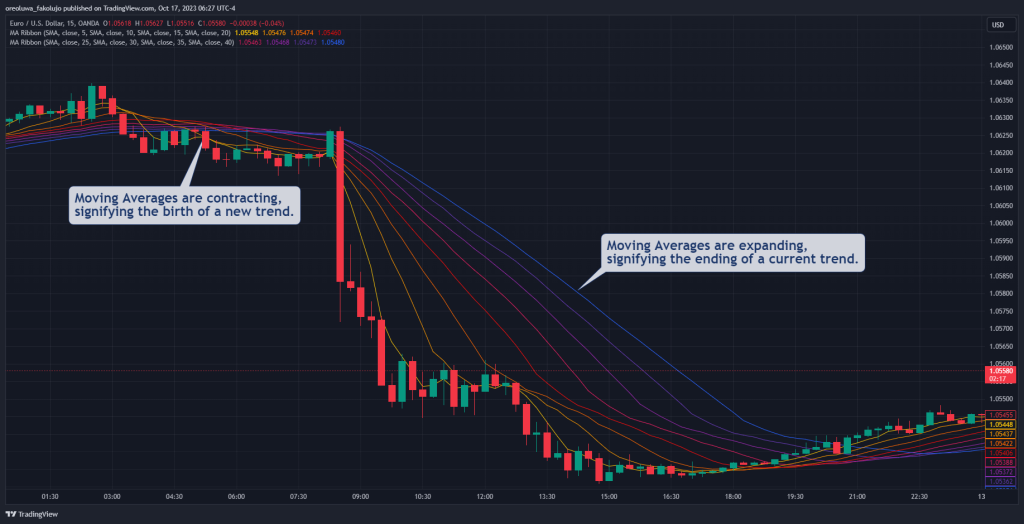
As seen in the EUR/USD chart above, when the MA Ribbon lines are expanding, the trend is likely to continue.
Another way to use the MA Ribbon is as dynamic support and resistance levels. For this, though, you may need to use larger periods for your moving averages so they don’t stick too close to each other.
Finally, you can use your MA Ribbon as a trade entry and exit tool. In this method, you look for a crossover between the price and MA Ribbon lines. This method works the same as the double-moving average crossover strategy. If the price rises above most of the moving averages from the downside up, you have a bullish signal. And for a bearish signal, you wait for the price to cross the moving averages from upside down.
Moving Average Ribbon Trading Strategy
The Moving Average Ribbon trading strategy we’ll be discussing here will be specific to the one that comes with the TradingView indicator and its default setting. But don’t panic if you use any other trading platform. You can easily replicate our concept with any other MA Ribbon indicator. Let’s see how the Moving Average Ribbon trading strategy works.
Trade Entries
First, pull up your MA Ribbon indicator on your TradingView chart. What you want to see is the price crossing above or below all the moving averages before you take your entry.
So, for bullish trades, wait for the price to close above the uppermost moving average line. And for bearish trades, wait for the price to close below the bottom-most moving average.
Let’s see an example of the EURUSD chart:
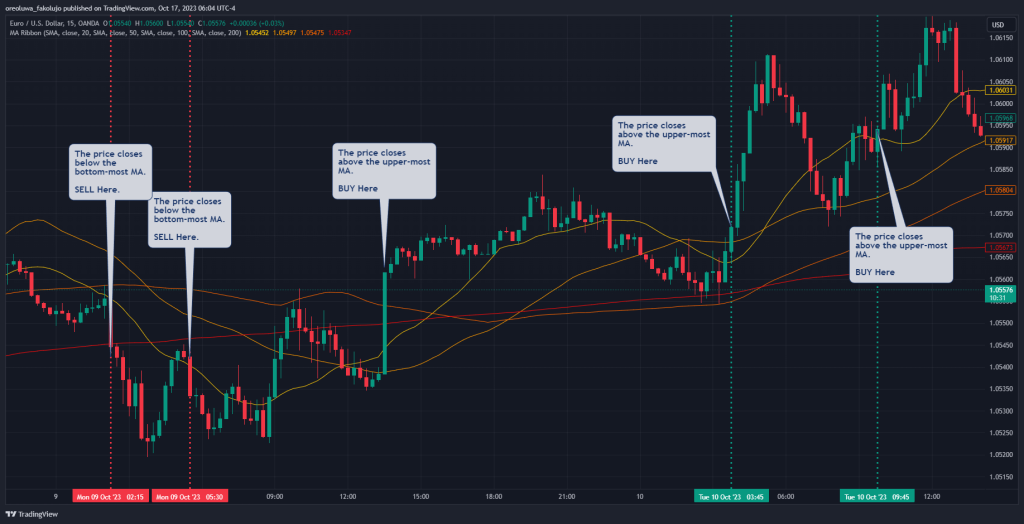
As you can see, every time the price shot out of the moving averages and closed above them, we took bullish trades. And whenever the price closed below the moving averages, we took bearish trades.
Another legitimate entry form is to take bullish trades when the shorter-term lines cross above the longer-term moving averages. Conversely, sell when the shorter-term lines cross below the longer-term lines.
Stop Loss and Take Profit
There are two places you can place your stop losses. The first place is above or below the most extreme moving average. So, in a bearish trade, your stop loss would be above the uppermost moving average. And in a bullish trade, your stop loss would be below the bottom-most moving average.
The second method is to place it above your most recent swing high in a bearish trade and below the most recent swing low in a bullish trade.
However, you can mix both methods by placing your stop loss at the closest level. If the moving average stop loss level is closer to your entry than the swing high/low, use that as your stop loss. But if the swing high/low stop loss is closer, use that.
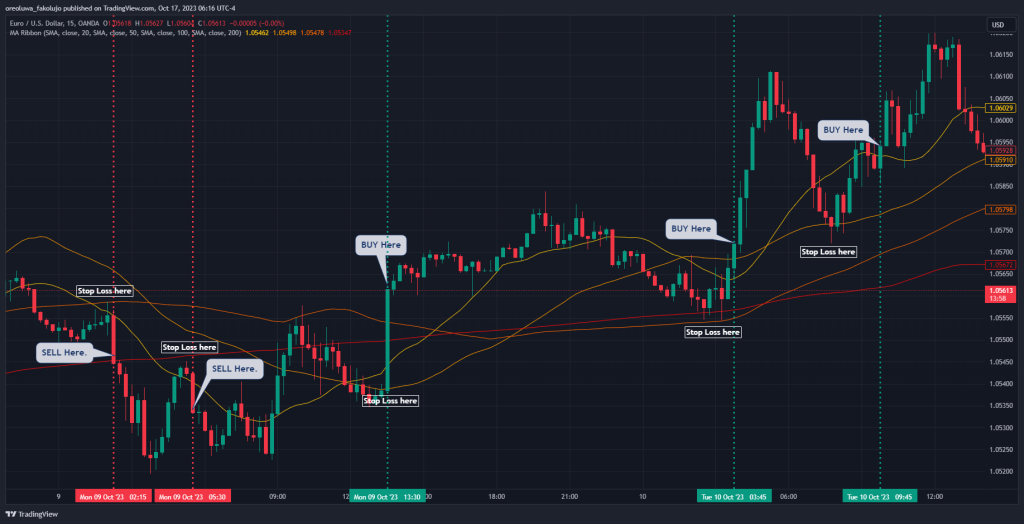
That’s exactly how we took our stop losses in the EURUSD example above. We used whichever stop loss level was closer to our entry.
And for your take profit, you can ride the trend until the price crosses the first moving average in the opposite direction. If you prefer a more disciplined approach, have a preset risk-to-reward ratio for all your trades.
What are the Benefits and Limitations of the Moving Average Ribbon Indicator?
The Moving Average Ribbon indicator is good at many things, but it still has some potential downsides. Let’s take a look at these pros and cons:
Benefits
Perhaps the ultimate benefit of the MA Ribbon indicator is that it is an excellent trend confirmation tool. It’s a huge upgrade to a single moving average in this aspect. Also, the versatility in how it can be used is another advantage. Finally, it also inherits the blessing common to all moving average indicators: ease of use.
Pros
- It’s a versatile tool for trend trading
- It’s a great trend confirmation tool
- Easy to use
Limitations
A moving average is always a lagging indicator, regardless of how you package it. And that is the first potential limitation of the MA Ribbon. What you get is a bunch of lagging indicators on your chart with this indicator. Also, the more isn’t always the merrier with this indicator. Too many, you may have issues spotting price actions.
So, those two are some of the potential downsides of the indicator.
Cons
- It’s a lagging indicator.
- Too many moving averages on the chart may reduce the visibility of price action..
Key Takeaways
- The Moving Average Ribbon indicator is a group of moving average indicators of varying periods.
- Whenever the price crosses above these moving averages to the upside and the MAs are sloped upwards, we have a bullish trend.
- And whenever the moving averages are sloped downwards and the price crosses over them to the downside, we have a bearish trend.
- The spaces among the moving averages are important. If the spaces are expanding, the trend might be approaching its end. If the spaces are constricting, the trend may be about to change. And if the spaces remain roughly the same during a trend, it means the trend is quite strong.
Frequently Asked Questions about the Moving Average Ribbon Indicator
Here are answers to some of the most frequently asked questions about the Moving Average Ribbon indicator
How do you use the Moving Average Ribbon indicator?
To use the Moving Average Ribbon indicator, you typically want to take bullish trades when the shorter-period moving averages cross the longer-period moving averages to the upside. Conversely, take bearish trades with the shorter moving averages crossing below the longer moving averages.
How do you analyze trends with moving average ribbons?
You can use the Moving Average Ribbon indicator to identify trends just as you would use a single moving average. The trend is bullish if the price is above the moving average lines, and the trend is bearish if the price is below the moving average lines. Also, if the moving average lines spread apart or expand, it signifies a potential impending reversal of the current trend. And if the moving average lines are constricting, you may be looking at the birth of a new trend. But if the lines are parallel, that signifies a strong, healthy trend.
What is the moving average ribbon strategy?
A simple Moving Average Ribbon strategy is to buy when the shortest moving average crosses over the longest moving average. Conversely, sell when the short-term MA crosses below the long-term MA.
Another method is to buy when the price closes above all the various moving average lines and sell when the price closes below them.
Risk Disclosure: The information provided in this article is not intended to give financial advice, recommend investments, guarantee profits, or shield you from losses. Our content is only for informational purposes and to help you understand the risks and complexity of these markets by providing objective analysis. Before trading, carefully consider your experience, financial goals, and risk tolerance. Trading involves significant potential for financial loss and isn't suitable for everyone.