- The Tick Volume indicator measures each trade’s size, regardless of whether it is an up or down trade, and the accompanying volume for a given time period.
- Using the Tick Volume indicator can help traders analyze market sentiments, sport reversals and breakouts, and crucial key support and resistance levels.
- The Tick Volume indicator is especcialy useful for intraday traders.
Trading with volume indicators gives us insights into why the price is moving in a certain way on the chart, and the tick volume indicator can help us trade in line with the overall market sentiment while avoiding some traps set by market makers.
So, what is a tick volume indicator, and how can we trade with it? This article will provide clear answers to these and some more questions. Let’s get started.
- What is the Tick Volume Indicator?
- How Does the Tick Volume Indicator Work?
- How Do You Calculate the Tick Volume in Trading?
- How to Use the Tick Volume Indicator in Trading?
- Tick Volume Indicator Trading Strategy
- What are the Benefits and Limitations of the Tick Volume Indicator
- What Information Can We Draw from the Volume Ticks Indicator?
- What is the Difference Between Tick Volume and Real Volume?
- Is Tick Volume Reliable?
- Key Takeaways
What is the Tick Volume Indicator?
The Tick Volume Indicator is a crucial tool in trading, particularly useful for understanding market sentiment. It measures each price movement, regardless of whether it is an up or down movement. This indicator is particularly important in futures trading since futures contracts move in tick size. It is often used to assess pivot points and is widely known as a great tool in futures trading to identify reversals and breakouts.
For traders, especially day traders or short-term swing traders, tick volume analysis is an invaluable tool. It aids in sizing up the market on an intraday basis.
How Does the Tick Volume Indicator Work?
Technically, the tick volume indicator tracks the number of price changes (ticks) within a selected timeframe. It represents these changes visually by creating bars on a chart, forming a wave-like structure. These bars are color-coded: green bars indicate a volume larger than the previous ones and indicate high volume, while red bars signify a decline in volume and are often characterized by low trading volume.
Here is an example of a Tick Volume Indicator on TradingView:
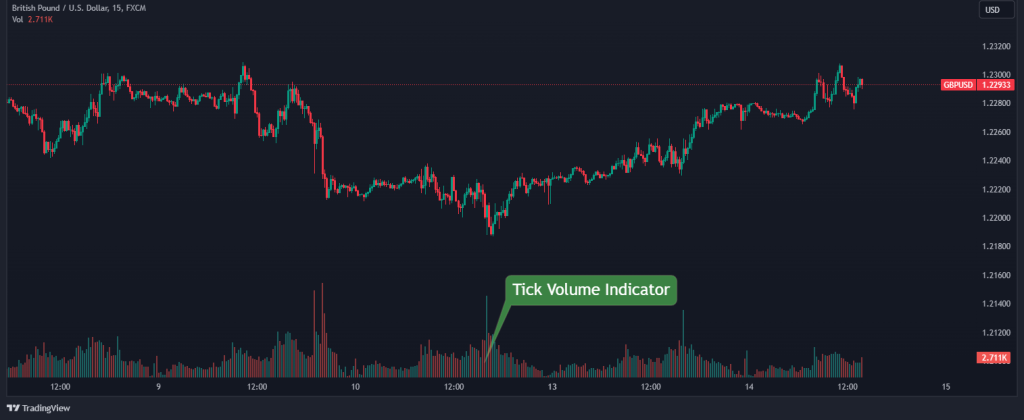
Furthermore, tick data can be categorized into two types: uptick and downtick. An uptick refers to a forex pair or any other instrument trade conducted at a higher price than the previous trade, while a downtick implies a trade at a lower price. This categorization helps in understanding the smallest upward or downward fluctuation in the price of a currency pair or the fluctuation in a security’s price from one trade to the next.
Additionally, the tick volume indicator is integral for platforms like the MetaTrader 4/5 (MT4/5) and TradingView, where it displays the volume of financial instruments. This can help retail traders determine areas of high volume when financial institutions enter the markets.
How Do You Calculate the Tick Volume in Trading?
Calculating the tick volume for your trading instrument is quite easy. Here’s how to go about it:
- Select a Timeframe: Determine the timeframe over which you want to calculate the tick volume (e.g., 1 minute, 5 minutes, etc.).
- Count Upward Ticks: For each price change where the current price is higher than the previous price, count it as an upward tick.
- Count Downward Ticks: For each price change where the current price is lower than the previous price, count it as a downward tick.
- Calculate Tick Volume: The tick volume indicator is typically displayed as a histogram or a line chart that plots the sum of the number of upward ticks and downward ticks for each period (candlestick).
While you can calculate this manually, especially on the lower tiemframe, there are many tick volume indicators out there that will make your work easier.
How to Use the Tick Volume Indicator in Trading?
A key aspect of using the tick volume indicator is that it usually does not require any installation from third-party platforms. For example. on platforms like MetaTrader, you can find the Tick Volume Indicator by navigating to “Insert”, then “Indicators”, and choosing “Volumes”. This indicator will display the number of price changes within each period of a selected timeframe, giving you a visual representation of volume movements. The process works the same on any other major trading platform.
Once the indicator is displayed on your platform, using the Tick Volume Indicator effectively in trading involves several key steps and strategies:
1. Analyzing Trend Strength
The Tick Volume indicator is particularly effective in evaluating the strength of a trend. To confirm an uptrend, you should look for the price moving higher with increasing volumes. In contrast, a sideways market is usually characterized by low and stagnant trading volume, which can then be used to utilize the range trading strategy. This correlation between volume and price movement is a strong indication of the trend’s robustness.
2. Spotting Reversals Early
The Tick Volume Indicator can be instrumental in identifying potential reversals at an early stage. A notable increase in volume can signal a strong reversal, indicating a possible change in trend. This can be crucial for traders who aim to capitalize on trend reversals.
3. Confirming Breakouts
During periods of consolidation, volumes are usually low. A significant increase in volume, coinciding with a price breakout from a range, typically suggests a genuine breakout rather than a false one. This is a valuable insight for those who utilize the breakout trading strategy or the ORB strategy, especially in volatile market conditions.
4. Identifying Support and Resistance Levels
High trading volumes in certain price areas can indicate strong levels of support or resistance. These areas become significant for traders to determine entry and exit points. Observing the volume spikes at these critical levels in trading can offer insights into market sentiment and potential price movements.
5. Interpreting Volume in Pullbacks
In a trade pullback scenario where the price temporarily retraces during an uptrend, volume indicators can help distinguish between a short-term correction and a real trend reversal. Lower volumes following a price change suggest a mere correction, whereas a price change accompanied by high volumes might indicate a shift to a downtrend.
6. Using as a Confirmation Tool
Finally, while the Tick Volume Indicator on platforms like MetaTrader is not an independent signal provider, it also serves as an excellent tool for confirmation. The dynamics of volume offer unique insights into the level of trading activity, which is not provided by other technical indicators. Incorporating this into your trading system, along with other technical indicators and chart patterns, can enhance decision-making and strategy formulation.
Tick Volume Indicator Trading Strategy
By now, you pretty much know what the tick volume is and how it works. What’s left? to trade the markets using this indicator.
So, one of the most popular trading strategies in the financial markets involves trading price breakouts. And volume indicators are particularly effective in identifying accurate breakouts. This is a strategy we want to show you here. Using the tick volume trading strategy, we can even take this strategy a step further, making it much more reliable. Here’s how to trade with the tick volume indicator:
In trading a breakout, the first thing we want to identify is either a range, a support and resistance level, or a key level. For this example, we will be using the round number key levels, as shown below.
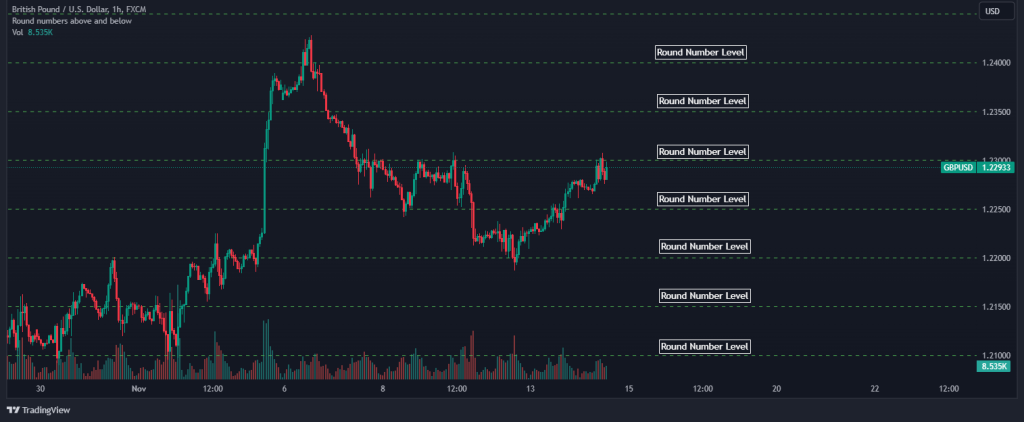
Now, we can expect the price to either bounce off or break out from these levels. Since we don’t know what price will be doing at these levels yet, we have to pay attention to the tick volume indicator. This can give us an indication as to who pushes the market – buyers or sellers.
We have explained earlier that a true breakout is identified when there is a sudden spike in the underlying tick volume when the price breaks a specific key level.
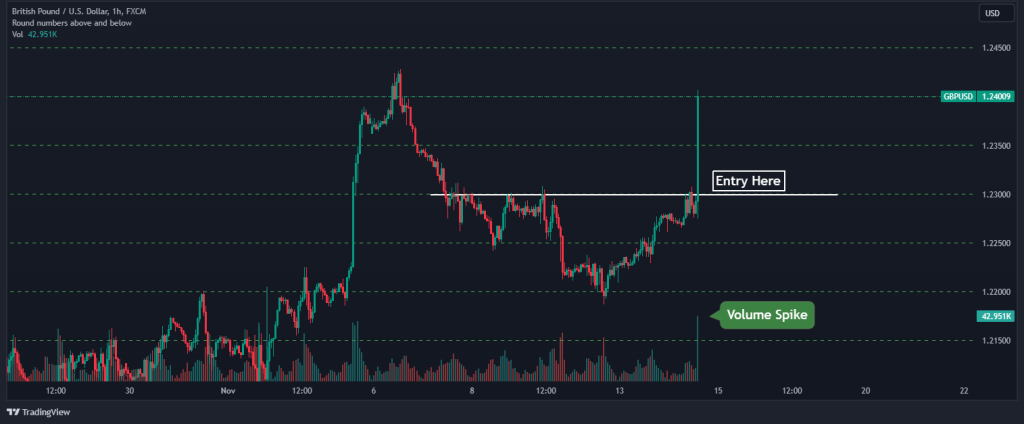
So, from the chart below, we can see that the tick volume confirms that this breakout is real. In that case, you can immediately enter a long buying position by relying solely on the tick volume indicator. Or, you can wait for a bullish candlestick pattern and open a long position.
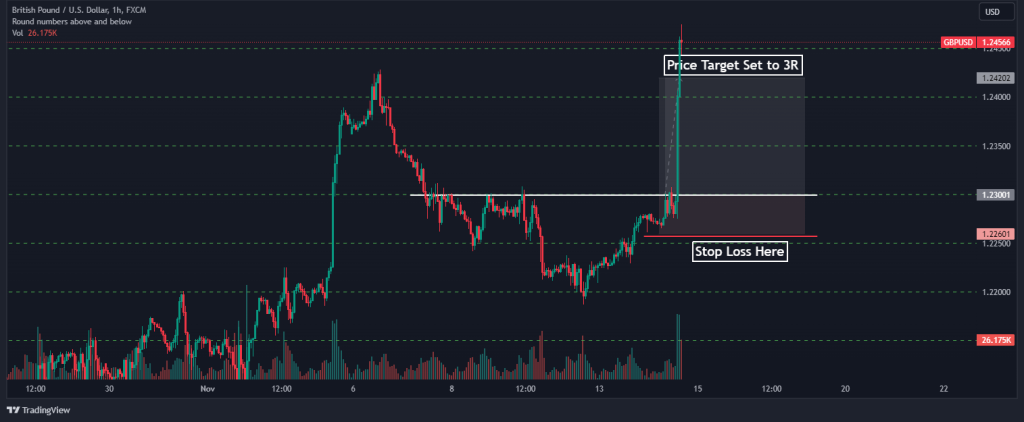
Finally, risk management is equally as important as trade execution. So, it’s advisable to have a mechanical approach toward setting our stop loss and target profit points. As seen in the chart above, the stop loss is placed some pips above the bullish candlestick pattern while we place our target profit at 3R.
What are the Benefits and Limitations of the Tick Volume Indicator
Just like every indicator, the tick volume has its pros and cons, and it is better to be aware of them so as to know when and how to apply them to your overall trading plan. Here are some of the most important ones:
Benefits of Using the Tick Volume Indicator
Like all indicators and technical analysis tools, the Tick Volume Indicator serves as a useful proxy for actual trading volume, which is often more available in the commodity and stock market rather than in the forex market.
Nonetheless, this indicator allows traders to gauge market sentiment and activity levels, providing insights into potential market movements. It is especially useful for traders who use the volume trading strategy when traders particularly aim to identify breakout levels or trading ranging markets.
Pros
- In markets like Forex, where actual volume data is scarce, tick volume acts as the best available substitute
- Helps in understanding whether the market is leaning towards buying or selling.
- Assists in determining optimal entry and exit points by highlighting areas of significant market activity.
- Offers insights into the smallest price movements, aiding in more precise intraday trading strategies.
Limitations of the Tick Volume Indicator
Despite its usefulness, the Tick Volume Indicator has certain limitations. One major drawback is its dependence on the broker’s data feed, which can vary, leading to inconsistencies in the tick volume figures provided by different online brokers. This can certainly affect the reliability of the indicator.
Other limitations of the tick volume indicator include:
Cons
- Data varies across brokers, affecting the consistency and reliability of tick volume data
- There is a significant difference between tick volume and actual volume, sometimes as high as 90%
- Not all markets provide reliable tick volume data, limiting its usefulness in some trading scenarios
- Risk of misinterpreting market movements due to reliance on tick volume alone
What Information Can We Draw from the Volume Ticks Indicator?
The Tick Volume Indicator helps in understanding market sentiment and the intensity of trading activity. It can indicate whether the market is leaning towards buying or selling, show the strength or weakness of a trend, and help in spotting potential reversals, breakouts, or periods of consolidation.
What is the Difference Between Tick Volume and Real Volume?
Tick volume counts the number of price changes in a security, irrespective of the volume of each trade, whereas real volume represents the total number of shares or contracts traded. Real volume shows the actual quantity traded, while tick volume gives an indication of trading activity and market dynamics, but not the specific trade sizes.
| Feature | Tick Volume | Real Volume |
|---|---|---|
| Data Source | Price changes | Exchange trade records |
| Availability | Decentralized markets (e.g., Forex) | Centralized markets (e.g., stocks, futures) |
| Accuracy | Proxy for activity | Exact amount traded |
| Units Counted | Number of price updates | Number of lots/contracts/shares |
Is Tick Volume Reliable?
Forex traders use tick volume because it is the easiest way to measure trading activity in a market that is traded over the counter and has no centralized exchange. And while it may not be as accurate as real volume, some studies suggest that tick volume still largely correlates with real volume in major forex pairs.
Key Takeaways
- The Tick Volume Indicator is essential for traders, especially in futures and Forex markets, as it measures each trade and the associated volume, irrespective of trade direction.
- It visually represents price changes (ticks) as color-coded bars on a chart, aiding in assessing market trends and volume changes.
- The indicator categorizes tick volume into upticks and downticks, offering insights into minor price fluctuations and market sentiment.
- For day traders and short-term swing traders, tick volume analysis is crucial for real-time market assessment and for strategies like confirming trend strength, spotting reversals, and validating breakouts.
Risk Disclosure: The information provided in this article is not intended to give financial advice, recommend investments, guarantee profits, or shield you from losses. Our content is only for informational purposes and to help you understand the risks and complexity of these markets by providing objective analysis. Before trading, carefully consider your experience, financial goals, and risk tolerance. Trading involves significant potential for financial loss and isn't suitable for everyone.