


The Volume Price Trend (VPT) is a technical analysis indicator that measures the relationship between price and volume in the market, providing insights into price trends and potential reversals. It can be used to confirm trends by aligning volume dynamics with price movements, detect divergence for hints of trend reversals, and generate trading signals through signal line crossovers.
- The Volume Price Trend (VPT) indicator measures the interplay between price and volume, illuminating price trends and reversals.
- It confirms trends by aligning volume dynamics with price movements and detects divergence for potential trend reversals.
- Signal line crossovers and volume spike analysis enhance its accuracy while combining the VPT with other indicators provides a comprehensive perspective for informed trading decisions.
In this guide, we are going to cover everything you need to know about the Volume Price Trend indicator, including how to use the indicator and implement the Volume Price Trend trading strategy.
What is the Volume Price Trend Indicator and How Does It Work?
First introduced by Joseph E. Granville, the Volume Price Trend (also called Price Volume Trend) indicator is a powerful hybrid that merges price and volume data. Its primary purpose? To provide traders with a comprehensive view of a security’s price direction and the strength behind the price change.

Generally, the Volume Price Trend indicator excels in one key aspect: determining the equilibrium between a security’s supply and demand. Thus, the indicator is often used by traders who utilize the supply and demand trading strategy, as well as for those who use the forex correlation technique to find trading opportunities.
It achieves this by analyzing the percentage change in a security’s price trend, which, in turn, reveals the relative supply and demand dynamics. The secret sauce lies in combining this price trend data with volume metrics, shedding light on the driving force behind the trend.
If you’re already familiar with the On-Balance-Volume (OBV) indicator, understanding the Volume Price Trend indicator won’t be a far stretch. Both indicators share common ground by measuring cumulative volume. Where they differ is in how they interpret this data. The VPT indicator goes further by dissecting volume to uncover a security’s money flow, adding a nuanced layer to the analysis.
The formula for the Volume Price Trend indicator is as follows:
VPT = Previous VPT + Volume x (Today’s Closing Price – Previous Closing Price) / Previous Closing Price
Here’s how it works: When the price trends upward, the formula multiplies the volume by the percentage increase between today’s closing price and the previous day’s closing price. This result is then added to the previous day’s VPT value.
Conversely, when the price drops, the formula multiplies the volume by the percentage decrease between today’s closing price and the previous day’s closing price. Again, the outcome is added to the previous day’s Price Volume Trend value.
Ultimately, the indicator works similarly to many other volume indicators. When it rises, it signals the trend is gaining momentum, and vice versa.
How to Use the Volume Price Trend Indicator (VPT) in Trading?
Mastering the Volume Price Trend indicator, like other technical trading tools, has its own set of cues that traders can capitalize on.
For instance, you’ll find different variations of the Volume Price Trend (or Price Volume Trend) indicators on TradingView. The original VPT indicator on TradingView only has one line, which is the VPT line. So, originally, you can’t trade crossovers with it unless you add another indicator, such as the moving average.
However, many traders know how restricting the Volume Price Trend indicator can be without a Moving Average, so they went ahead to develop their own versions of the VPT with a Moving Average. The VPT indicator below is a perfect example of that. It was developed by “Everget” on TradingView.
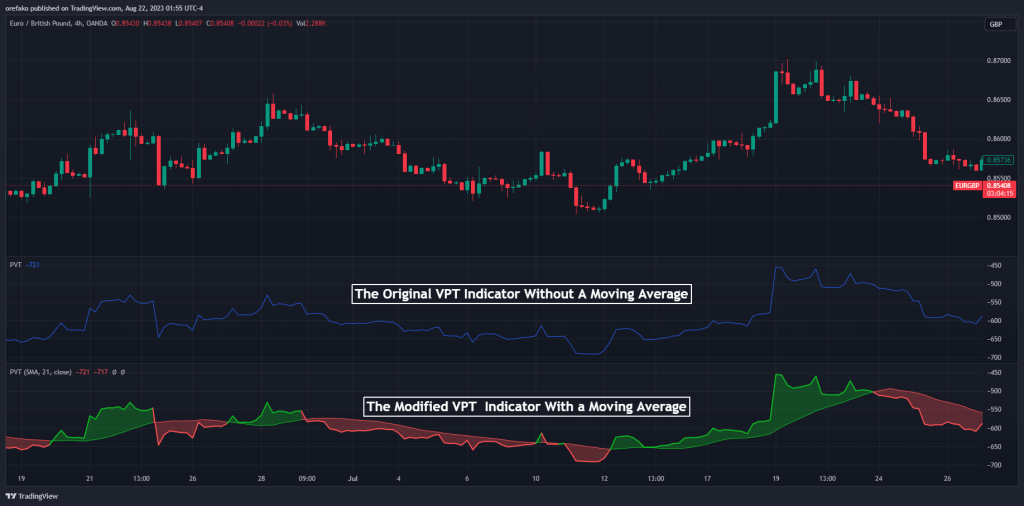
For the rest of that piece, we’ll use this modified VPT by “Everget.” Another reason we chose this modified indicator is that it allows you to switch from an EMA (Exponential Moving Average) to an SMA (Simple Moving Average) and also change their periods easily from the settings.
Volume Price Trend (VPT) Indicator Trading Strategy Tutorial
So, here’s how you would go about making trades with the VPT Indicator. Typically, upon trading the VPT indicator, you’ll be looking for signals coming from the VPT’s up and down-line movement.
However, because the VPT is an oscillator, it has the same blessing most other oscillators have: Divergence. And that’s what we’ll be using the VPT for here.
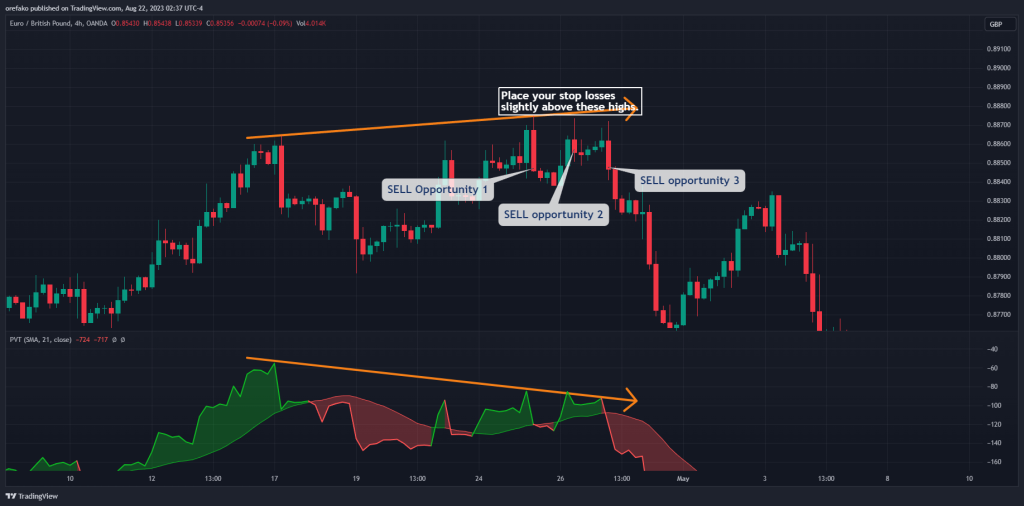
Trade Entry
Using the VPT Indicator to look for entries is straightforward. As mentioned, in this trading example, we are looking for divergence. For those unaware, divergence occurs when the indicator charts a higher high or a lower low, while the asset price in question paints a different picture—a lower high or a higher low. There are four different types of divergence, and this incongruence often hints at potential shifts in market sentiment.
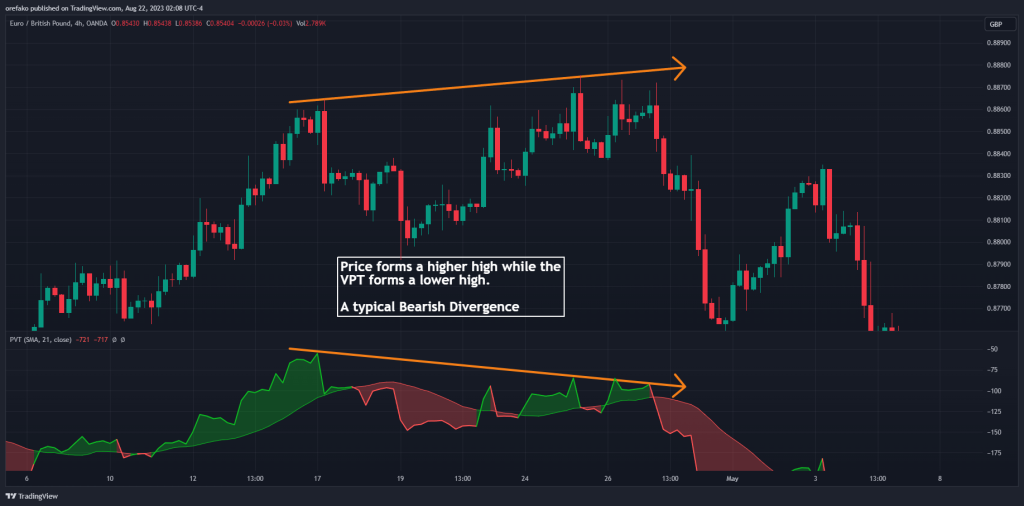
With the divergence, you should take your trade in the direction of the indicator. So, if your VPT forms a lower high while the price makes a higher high, just like in the chart above, you’re going to look for sell opportunities. It’s a bearish divergence.

However, if the indicator forms a higher low while the price forms a lower low, that’s a bullish divergence. In that case, you should look for buying opportunities.

Stop Loss
Setting your stop loss shouldn’t be complicated. For example, for a short-sell trade, simply place your stop loss above the last swing high.
Take Profit
Determine your take-profit level is primarily based on your risk-reward ratio. A common strategy is to set a target at least twice the distance of your stop-loss from your entry point. This ensures a favorable risk-reward balance.
Volume Price Trend Indicator (VPT) – Pros and Cons
When considering the adoption of any trading tool, it’s essential to weigh its strengths and weaknesses. The Volume Price Trend (VPT) indicator is no exception. Here are the benefits and limitations of using the VPT indicator in your trading:
Benefits of Using the VPT Indicator
The VPT indicator provides a unique perspective by measuring price and volume data. This dual insight empowers traders to make more informed decisions by understanding the correlation between market trends and trading volume.
By validating price trends with volume dynamics, the Price Volume Trend indicator offers a stronger confirmation of market trends, which can be especially valuable in helping traders avoid false signals and make more accurate predictions.
Pros
- Clear Insight into Price-Volume Relationship
- Enhanced Confirmation of trends
- Great at spotting potential reversals
- Can provide money flow insights
Limitations of the VPT Indicator
While the VPT indicator effectively confirms trends, it is not foolproof. Like any technical indicator, it can generate false signals during high market volatility or periods of erratic movements in price. Since the indicator relies on historical price and volume data, its effectiveness can be hindered in rapidly changing market conditions where historical data might not accurately reflect current dynamics.
Cons
- Not immune to false signals
- Overly dependent on historical data
- Potential lag
- Overemphasis on volume
Key Takeaways
- The Volume Price Trend (VPT) indicator combines price and volume data, offering traders a comprehensive view of market dynamics and trends.
- Combining the Volume Price Trend (VPT) indicator with the Moving Average creates a dynamic duo for traders. The Moving Average smooths price fluctuations, while the VPT indicator provides volume insights, enhancing trend identification.
- The VPT indicator confirms price trends through volume dynamics. An increase in VPT values during a Moving Average crossover bolsters the credibility of a bullish or bearish trend, allowing for more informed trading decisions.
- The VPT indicator comes with both benefits and limitations. On the positive side, it offers insights into price-volume relationships, enhances trend confirmation, and helps spot reversals. However, it can also generate false signals, exhibit lag, and be influenced by historical data and volume dynamics.
Frequently Asked Questions About Trading the Volume Price Trend Indicator
The following are some of the most frequently asked questions about the Volume Price Trend Indicator.
How do you use a VPT indicator?
If your VPT indicator already comes with a moving average, you can simply trade crossover signals. Buy when the VPT line crosses over the moving average to the upside and sell when the VPT crosses the moving average line to the downside.
If your indicator doesn’t come with the moving average, you can either get one that does or add it manually on your trading platform.
Another way to use the VPT is by trading divergences. It is also a common thing to combine the indicator with the Average Directional Index indicator or any other technical analysis tool.
Is VPT better than the OBV?
The Price Volume Trend and the On Balance Volume are very similar. The only difference is that the OBV measures cumulative volume based on whether there was a higher or lower close. The VPT, on the other hand, considers the percentage change as it measures cumulative volume.
So, while the VPT may give you a more in-depth view of the market, the OBV may give you quicker signals.
What does the Price Volume Trend indicator show?
The VPT shows a comprehensive view of a security’s price direction and the strength behind any price changes.
Related Articles
How to Use the Money Flow Index (MFI) Indicator – Trading Strategy and Tips
Volume-Weighted Average Price (VWAP) Indicator – Trading Strategy
Risk Disclosure: The information provided in this article is not intended to give financial advice, recommend investments, guarantee profits, or shield you from losses. Our content is only for informational purposes and to help you understand the risks and complexity of these markets by providing objective analysis. Before trading, carefully consider your experience, financial goals, and risk tolerance. Trading involves significant potential for financial loss and isn't suitable for everyone.


