


- Pivot points are computed using the previous trading day’s high, low, and close prices.
- The main pivot point (P) is calculated as the average of these values. Support levels (S1 and S2) are calculated below the pivot, while resistance levels (R1 and R2) are calculated above it.
- Pivot points come in various forms, including Standard, Woodie’s, Camarilla, Fibonacci, and DeMark’s pivot points.
- Since pivot points are commonly used by many traders for intraday trading, they become a valuable tool for identifying short-term price movements.
Pivot points are among the oldest techniques out there that have been used for centuries to predict future price movements. And often, old things are better than new.
So, in this article, we’ll introduce you to the pivot point trading strategy – a versatile system that can provide clarity and confidence in your trading journey. Traders widely use pivot points to identify key levels and potential market turning points.
What Are Pivot Points in Trading?
Pivot points are a technical analysis indicator traders use to determine overall market trends over different time frames. They are calculated using the previous trading day’s high, low, and close prices. Once calculated, these pivot points can serve as reference points for the entry and exit of trades. They are particularly popular among intraday traders due to their simplicity and the actionable insights they offer for quick decision-making.
Technically, calculating pivot points produces one main pivot point (the average of the previous day’s high, low, and close) and several other support and resistance levels. Traders use these levels to gauge potential turning points in the market. The standard method of calculation gives us one pivot point (P), two levels of support below the pivot (S1 and S2), and two levels of resistance above it (R1 and R2).
Traders interpret these points as markers of significant levels of price action. A move towards a pivot point may indicate a consolidation or a turn in the market sentiment, while a move away could suggest a strong trend in the direction of the breakout. If the price hovers around the main pivot point, it suggests a balance between buyers and sellers, reflecting market indecision or transition.
Pivot points are particularly useful because they can be applied to various time frames, from minutes to months, making them versatile for different trading strategies. In intraday trading, pivot points are recalculated daily, giving traders fresh insights each trading day. Moreover, the use of pivot points is not limited to forecasting market turns; they can also be instrumental in setting stop-loss orders or target prices.
The Herd Behaviour Phenomenon – Why Pivot Points Are So Important?
One reason why pivot points are so valuable in trading is herding behavior, which is a phenomenon where individuals are influenced by their peers to follow trends or mimic the trades of the majority. This behavior is predicated on the assumption that the collective wisdom of the masses could lead to profitable trading outcomes.
Pivot points are particularly significant when considering the impact of herd behavior on market movements. These levels gain prominence because many financial portals display pivot points on instrument pages. They are universally accessible, making them common knowledge among traders and often a focal point for trading activity. When many traders pay attention to these pivot points and base their trades around them, the likelihood of these levels acting as strong support or resistance zones increases.
Since traders on trading and Forex forums and trading communities frequently share and discuss these pivot levels, the consensus about these pivot points can drive market momentum as multiple traders place trades anticipating the market reacting at these levels. This creates a self-fulfilling prophecy as the actions of the herd ensure that the price often respects these pivot levels, whether bouncing off a support level or retreating from resistance.
Crucially, with many eyes watching these same pivot point levels, they become natural places for the concentration of entry orders, including stop-losses and take-profit instructions.
5 Main Types of Pivot Points
There are various types of pivot points, with each type being a variation of the standard pivot point calculation, adjusted to give different weight to certain market conditions and price levels.
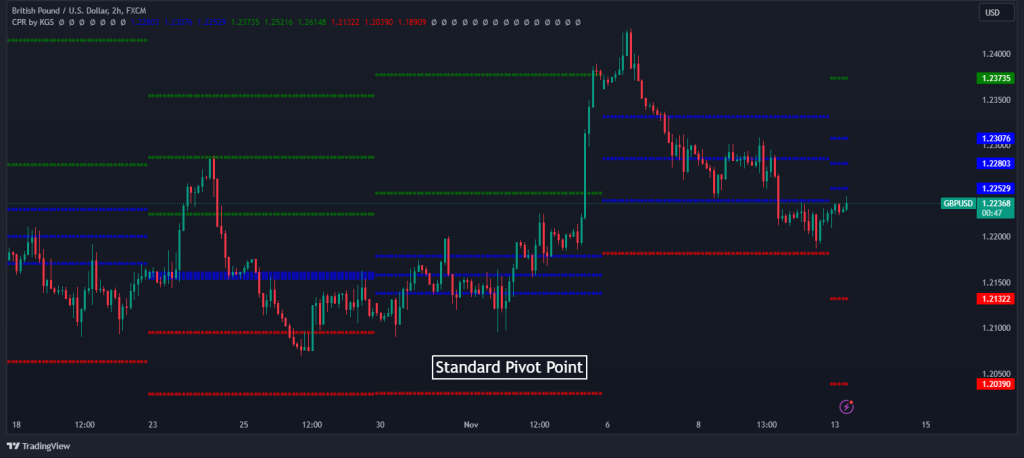
1. Standard Pivot Points
The Standard Pivot Point is the most basic and widely used. It is computed using the previous trading day’s high, low, and close. The calculation produces the pivot point (P), also known as the central pivot point, which serves as the base for three supports (S1, S2, S3) and three resistance levels (R1, R2, R3). This version gives an equal weighting to the high, low, and close of the previous day, reflecting a consensus price that can be considered a neutral market point for the upcoming session.
Best for: Traders looking for a balanced, widely accepted market indicator that reflects a consensus view.
Here’s how it looks on the chart:
2. Woodie’s Pivot Points
Woodie’s Pivot Points differ from the standard version by giving more weight to the closing price of the previous period. The formula for Woodie’s pivot adds the current period’s open price into the mix, therefore reflecting the current trading session’s sentiment from its outset. This pivot point type is popular among traders who believe the opening price holds more relevance because it reflects the trader’s reaction to the market before the session begins.
Best for: Traders who place significant importance on the opening price and wish to incorporate it into their analysis for a current market perspective.
See the Woodie’s Pivot Points below:

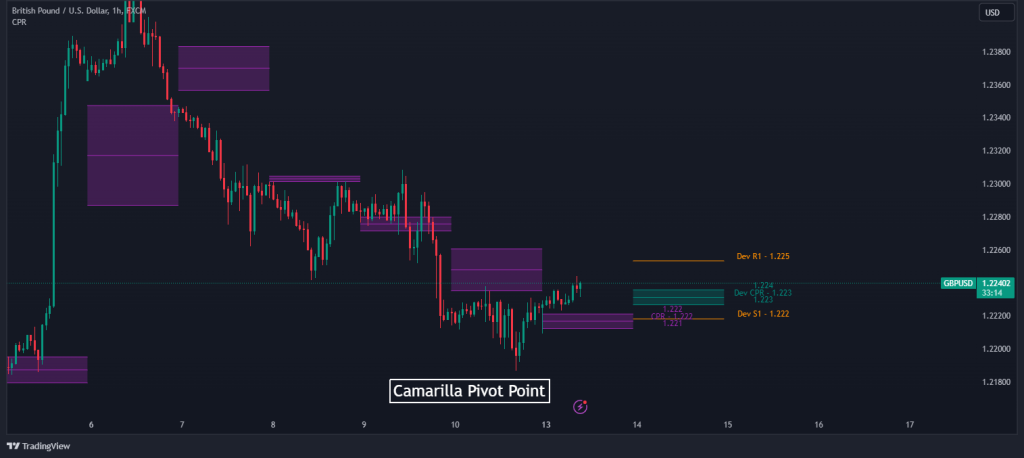
3. Camarilla Pivot Points
Camarilla Pivot Points are another variation that offers a unique approach by calculating four potential support and resistance levels, suggesting a more granular insight into intraday movements. These levels are calculated using the previous day’s high, low, and close but through a different formula that gives traders a series of much narrower potential trading ranges.
Camarilla pivots are often used for short-term trading strategies where the price is expected to move significantly within very tight ranges.
Best for: Short-term traders who operate on the premise of significant price movements within very tight ranges and require a granular level of detail.
Here’s what the Camarilla pivot points look like on the chart:
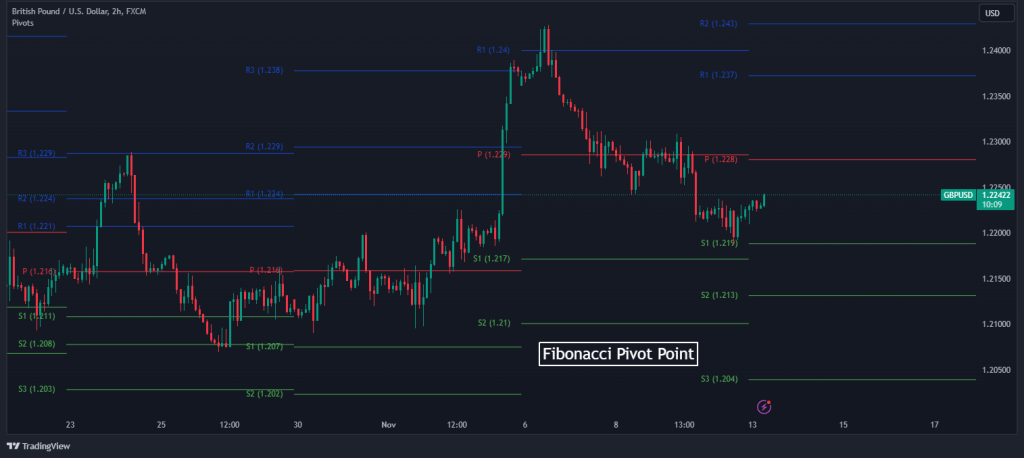
4. Fibonacci Pivot Points
The Fibonacci Pivot Points start with the same base calculation as the standard pivot point but then apply Fibonacci retracement levels to calculate the support and resistance levels. These pivot points blend the concept with Fibonacci numbers, a series of ratios derived from the Fibonacci sequence that some traders believe provides significant support and market resistance.
This method appeals to traders using Fibonacci retracement in their chart analysis, as it harmoniously aligns with their existing trading approach.
Best for: Traders who integrate Fibonacci retracement into their market analysis and seek alignment with these mathematical ratios.
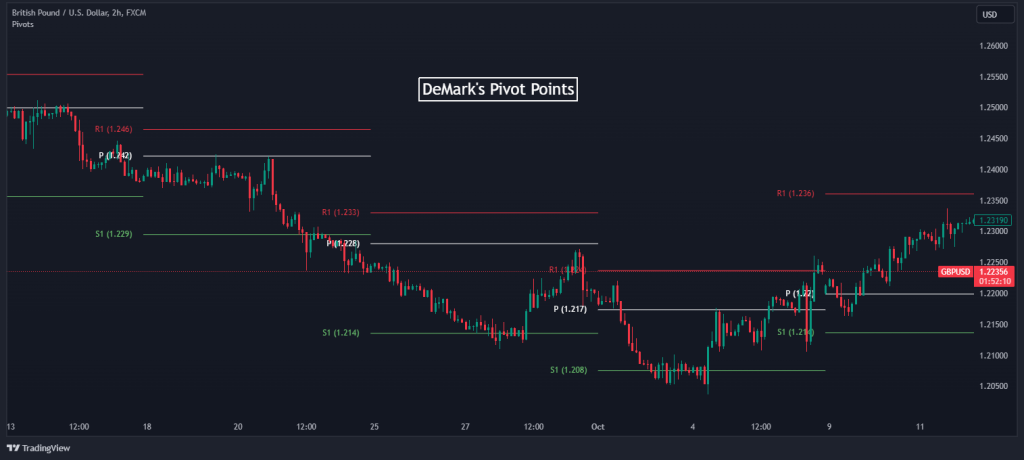
5. DeMark’s Pivot Points
DeMark’s Pivot Points are the creation of Tom DeMark and are intended to predict the next period’s high and low. DeMark’s formula uses the relationship between the close and opening of the previous period to forecast the support and resistance levels for the upcoming period.
Best for: Traders aiming to anticipate market turns and seeking an edge by predicting future market movements.
Summary Table of Pivot Point Types
Here’s the summary of these different types of pivot points at a glance.
| Pivot Point Type | Formula Basis | Best For |
| Standard | High, Low, Close of the previous day | Balanced market view |
| Woodie’s | Previous close and current open | Emphasis on opening price |
| Camarilla | High, Low, Close of the previous day with a unique formula | Short-term, tight range trading |
| Fibonacci | Standard calculation with Fibonacci levels | Fibonacci-based trading strategies |
| DeMark’s | Close and open relationship of previous period | Predictive, anticipatory market analysis |
Bear in mind that each of these pivot point types serves a different trading philosophy and strategy. The choice of pivot point can depend on the trader’s experience, the market being traded, or the prevalent market conditions. Some may find one type more effective in trending markets, while others may find another type works better in range-bound markets. The choice also depends on the trader’s familiarity with each method and their overall trading strategy.
In integrating these pivot points into an intraday trading strategy, it is important to remember that no single type consistently outperforms the others. Instead, the value of a pivot point is determined by its relevance to the current market conditions and its interplay with other market indicators.
Pivot points are particularly significant when considering the impact of herd behavior on market movements. These levels gain prominence because many financial portals display pivot points on instrument pages.
Pivot Point Trading Strategies
Generally, there is more than one way to use the pivot point technical analysis indicator. Like many other indicators, it depends on the market’s condition and the trader’s interpretation of the market.
With that said, there are some popular and well-known pivot point trading strategies that you must be aware of. Those include:
- The pivot point breakout trading strategy
- The pivot point reversal strategy
- The Pivot points support and resistance trading strategy
- The Pivot point trend strategy
Each of the above strategies relies on the same principles of identifying key levels using the pivot point indicator. Whether it is done directly with the indicator on a price chart or by using pivot point data on various financial portals and forums – the idea is to use these levels to enter and exit positions.
How to Trade with Pivot Points
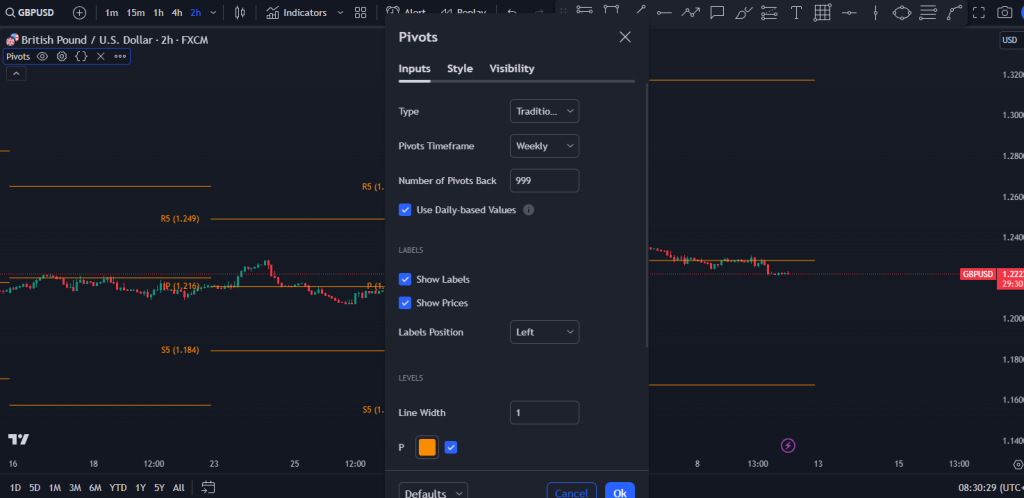
Now, let’s consider a practical use case for trading the GBP/USD currency pair in a 2-hour timeframe. In this example, we’ll use the “Pivot Points Standard” indicator on the trading view platform.
Take note that there are many ways to use pivot points, including trading reversals, breakouts, and the range trading strategy; however, we will show you a fairly basic method to use the pivot point indicator to identify key levels in trading.
So, to make the strategy as simple as possible, we will remove all the R1 to R5 and also S1 to S5, leaving our focus on the pivot points itself. The rest of the settings are shown in the image below:
Now that we are done with the settings let’s see how to use this to enter a position. The chart below shows that the GBP/USD market is trending to the downside. In this case, we are expecting the pivot points to act as resistance levels, pushing the price down. That means that after the price retraces to the pivot point, we can open a sell position.
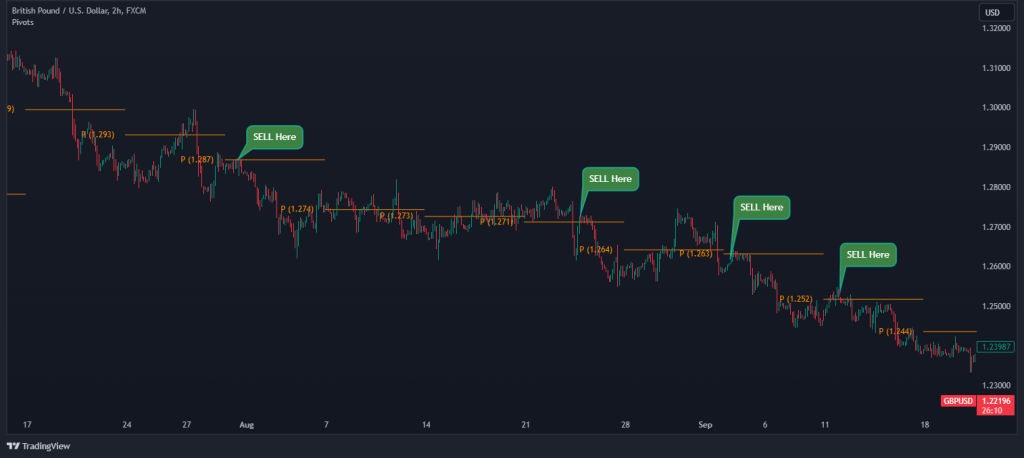
The opposite is also true if we are in an uptrend or any other market scenario. In any case, where we use the pivot point indicator, we can use the generated levels to find entry levels.
Setting our stop loss and profit target points is a little bit discretionary. Some traders prefer to put the stop loss below the last swing low in an uptrend while targeting the R1. However, we advise setting your profit target at twice your risk level.
Do Pivot Points Really Work?
In sum, pivot points are a mainstay in the trading world. They work by distilling the previous day’s trading data into actionable insights that, when used judiciously, can guide traders to make more informed decisions.
The reliability of pivot points is supported by the fact that price movements often respect these calculated levels, as they represent significant price points based on past performance.
But most importantly, the real effectiveness of pivot points comes from their widespread recognition and use, which creates self-fulfilling prophecies as traders worldwide watch and react to these levels.
Pivot Point Trading Strategy FAQs
Here are some popular questions on pivot points trading strategy.
What is the correct way to trade with pivot points?
The correct way to trade with pivot points involves using these calculated levels as potential support and resistance areas. Traders typically enter a long or short position when the price of an asset hits a pivot point level and shows signs of reversing, suggesting it has found support or resistance. This way, traders typically utilize the pivot point bounce strategy.
Which type of Pivot Points is best to use?
The choice of pivot points depends on a trader’s specific style and the market being traded. The Standard pivot points are popular for their simplicity and broad application. At the same time, Woodie’s and Camarilla are favored by some for their emphasis on the opening price and intra-day precision, respectively. Fibonacci pivot points are preferred by traders who incorporate Fibonacci levels into their trading system, and DeMark’s are selected for their predictive qualities.
Where can I find pivot points for various instruments?
Pivot points for various instruments can be found on financial data and trading websites such as Investing.com and Barchart.com. These portals typically provide pivot point calculations in their technical analysis sections. They can be an essential resource for intraday traders applying this strategy across different markets.
What are the disadvantages of using pivot points?
One disadvantage of using pivot points is that they are based on past data and assume that historical price movements will influence future price action, which is not always the case. Markets can be unpredictable, and pivot points may not always predict turning points accurately. Additionally, the effectiveness of pivot points can diminish in markets with lower liquidity or when significant news events cause unexpected volatility. Moreover, as pivot points are widely known and used, they may attract considerable market attention, leading to crowded trades at these levels.
Risk Disclosure: The information provided in this article is not intended to give financial advice, recommend investments, guarantee profits, or shield you from losses. Our content is only for informational purposes and to help you understand the risks and complexity of these markets by providing objective analysis. Before trading, carefully consider your experience, financial goals, and risk tolerance. Trading involves significant potential for financial loss and isn't suitable for everyone.


