- The Fibonacci Golden Zone is a key area in price charts that signals potential stabilization or reversal points after significant market movements, with the 61.8% and 50% levels forming the crucial Golden Zone.
- It is also used for setting target prices and stop-loss orders, making it a multi-purpose tool in trading.
- For best results, traders seek additional confirmation from other technical indicators or patterns before making trades based on the Golden Zone, enhancing its reliability.
If you are a fan of our blog, you’ll notice that we’ve written a lot about the Fibonacci tools, from the Fibonacci retracement tool to the Fibonacci time zone and much more. If you ask us why, it’s simply because they work!
This guide will also discuss using the Fibonacci Golden Zone to find high-probability trade setups. Here’s what we will explore:
- The significance of the Golden Zone in trading.
- How to accurately draw the Fibonacci Golden Zone.
- How to use the Fibonacci Golden Zone to find trade opportunities.
- An example of the Fibonacci Golden Zone strategy in real-time.
What is the Fibonacci Golden Zone?
The Fibonacci Golden Zone specifically refers to a key area on a price chart calculated using Fibonacci ratios – primarily the 61.8% and 50% levels. These Fibonacci lines are obtained from the Fibonacci sequence developed by Leonardo Fibonacci and are considered crucial key levels by traders. The 61.8% level, often called the “Golden Ratio,” is particularly significant.
Here is what the zone looks like on the chart:
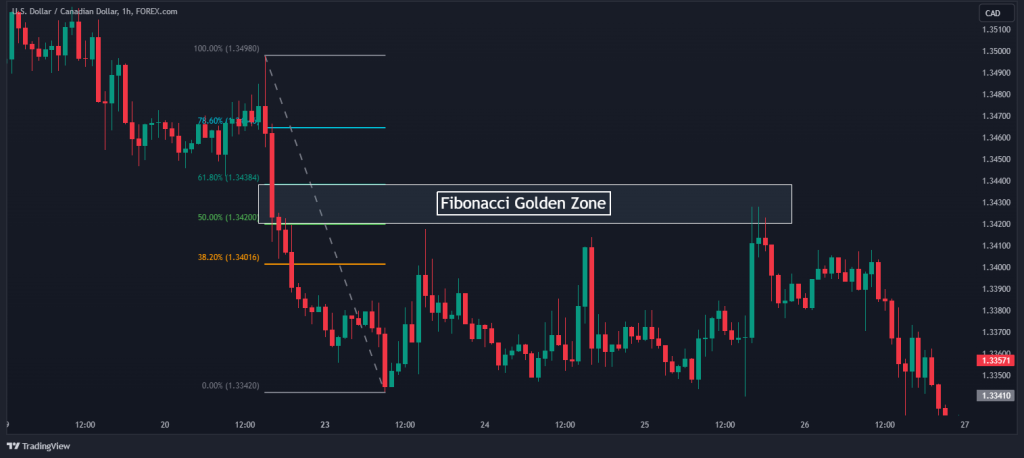
When the market price retraces to this zone after a significant movement, either upward or downward, it indicates a potential area where the price might stabilize or reverse. This retracement level is seen by traders as a prime zone for making trading decisions, underpinning its importance in technical analysis.
Beyond pinpointing possible reversal points, the Fibonacci Golden Zone is instrumental in setting target prices and stop-loss orders. This multifaceted utility makes it an indispensable tool for traders. A comprehensive understanding of the Fibonacci Golden Zone is essential for traders seeking to exploit these patterns to identify high-probability trading opportunities across diverse financial markets, including forex, commodities, and stocks.
How to Set Up the Fibonacci Golden Zone
Understanding how to draw Fibonacci retracement levels to uncover potential trade opportunities accurately is a must for traders. This process is both an art and a science, demanding a blend of technical skill and market insight.
- Choose your swing points: Selecting the proper set of high and low points on the price chart is crucial. The choice of these points, often corresponding to significant market highs and lows, forms the basis of your Fibonacci analysis. If you would like to learn the basics of using this tool, we suggest you visit our course on Fibonacci support and resistance levels.
- Use the Fibonacci Retracement tool: Once your points are identified, the next step involves drawing the Fibonacci retracement levels. This is done using a Fibonacci retracement tool available in most charting software, including MT4, MT5, and TradingView. The tool automatically calculates and displays the key Fibonacci levels between the chosen high and low points. Among these levels, as previously discussed, the 61.8% and 50% levels make up the Fibonacci Golden Zone indicator.
How to Use the Fibonacci Golden Zone in Your Trading
Traders watch the Fibonacci Golden zone closely, as it often acts as a strong support or resistance area, signaling potential price reversals. Prices are not uncommon to rebound or pull back upon reaching these levels, making them critical for traders looking to enter or exit positions and utilize the pullback trading strategy.
In practical trading scenarios, traders look for additional confirmation signals before executing trades once the Fibonacci retracement is drawn and the Golden Zone is identified. These signals can come from other technical indicators and candlestick formations. For instance, if a candlestick pattern suggests a reversal at the 61.8% retracement level, it adds credibility to the potential for a price turnaround, thereby creating a trade opportunity.
The use of the Fibonacci Golden Zone extends beyond just pinpointing entry points. It’s equally valuable in setting target prices and stop-loss orders. For example, suppose a trader enters a long position near the 61.8% retracement level. In that case, they might set a target price at a previous high (before the retracement began) and a stop-loss order below the 78.6% retracement level to manage risk.
It’s important to remember that the Fibonacci Golden Zone is not a standalone tool. The best results often come from using it with other technical analysis tools and understanding the broader market context.
The Fibonacci Golden Zone Trading Strategy
So, let’s put everything we’ve been discussing to practice on the USD/CAD hourly time frame. We will use the Fibonacci golden zone with candlestick pattern confirmation for this strategy.
Before we dive into it, here’s a disclaimer: trading the Fibonacci golden zone with limited orders can make you susceptible to “stop hunting.” To avoid this, we will use market execution.
To start, we first want to determine our overall trend and mark out the Fibonacci golden zone using the Fibonacci indicator. To do that, you must identify the swing high and low of the existing trend. We’ll use the USDCAD hourly chart as an example for the rest of this section.
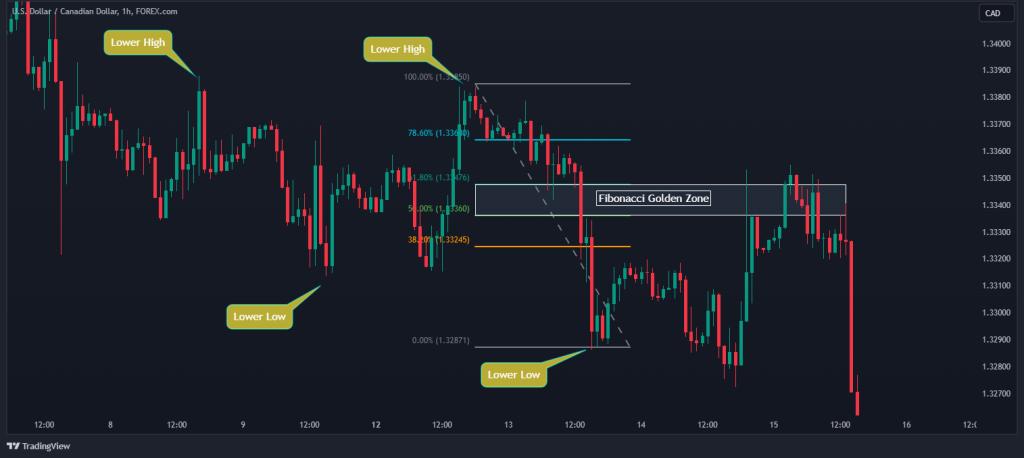
From the USDCAD chart above, you can see that we are in a downtrend, and we can expect the price to pull back to the Fibonacci golden zone and enter a short-sell position.
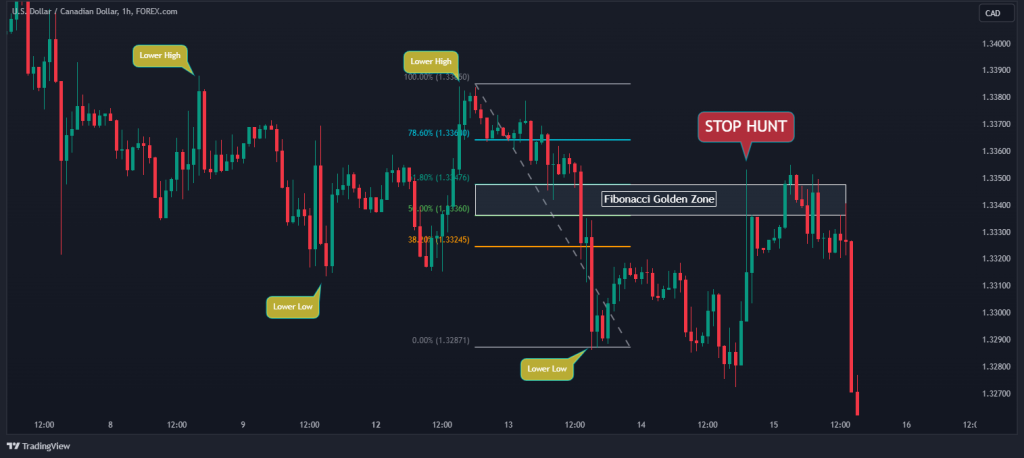
However, you can also see from the chart above that we would have lost money if we had immediately placed a limit below the zone with a stop loss just above the zone. This is why we need to use candlestick patterns for confirmation.
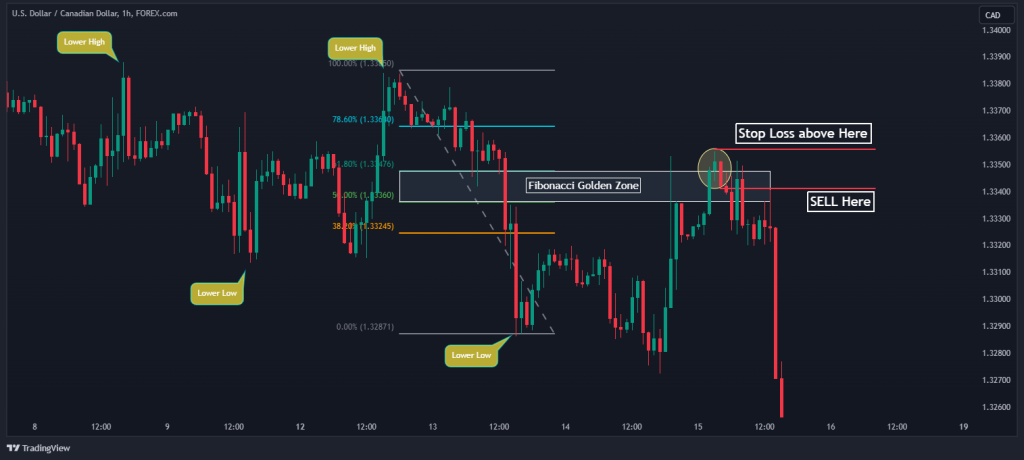
So, considering we have a bearish engulfing candlestick pattern confirmation, where the second candle essentially engulfs the previous one, we can then enter a sell trade and set our stops above the swing high.
Now, how do we set our profit target? There are many ways. For instance, you can target the swing low. However, since the break of the Fibonacci Golden Zone is significant, we will use the Fibonacci retracement level -61.8% (minus 61.8%) as our profit target for this example.
Here’s what it looks like on the chart:
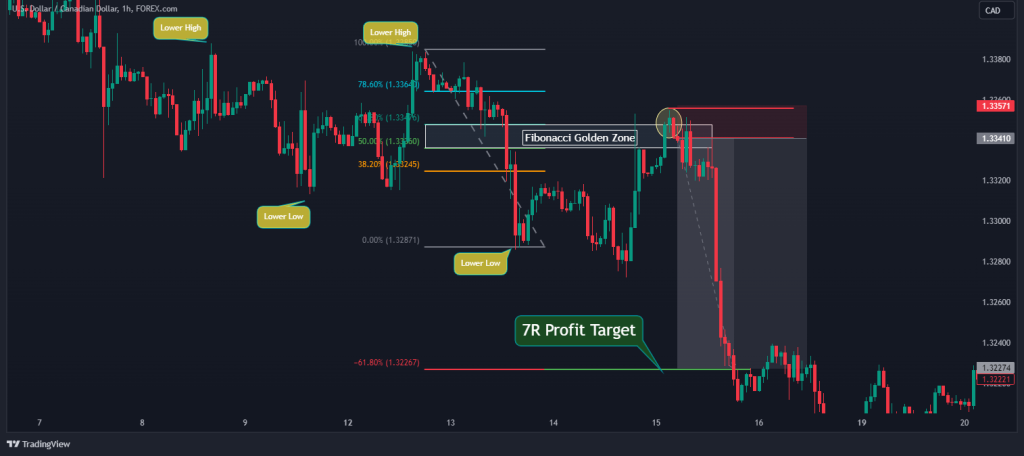
As you can see, using this profit target helps us use the golden ratio to its fullest and gives us the best risk-reward ratio.
That is, in a nutshell, how you should use the Fibonacci Golden Zone trading strategy. As shown in the above example, you can see how we interpret the Fibonacci Golden Zone as a critical price level for a price reversal or continuation. Regardless, this is a price level where many traders place their orders to enter and exit trades.
Do you still need extra help understanding Fibonacci Golden Zone trading? Here’s a video for you:
Does the Fibonacci Golden Zone Work in Trading?
Here’s the thing about using the Fibonacci Golden Zone in your trading plan: they work. This powerful tool, steeped in mathematical precision and market psychology, offers you a unique lens to view price action movements. Whether you’re setting target prices, managing stop-loss orders, or seeking confirmation for your trades, the Golden Zone serves as a multipurpose, dynamically.
By now, you’ve seen the power of the Golden Zone in action – its ability to transform complex market movements into clear and actionable insights. Further, integrating it with other technical analysis tools can significantly enhance your trading accuracy.
As previously mentioned in this guide, it’s not a secret that we at HowToTrade are huge fans of Fibonacci support and resistance levels. Since these magical levels are often viewed by many market participants on charting platforms and third-party websites, they become crucial zones. And the Fibonacci Golden Zone is certainly an important area and a great tool that must be used to find reliable trade opportunities.
Risk Disclosure: The information provided in this article is not intended to give financial advice, recommend investments, guarantee profits, or shield you from losses. Our content is only for informational purposes and to help you understand the risks and complexity of these markets by providing objective analysis. Before trading, carefully consider your experience, financial goals, and risk tolerance. Trading involves significant potential for financial loss and isn't suitable for everyone.