- Fractal in trading is used to identify potential reversal points in the market.
- Traders can naturally identify the Fractal pattern on price charts or use the built-in Fractal trading indicator.
- The fractal pattern is made of a series of five candles, with the middle candle having the lowest low or high (for bullish or bearish). The first two and last two candles should have higher lows/highs than the middle candle.
Fractal trading is a common concept among technical price action traders in the financial markets. However, depending on who you ask, they might have different, unrelated interpretations of fractals in trading, and they’re likely right. One fractal is used to spot trend reversals in trading, while the other is used to refer to when trading concepts are repetitive on the charts, regardless of the timeframe.
In this piece, we’ll talk about the Reversal Pattern Fractal Trading. We’ll define it, show you how to spot it on your chart, and also give you insights into how to trade it.
- What is Fractal in Trading?
- What Do Fractals Tell Us?
- How To Identify Fractals on the Chart
- How to Use Fractals in Trading
- What are the Benefits and Limitations of Fractal Trading?
- Can Fractals Be Used for Short-Term and Long-Term Trading?
- How Can I Determine the Validity of a Fractal Pattern?
- Does Fractal Trading Actually Work?
- Conclusion
What is Fractal in Trading?
The Williams fractal is a technical analysis reversal pattern that involves a minimum of five candlesticks. When a bearish fractal pattern appears during an uptrend, for instance, chances are that the uptrend is about to shift to a downtrend. On the other hand, when a bullish fractal occurs at the downtrend, it may spell a shift out of the downtrend.
Fractals in trading were popularized by Bill Williams, a renowned trader and author of “Trading Chaos.” Williams introduced the concept of fractal analysis as part of his broader trading system, which also included other elements like the Alligator Indicator and the Awesome Oscillator.
One of the key insights from Williams’ work is that fractals can help traders identify potential reversal points in the market. When a valid fractal pattern appears, the balance between buying and selling pressure may shift. It is essentially a candlestick chart pattern, which was, over time, developed as an indicator that is available on many trading platforms.
What Do Fractals Tell Us?
Fractals tend to appear where a prevailing trend is nearing its end. A fractal pattern that appears during a bullish trend is called a Bearish Fractal because it means the bullish trend may be about to shift to a bearish trend. Similarly, a fractal pattern appearing during a bearish trend is called a Bullish Fractal because it means the prevailing trend is likely to give way to a bearish trend.
How To Identify Fractals on the Chart
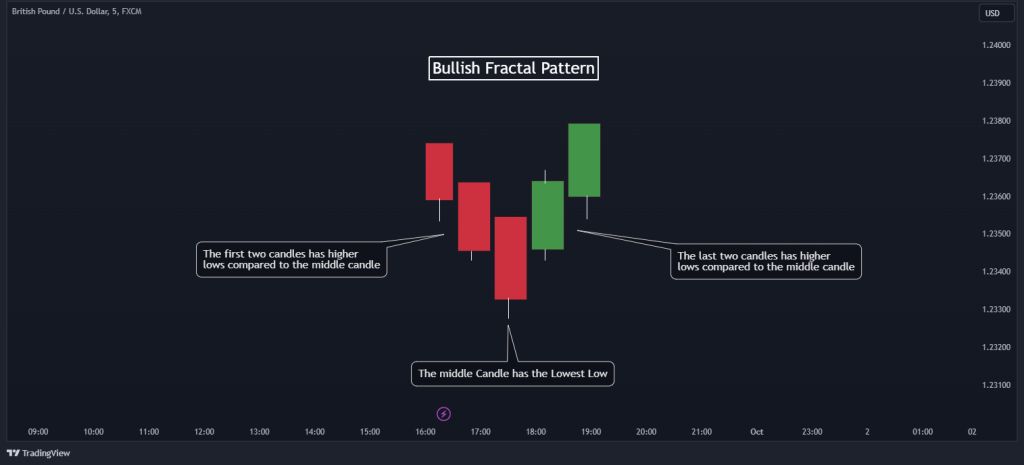
Fractals come in two distinct forms: bullish and bearish patterns. A bullish fractal signifies an impending uptrend reversal. To spot it on your price chart, look for a series of five candles.
- The third candle should be the one with the lowest low. This marks a potential reversal point.
- The first two candles within the pattern must show higher lows compared to the middle candle.
- Finally, the last two candles should also have higher lows, further confirming the growing bullish momentum.
The chart below shows how it looks on the chart:
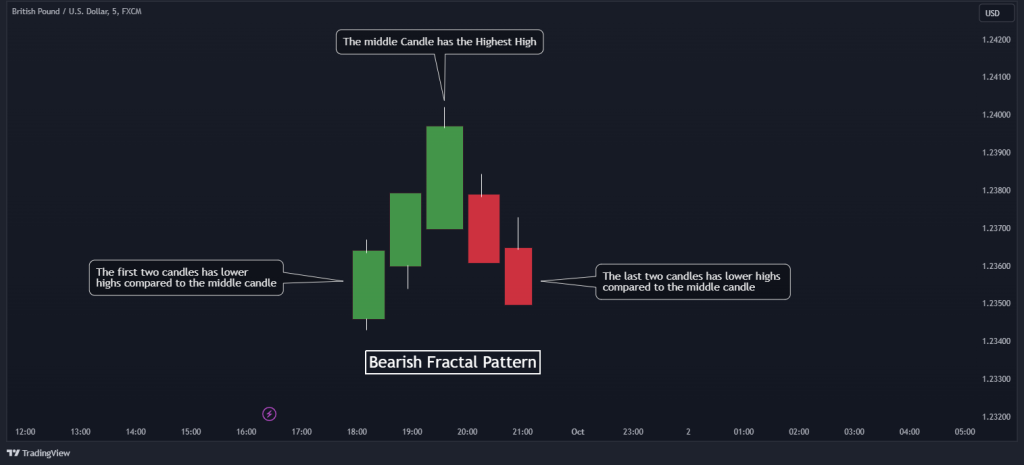
Conversely, a bearish fractal signals an imminent downtrend. Here’s how to identify it:
- Start by identifying a series of five candles. In this case, the third candle should have the highest high, signaling a potential trend reversal.
- The initial two candles in the sequence should have lower highs than the middle candle.
- Lastly, the last two candles should continue the pattern by showing lower highs.
Check the chart below to see what it looks like.
It is important to note that the colors of the first and second candles don’t matter when identifying the fractal pattern. For example, a bullish fractal can have a bullish candle followed by a bearish candle just before the middle candle, and it is still a valid bullish fractal pattern as long as the lows are higher than the middle candlestick’s low.
Now, thanks to Williams, you can also automatically plot these patterns on your chart by simply adding the Williams Fractal indicator to your favorite charting software. To add it to MetaTrader4 or 5, you must look for a third-party source and install it as a custom indicator.
The chart below shows the “Williams Fractal” on TradingView.
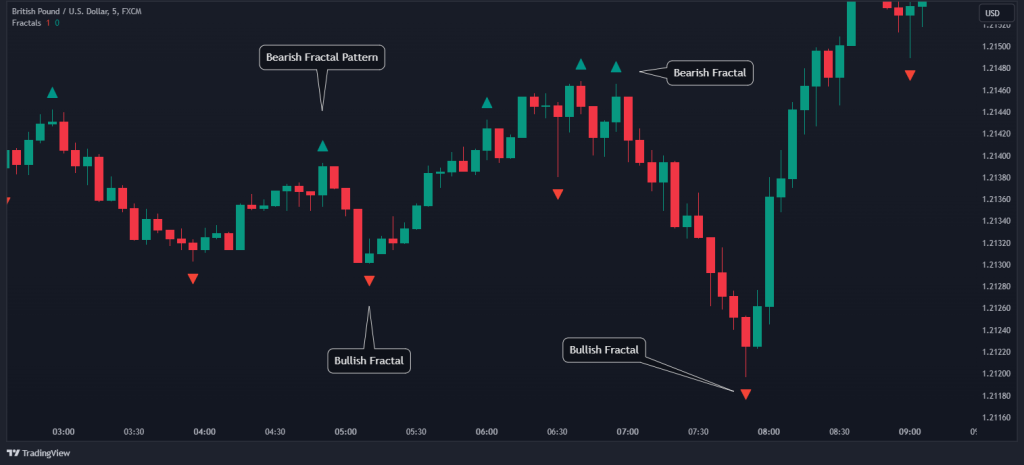
A bearish fractal, also known as an up fractal, is typically represented on a chart with an upward-pointing arrow above it. Conversely, a bullish fractal, known as a down fractal, is depicted with a downward-pointing arrow below it.
Consequently, if you’re using fractals within an uptrend, focus on identifying the downward-pointing fractal arrows. Conversely, when looking for trading opportunities with bearish fractals in a downtrend, look for upward-pointing fractal arrows.
How Do You Trade the Fractal Strategy? (2 Most Common Ways)
Now that you know how to identify fractals on the chart, let’s see how to trade them. It’s important to note that there are many ways to trade these patterns; however, these are two of the most effective fractal trading strategies:
1. RSI and Fractal Trading Strategy
One of the easiest ways to trade the fractal pattern is to combine it with the RSI indicator. The RSI indicator is good at showing us where price reversals are likely to take place, and armed with the fractal pattern, we can take advantage of the new move.
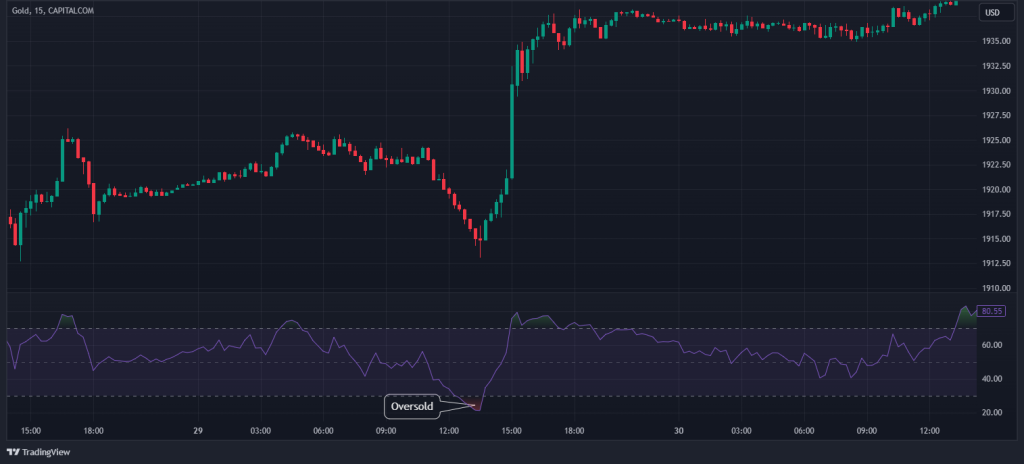
- The first step is to identify overbought or oversold levels on the RSI. These points signal a potential reversal. For instance, from the chart below, we can see an oversold market telling us that the sellers are leaving the market and an uptrend is about to start.
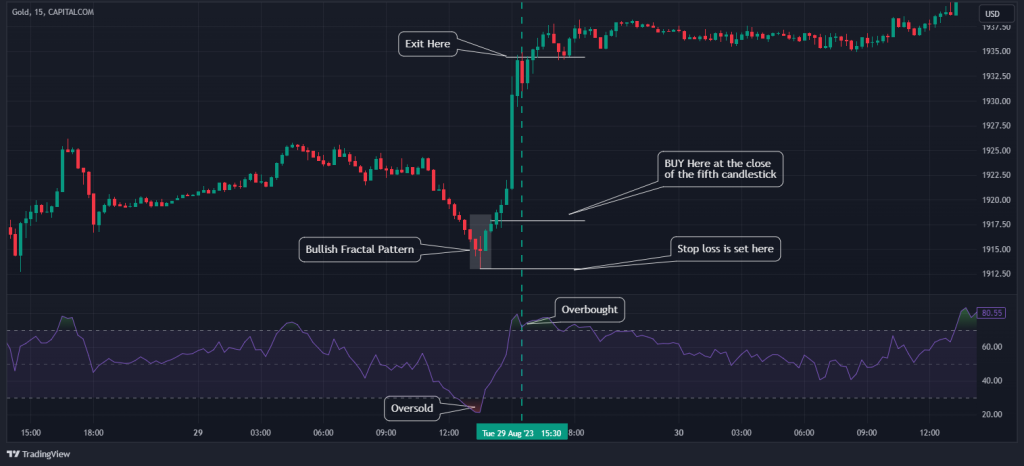
- After identifying the market is oversold, we will be looking to enter a buy entry at the close of the fifth candlestick of the bullish fractal pattern, as shown in the chart below.

- Knowing where to buy is not enough; we must also pay attention to our risk management parameters, as this is not a fail-proof strategy. In this case, our stop loss will be placed slightly below the bullish fractal pattern, and we will exit the position when the RSI is overbought. If you prefer a “set and forget” approach, you can set your target profit to two times your risk after placing your stop loss below the bullish fractal pattern.
2. Fibonacci Retracement and Fractal Trading Strategy
Another method to use Fractals is to combine it with Fibonacci retracement levels. This strategy combines the power of fractal trading as a trend reversal indicator with the precision of Fibonacci retracement levels, helping to narrow down trade possibilities to higher probability setups only. Here’s how this strategy works:
- The first thing you want to do when you hit the chart is to identify the trend. In a downtrend, we have a series of lower highs and lower lows. On the other hand, a series of higher highs and higher lows signal an uptrend. From the chart below, it’s clear that the trend is bearish, and all we have to do is look for a bearish fractal pattern.
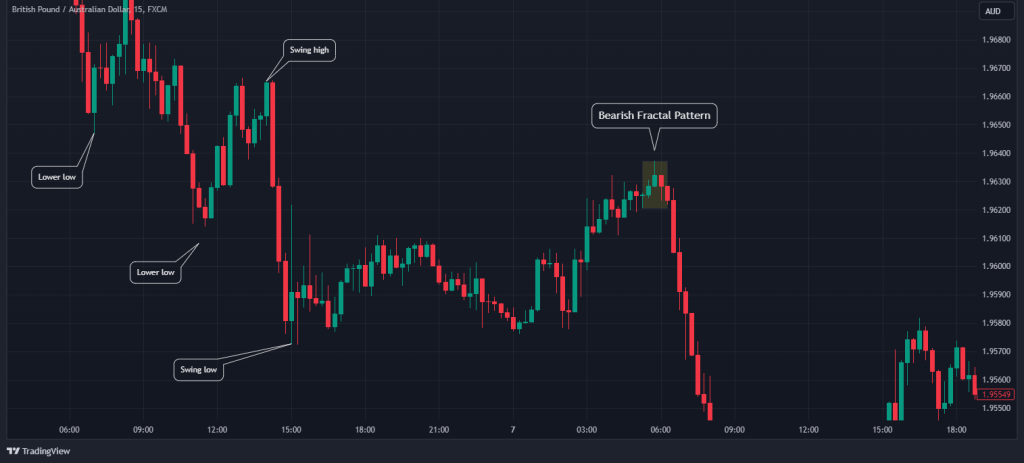
- After identifying the bearish fractal pattern, it’s time to add a Fibonacci retracement confluence. In a downtrend, draw the Fibonacci retracement from the swing high to the swing low. The pattern must be retesting key Fibonacci retracement levels (e.g.61.8%) to be a valid entry signal, as shown in the chart below. Then, open a position after the close of the fifth candle.
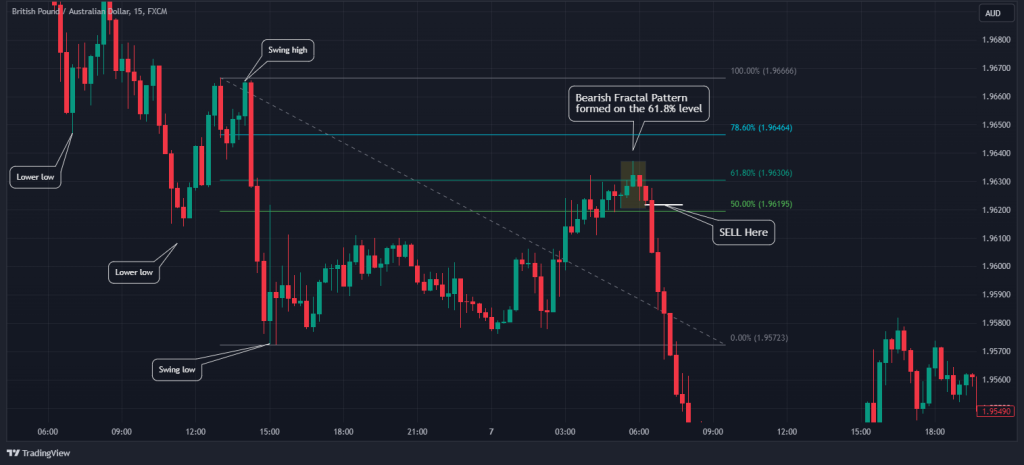
- Now, since we are in a short-sell position, place a stop loss slightly above the fractal and target the swing low of the move as your profit target, as shown in the chart above. The opposite is true if we were in an uptrend.

That’s it with this strategy!
Nonetheless, it is advisable to backtest each of these strategies to find out which works best for you before trading them with real capital, as this helps you to develop confidence in the system and keep a healthy psychology while trading.
Fractals can help traders identify potential reversal points in the market. When a valid fractal pattern appears, it suggests that the balance between buying and selling pressure may be shifting.
Fractal Trading Strategy PDF
Here you can download our free Fractal trading strategy PDF:
What are the Benefits and Limitations of Fractal Trading?
Fractal trading, like any trading strategy, comes with its own set of benefits and limitations. Let’s explore both sides of the coin to provide a well-rounded perspective on its use.
Benefits of Fractal Trading
Fractal patterns, unlike some subjective trading methods, are based on specific rules for pattern recognition, reducing the potential for interpretation errors. Fractals also offer traders entry and exit signals, which can be especially valuable for trend-following strategies or short-term strategies like day trading and the scalping trading strategy. Since fractals are known as accurate signals, they help traders time their trades more effectively, potentially leading to more profitable trades.
Pros
- Fractals are fairly accurate trading signals, which are also easy to recognize and use.
- Fractals can be applied to various timeframes, which is suitable for traders with different trading styles and preferences.
- The use of fractals in setting stop-loss orders contributes to sound risk management practices.
Limitations of Fractal Trading
While fractals are valuable for trend confirmation, they are not infallible. For instance, traders may encounter false signals, where a fractal pattern forms but does not lead to a significant price movement, which can result in losses if not managed carefully.
Cons
- The performance of fractals can vary based on market conditions. For instance, they perform poorly in a ranging market.
- Fractals are inherently lagging indicators, which can sometimes cause traders to enter or exit positions after a significant move has occurred.
- The Fractal pattern rarely occurs on charts.
Can Fractals Be Used for Short-Term and Long-Term Trading?
Fractals can be applied to various timeframes, making them versatile tools for traders with different trading styles. Traders can use fractals on short-term charts like one-minute or five-minute intervals for day trading, or they can apply fractals to longer-term charts like daily or weekly intervals for swing trading or long-term investing. The adaptability of fractals allows traders to tailor their analysis to their preferred time frame.
How Can I Determine the Validity of a Fractal Pattern?
To determine the validity of a fractal pattern, follow the specific rules for identifying fractals. Traders should also pay attention to the timeframe they are using; a valid fractal pattern on a higher timeframe may carry more significance than one on a lower timeframe. Therefore, it is advisable to use multiple timeframe analysis when using the fractal trading strategy. Additionally, it’s advisable to confirm fractal signals with other technical analysis tools or indicators to reduce the likelihood of false signals.
Does Fractal Trading Actually Work?
Fractal trading is effective when used as part of a comprehensive trading strategy, with some traders claiming to have achieved a 48% win rate with a minimum of 2 risk-reward ratio profit target. However, fractal trading is not without its considerations. Traders must be cautious of false signals and acknowledge that fractals are lagging indicators, which can result in delayed entry and exit signals.
Conclusion
While fractals can be a potent tool in the hands of any trader, they do not make up a conclusive trading strategy on their own. The pattern rarely occurs in the market, and while the fractals indicator is helpful, it still does not seem enough to rely solely on the indicator. As such, it is best to use Fractals as an extra tool to add to your trading toolkit. Ultimately, these signals can help you find trading opportunities if used correctly with other tools and technical indicators.
Risk Disclosure: The information provided in this article is not intended to give financial advice, recommend investments, guarantee profits, or shield you from losses. Our content is only for informational purposes and to help you understand the risks and complexity of these markets by providing objective analysis. Before trading, carefully consider your experience, financial goals, and risk tolerance. Trading involves significant potential for financial loss and isn't suitable for everyone.