


The Chaikin Money Flow (CMF) indicator measures the strength of buying and selling pressures within a given time frame, presenting traders with a dynamic tool to assess trends and potential reversals in the market. As a volume-weighted oscillator, CMF fluctuates between -1 and +1.
- The Chaikin Money Flow (CMF) Indicator is a valuable tool that helps traders gauge the strength of trends and potential reversals in the market.
- It assesses the balance between buying and selling pressure over a specific time frame.
- CMF values range between -1 and +1, but extreme readings are rare. Typically, CMF fluctuates within the range of -0.50 to +0.50.
- Positive CMF values indicate buying pressure, while negative values suggest selling pressure.
In this guide, we will cover everything you need to know about the Chaikin Money Flow indicator, including how to use the indicator and implement the CMF trading strategy.
- What is the Chaikin Money Flow Indicator?
- How the CMF Indicator Works
- How to Calculate Chaikin Money Flow (Money Flow Formula)
- How to Use the Chaikin Money Flow Indicator in Trading
- Chaikin Money Flow Indicator Trading Strategy Example
- Benefits and Limitations of the Chaikin Money Flow Indicator
- Key Takeaways
- Frequently Asked Questions
What is the Chaikin Money Flow Indicator?
The Chaikin Money Flow (CMF) indicator, developed by financial expert Marc Chaikin, is a powerful tool used in trading to gauge the flow of money in and out of a financial asset. The indicator is a volume-weighted average indicator that assesses the accumulation and distribution of assets over a specified period.
The standard CMF period is typically 21 trading periods, though traders can adjust this to suit their specific needs. Like many other technical analysis indicators, the CMF is displayed as a sub-chart with one line.

CMF’s underlying principle is relatively straightforward: it scrutinizes the relationship between closing prices and their proximity to the high and low of a given period. When the closing price is closer to the high, it suggests more accumulation of the asset has occurred.
Conversely, when it’s closer to the low, it indicates a higher degree of distribution. Essentially, it works on the principle of the famous Wyckoff chart pattern theory. Additionally, since the CMF can significantly help in confirming short-term trades, it is often used by those who utilize day trading and scalping trading strategies.
The indicator assigns positive values when the closing price consistently lands above the midpoint of the period’s range on increasing volume. Conversely, if the closing price frequently resides below the midpoint on rising volume, the Chaikin Money Flow will show a negative value.
Ultimately, when using the CMF indicator, traders use signals of buying and selling pressure to analyze the market and find trading opportunities.
How the CMF Indicator Works
The Chaikin Money Flow indicator is an oscillator that ranges between -1 and +1, although it rarely reaches these extreme values. To hit the +1 or -1 marks, there would need to be 20 consecutive closes at the high or low, respectively, over a 20-day period. Typically, the CMF fluctuates from -0.50 to +0.50, with the central point being 0.
The Chaikin Money Flow indicator’s primary function is to measure the bullish and bearish pressure over a specified time frame. To make informed trading decisions, it’s crucial to understand how to interpret CMF readings correctly:
Positive CMF: When the Chaikin Money Flow moves into positive territory (above the zero line), it signals buying pressure in the market. This suggests a positive money flow, potentially indicating an uptrend. Traders often view positive CMF as a confirmation of an ongoing upward trend.
Negative CMF: Conversely, a move into negative Chaikin Money Flow territory (below the zero line) indicates selling pressure. This means there’s an increased negative money flow, which may cast doubt on the strength of an uptrend. Negative CMF can be seen as a reversal signal leading to a downtrend.
How to Calculate Chaikin Money Flow (Money Flow Formula)
Calculating the Chaikin Money Flow indicator involves a three-step process, as outlined below:
- Money Flow Multiplier: This is the first step and is computed using the formula:
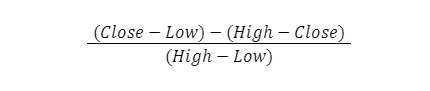
The Money Flow Multiplier is crucial in determining the Money Flow Volume.
- Money Flow Volume: Multiply the Money Flow Multiplier by the volume for the period to calculate the Money Flow Volume.
- 21-period CMF: This is the final step and involves summing the Money Flow Volume for the past 21 periods and dividing it by the sum of the volume for the same 21 periods. This calculation helps smooth out the CMF and provides a more reliable trend indicator.
Each period’s Money Flow Volume is closely tied to the Money Flow Multiplier, which shifts between positive and negative values based on the closing price’s relationship with the high and low of the period.
How to Use the Chaikin Money Flow Indicator in Trading
The following are some ways to trade the CMF indicator strategy.
1. Using CMF for Confirmation
One powerful aspect of the Chaikin Money Flow indicator is its ability to confirm or challenge the price action of an underlying asset. Therefore, the CMF is a great indicator as an extra tool to confirm trading signals. For instance:
- Positive Price Action with Positive CMF: If the price is trending upward, and the CMF is also in positive territory, this alignment confirms the strength of the uptrend. It suggests that the buying pressure aligns with the price movement, reinforcing the bullish sentiment.
- Positive Price Action with Negative CMF: On the other hand, if the price is rising, but the CMF has turned negative, it may indicate a weakening of the uptrend. This situation could signal traders to exercise caution and anticipate a bearish reversal.
- Negative Price Action with Negative CMF: In downtrends, a negative CMF can serve as confirmation. When both the price and CMF are in negative territory, it suggests strong selling pressure, reinforcing the bearish sentiment.
- Negative Price Action with Positive CMF: If the price is declining while the CMF remains positive, it might question the validity of the downtrend. This situation could indicate a potential reversal or a weakening of the bearish trend.
2. Using CMF for its Zero Line Cross
Since the CMF is an oscillator, it’ll swing past the zero line often. And you can incorporate these crosses into your trading system. For instance, a bullish cross happens when the indicator crosses the zero line from the bottom to the upside, and a bearish cross occurs when the indicator crosses the zero line from the upside to the downside.
Although some traders might find this to be less reliable, it can still work with the right tweaks and confluence.
3. Using CMF for Divergence
Divergence occurs when the indicator forms a market structure that is not replicated on the price chart. For instance, when the price forms a higher high but the indicator forms a lower high, we have a bearish divergence. Chances are that the price is going to drop soon. And when the price forms a lower low but the indicator only gives a higher low, this is a bullish divergence and it signals that the trend is about to reverse to the upside.
We have a free cheat sheet dedicated to divergence trading because it’s such a big deal and it can take your trading to the next level. Check it out and download it here:
Chaikin Money Flow Indicator Trading Strategy Example
The Chaikin Money Flow indicator provides valuable insights into trend strength and potential reversals. However, it is still best to use it as a confirmation tool along with other trading tools. In this example, we will walk you through a comprehensive CMF indicator strategy, from identifying trends to setting stop loss and take profit points.
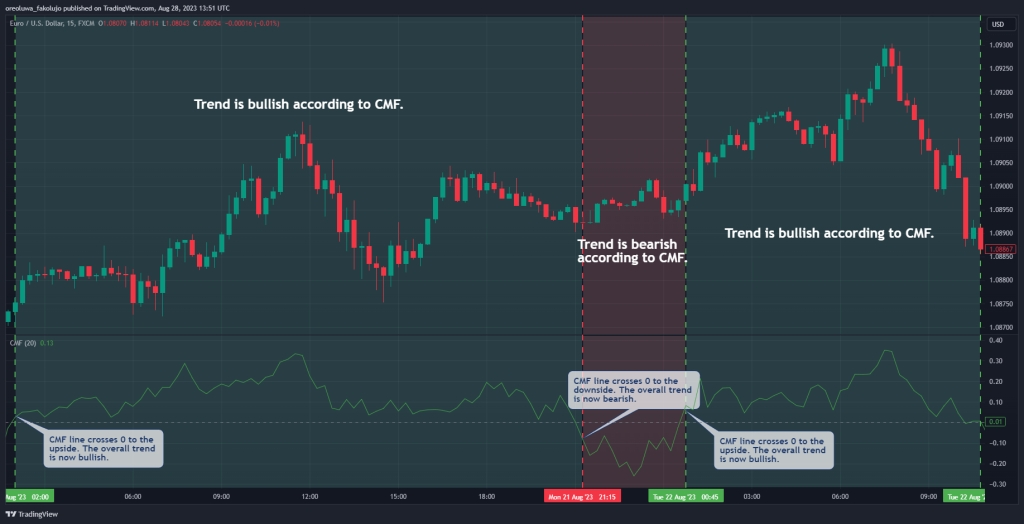
Step 1: Determine the Trend
During a continuous buying phase where the CMF value consistently remains above the zero line, a bullish trend is in place. This signals that prices are likely to continue rising along the trend. Conversely, persistent selling pressure (CMF value below zero line) indicates a bearish trend, suggesting prices will continue their descent.
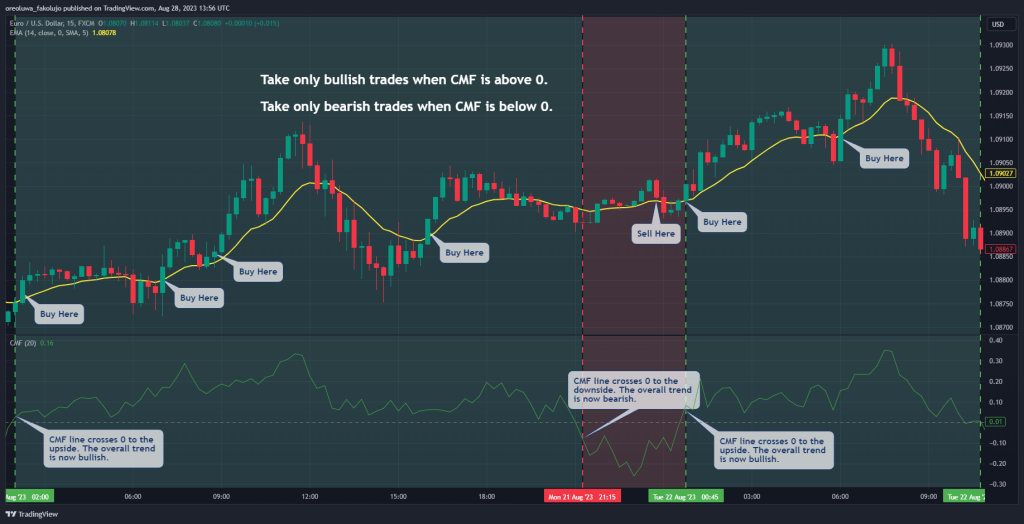
Step 2: Determine an Entry Point
With the trend identified, it’s time to determine the entry point. We are going to be using the 14 Exponential Moving Average. Whenever the price closes below the 14 EMA when we are in a downtrend, we will SELL. On the other hand, whenever the price closes above the 14 EMA in the direction of the CMF uptrend, we are going to BUY.
Step 3: Stop Loss
Based on your risk tolerance, set a stop loss level below the last swing low for long positions (bullish trend) and above the previous swing high for short positions (bearish trend). This safeguards your investment in case the market moves against your trade.

Step 4: Target Profit
To determine your target profit, you should look at exiting your trade when the price closes above/below the 14 EMA in the opposite direction of the prevailing trend. For instance, if you are in short-sell trade, consider closing your trade in profit when the price closes above the 14 EMA.

Benefits and Limitations of the Chaikin Money Flow Indicator
The Chaikin Money Flow Indicator comes with its own set of advantages and limitations. Here are some of them:
Benefits of Using the Chaikin Money Flow Indicator
One of the primary benefits of the Chaikin Money Flow Indicator is its ability to assess the strength of a trend. It gives traders a clear indication of buying and selling pressure within a given period, allowing them to make informed decisions about the market’s direction.
The CMF can also be an early warning system for potential trend reversals. If the indicator’s value diverges from the price trend, it can signal that the current trend might be losing momentum, giving traders a chance to adjust their positions before a significant reversal occurs. As such, it is advisable to use the CMF indicator in combination with other tools like Fibonacci support and resistance levels.
Some of the benefits of the Chaikin Money Flow indicator include:
Pros
- Impressive trend strength assessment tool
- Can help to catch early reversal signals
- Serves as a great trend confirmation tool
Limitations of the Chaikin Money Flow Indicator
One significant limitation of the CMF indicator is that it does not provide specific trade entry and exit points. While it helps identify trend strength, it doesn’t offer guidance on when to enter a trade or exit for optimal profits.
It’s also important to recognize that the CMF indicator is not a standalone trading system. Relying solely on the CMF can lead to incomplete trading strategies. Traders often use it in conjunction with other technical tools to refine their decisions.
Cons
- Lack of consistently precise entry and exit points
- Should not be used as a complete trading system
- False signals in sideways markets
Key Takeaways
- The Chaikin Money Flow (CMF) Indicator is a powerful tool for traders, assessing buying and selling pressure over a specific period.
- CMF values oscillate between -1 and +1, with rare extremes, and typically range from -0.50 to +0.50.
- Positive CMF suggests buying pressure and confirms uptrends, while negative CMF indicates selling pressure and questions uptrend strength.
- CMF is used alongside price action analysis and other indicators to validate trends and potential reversals.
- While beneficial for trend strength assessment and early reversal signals, CMF lacks precise entry/exit points and must be used as part of a comprehensive trading strategy.
Frequently Asked Questions About Trading the CMF Indicator
Here are some of the most common questions about the CMF indicator:
How does CMF’s value range work?
The Chaikin Money Flow (CMF) Indicator operates within a value range of -1 to +1, although instances of reaching these extremes are uncommon. More frequently, CMF readings fluctuate within a range of -0.50 to +0.50. A value of 0 serves as the central point. This range essentially depicts the buying and selling pressures’ intensity, providing traders with insights into the dynamics of the market sentiment.
How can CMF confirm trend strengths?
CMF serves as a robust confluence trading tool for trend strengths. In an uptrend scenario, when both the price action and the CMF indicator exhibit positive values, it signals that buying pressure is not only present but is in alignment with the upward trend. This convergence boosts the trader’s confidence that the uptrend possesses genuine strength and momentum, reinforcing the viability of bullish positions.
Does CMF offer precise entry and exit points?
The Chaikin Money Flow Indicator does not offer specific entry and exit points for trades on its own. While it excels at assessing trend strength, it is not a standalone trading system. Instead, traders use CMF in conjunction with other technical indicators and tools.
Risk Disclosure: The information provided in this article is not intended to give financial advice, recommend investments, guarantee profits, or shield you from losses. Our content is only for informational purposes and to help you understand the risks and complexity of these markets by providing objective analysis. Before trading, carefully consider your experience, financial goals, and risk tolerance. Trading involves significant potential for financial loss and isn't suitable for everyone.


