- Value area trading utilizes volume and market profiles to identify key price ranges where the bulk of trading activity occurs, providing insight into market consensus on fair value.
- The Volume Profile indicator is essential for spotting significant trading activity zones and defining the value area.
- Market Profile complements the Volume Profile by organizing price and time data to highlight where the market spends most of its time.
- Additional tools like moving averages, order flow analysis, VWAP, and Fibonacci retracement levels assist traders in identifying value areas and predicting future market movements.
Trading the financial market requires a level of understanding of different trading strategies, one of which is the value area trading strategy that looks at specific trading areas to execute trades based on the parameters presented within those areas.
Traders rely on the value area trading strategy because it is consistent and easy to use. In fluctuating liquidity, the strategy can point investors to where the majority of the deals are happening, and that is a strong indication as to where the price might move in the future. So, on this page, we’ll discuss what the strategy is all about.
What is Value Area Trading?
Value area trading is a systematic approach used by traders to identify price levels where the most significant trading activity has occurred, typically representing areas where the market perceives fair value. This strategy employs the concept that prices will often revisit these high-volume zones, thus offering strategic entry and exit points for traders.
Central to this strategy is the “70% rule,” which posits that the value area encompasses the range where approximately 70% of the day’s trading volume has taken place. This is a crucial aspect of market profile analysis, as it helps traders focus on the price levels that have attracted the most interest. Surrounding the Point of Control—the price level with the highest volume—the value area provides a snapshot of where traders have agreed upon value.
Additionally, the “80% rule” complements this concept by suggesting that if the price enters the value area and remains there for an extended period, there is a high likelihood that the price will cover the entire value area. These rules form the bedrock of value area trading, guiding traders to make more informed decisions by highlighting key areas of market activity.
5 Ways to Identify Value Areas on a Price Chart
In your quest to master the value area trading strategy, one of the most pivotal skills you must develop is the ability to identify value areas on a price chart. That’s the core concept of the strategy.
However, the identification of these areas is not just about recognizing where the price has been but also about anticipating where it is likely to return. As such, traders often use various technical analysis tools that assist them in finding these areas and getting signals as to the next market price movement.
Here are several methods you can use to pinpoint these areas:
1. Volume Profile Indicator
High trading volume is a strong indication for an area to become valuable. One such tool that can help in identifying that is the volume profile indicator.
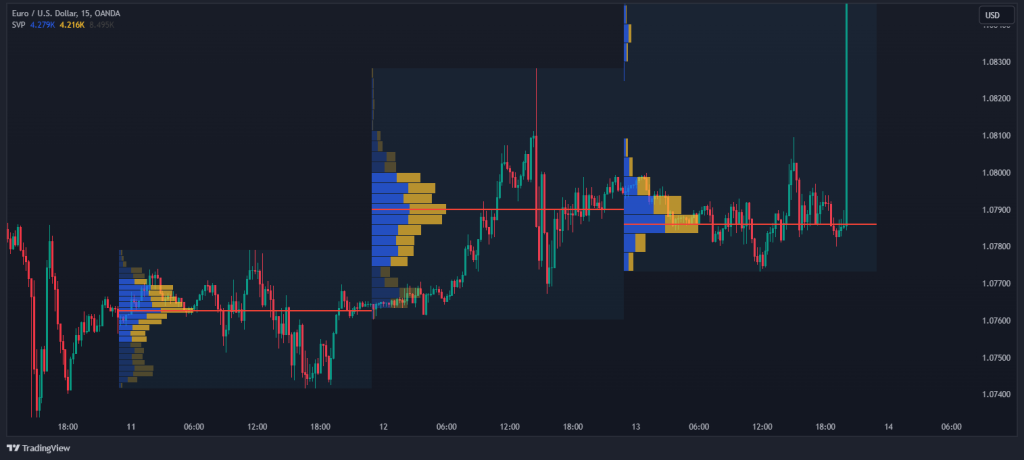
This powerful tool provides a visual representation of how much volume has occurred at each price level over a specified time frame. The most prominent feature of the Volume Profile is the Point of Control (POC), which is the price level with the highest traded volume. Surrounding the POC, the value area is typically defined as the range where a significant portion of the trading activity has taken place, often around 70% of the day’s volume.
As you can see in the image below, the Volume Profile’s histogram-like appearance on the side of the price chart makes it an intuitive tool for quickly identifying these high-activity zones.
2. Market Profile Indicator
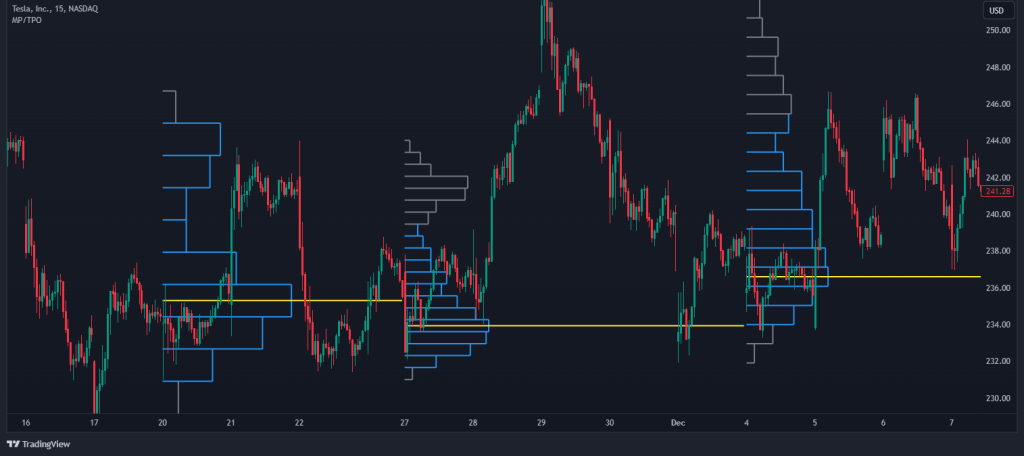
Another method closely related to the Volume Profile is the Market Profile indicator. Developed by Peter Steidlmayer in the 1980s, the Market Profile compiles price and time information into a distribution curve, often resembling a bell curve, to display where the market has spent the most time.
The value area in the Market Profile is where approximately 70% of the trading occurs, and the upper and lower value area limits bracket it. This method is particularly useful for identifying not just the value areas but also potential areas of price imbalance where breakouts could occur. It is, therefore, a great tool for those who utilize the range trading strategy and the breakout strategy.
3. Moving Averages
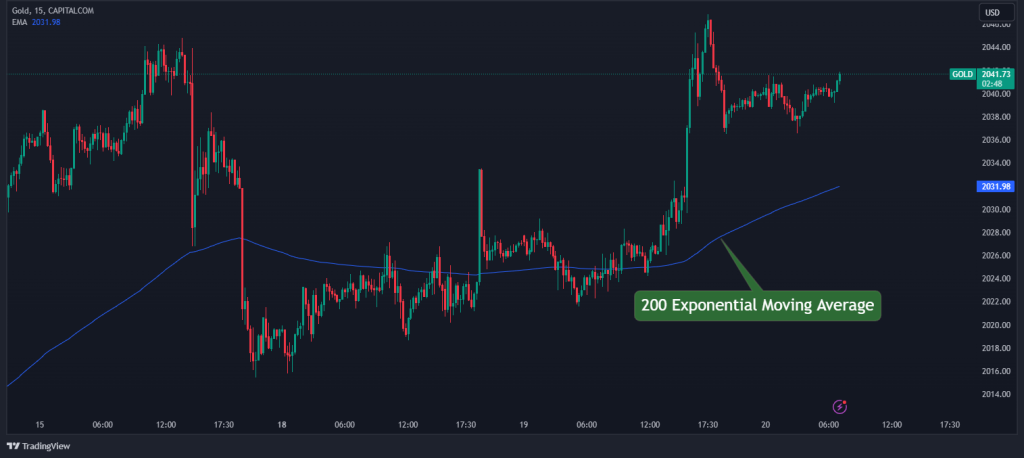
Moving averages are certainly a great tool for identifying value areas on price charts.
Technically, when a price action tends to bounce off or gravitate towards a specific moving average, it can be indicative of a value area. There are plenty of ways to use moving averages, including various combinations of MA and EMA. For instance, a 50-day or 200-day moving average might act as a dynamic value area, providing support or resistance for the price.
4. Volume-Weighted Average Price (VWAP)
When it comes to identifying value areas, VWAP is particularly useful because it reflects areas where a significant amount of trading volume has occurred at certain price levels. Since the VWAP takes into account the volume, it gives more weight to price levels with higher trading activity, which are often considered areas of value. These are the levels at which a substantial number of traders have executed trades, suggesting a consensus on the asset’s value at those prices.

When using the VWAP indicator, traders often look for the price to cross above or below the VWAP to signal potential buying or selling opportunities. For example, when the price is above the VWAP, the market may be considered bullish, and the area around the VWAP can act as support. Conversely, when the price is below the VWAP, the market may be considered bearish, and the VWAP can act as resistance.
5. Fibonacci Retracement Levels
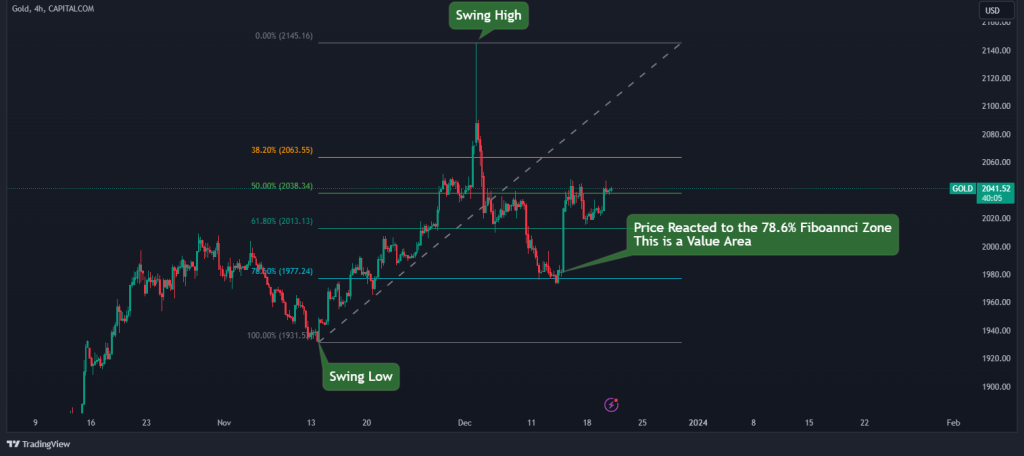
The Fibonacci retracement tool is rooted in the idea that markets move in predictable patterns. By identifying major high and low points on a price chart, traders can apply Fibonacci ratios to these points to predict potential areas of support or resistance.
These support and resistance levels often coincide with value areas, as they represent points where the market may perceive the price as more attractive, leading to increased buying or selling activity. Moreover, these Fibonacci levels often become key levels since they are used by many traders.
Value Area Trading Strategy (Trade Example)
So, now you understand the basic concept of value area trading, and you are familiar with the tools you should integrate to successfully implement this strategy.
But honestly, value area trading is a broad concept. There are so many ways to trade using this strategy, and some traders don’t even use any special tools to identify these value areas. So, since we have different ways to Identify a valued area, the number of ways to trade the value area trading strategy is limitless. However, for this intraday trading strategy, we will use the volume profile indicator to show you how to find value areas on a chart.
Step 1: Configure the Volume Profile Settings
First, you must launch the Volume Profile indicator on your chart. For those who use MetaTrader 4/5, you must download the indicator from a third-party website and install it on your platform since the Volume Profile is not a built-in indicator on MetaTrader 4/5.
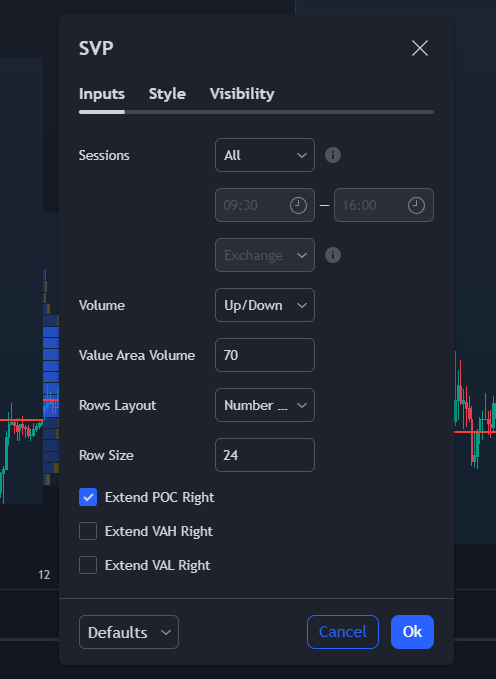
If you’re using the volume profile indicator on Tradingview, the first thing you want to do is extend the POC forward. The reason for this will become obvious in the next step.
To do this, right-click on the “Session Volume Profile” and tick the “Extend POC right” box, as shown in the image above. Once this is done, we can move to the next step.
Step 2: Determine an Entry on the POC level
Now that indicator is placed on your chart, you must look for an area where there’s high trading activity. In this example, we focus on the POC level, which acts as a good value area for us to look for a precise entry. When above the price, the POC can act as a resistance zone. Similarly, the POC can act as a support zone when below price. It is also an extremely common method for stock and futures traders who use the Opening Range Breakout trading strategy.
So, we are looking for yesterday’s POC level to align around the same zone as today’s before we take our entry.
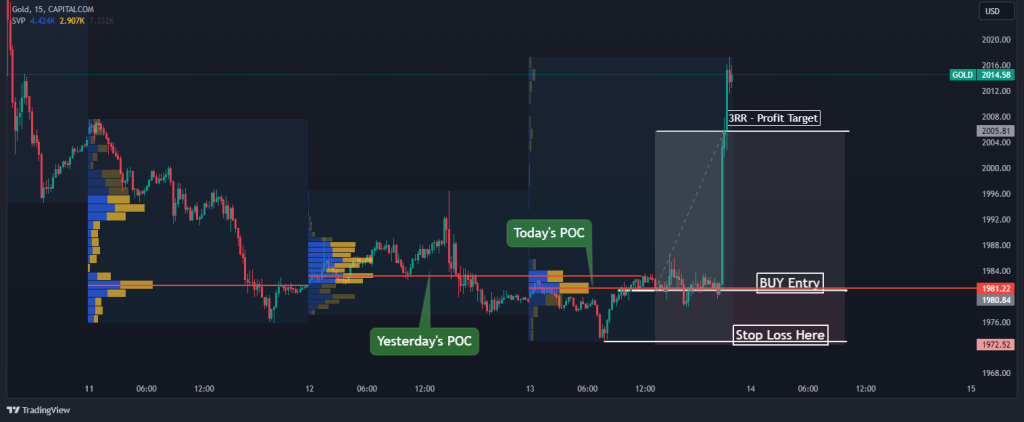
From the chart above, we can see that the two POC levels below the price are around one another. If using the breakout strategy, we can, therefore, open a buy position when the price closes above today’s POC level or sell when the price closes below the POC level. Otherwise, if the market is choppy and has no direction, you can use the POC as an area where the price might retrace after it gets away from the POC level.
At last, now that you are in the position, you can set our stop loss level below the low of the day and set your profit target at three risk-reward ratios.
What is the 80% Value Area Rule?
The 80% rule is a trading concept related to the value area and is particularly associated with Market Profile analysis. It states that if the price enters the value area for a certain period (usually the first hour of trading) and stays there for approximately two consecutive brackets (30-minute periods), there is an 80% chance that the price will continue to move to fill out the entire value area.
Having said that, this 80% rule is not a guarantee. It’s only a probability. We strongly recommend that you add other confluences, such as volume, structure, and order flow.
Does Value Area Trading Work?
To sum up, the value area trading strategy is a method used by traders to identify price levels or zones where the most trading activity has taken place over a certain period, suggesting a consensus on fair value. This strategy is grounded in the belief that prices tend to revisit these high-volume areas, offering opportunities for entry and exit points.
The effectiveness of value-area trading can vary. For some traders, it provides a structured approach to interpreting market dynamics and making informed decisions. However, it’s important to recognize that no trading strategy is infallible. Success in value area trading, as with any trading strategy, requires a combination of disciplined risk management and adaptation to changing market conditions.
Yet, without a doubt, value area trading can be a viable strategy when executed with skill and caution, and it has the potential to work well for traders who take the time to understand and apply its principles effectively.
Frequently Asked Questions
Here are some of the frequently asked questions about the value area trading strategy:
How is the Value Area Calculated?
The value area is calculated using the Market Profile or Volume Profile concept, which identifies where the most trading activity has taken place. Typically, the value area is where approximately 70% of the day’s trading volume has occurred. To calculate it, traders look at the volume at different price levels and identify the price range where the bulk of trading has happened during a particular trading session. This range includes the Point of Control (POC)—the price level with the highest trading volume. The value area is then defined by the upper and lower price levels that contain the central 70% of the day’s total volume.
What is the VWAP Value Area?
The VWAP, or Volume Weighted Average Price, is a trading benchmark that represents the average price a security has traded throughout the day based on both volume and price. It is a measure of the market consensus for the value of a security over a specified time frame. The VWAP value area, therefore, refers to the range around the VWAP where a significant portion of the day’s trading volume has occurred. This area can be considered a zone of value where the price may be more attractive to traders, as it represents a balance between demand and supply.
Risk Disclosure: The information provided in this article is not intended to give financial advice, recommend investments, guarantee profits, or shield you from losses. Our content is only for informational purposes and to help you understand the risks and complexity of these markets by providing objective analysis. Before trading, carefully consider your experience, financial goals, and risk tolerance. Trading involves significant potential for financial loss and isn't suitable for everyone.