- The BTMM strategy is aimed at understanding and exploiting market maker behaviors in Forex trading, recognizing the influence these large institutions have on market prices.
- It emphasizes recognizing a three-day cycle in market maker activities, identifying distinct phases of market maker manipulation, and aligning trading strategies with these phases for effectiveness.
- The strategy also employs various indicators like candlestick patterns, EMAs, and pivot points to analyze and predict market movements, providing a structured approach to trading.
Smart money concepts have gained widespread attention in recent years, but just some years ago, those who popularized it were labeled weird. One of those was Steve Mauro, who founded the Beat the Market Maker (BTMM) strategy.
Shortly after training his first set of students, the profitability of his unique trading strategy began to speak for itself. Today, the BTMM strategy stands as one of the most reliable trading strategies, and this article will give a full explanation of what this strategy is all about.
 Table of Contents
What is the BTMM Strategy?
Founded by Steve Mauro, the Beat The Market Maker strategy, as its name suggests, focuses on understanding and exploiting the actions of market makers. The story behind this strategy is deeply rooted in Mauro’s trading success. At some point in his career, Steve Mauro suddenly realized that markets mostly move in a certain direction based on the actions of market makers. A market maker, typically a large financial institution like a bank, functions as an intermediary in trading, influencing market prices through their substantial trading volume.
They usually have a huge impact on price movements and the dynamic in the market. As such, the BTMM is a classic “follow the money” strategy. Its idea relies on identifying market scenarios when market makers manipulate price action.
Much like the Smart Money Concept trading strategy, the BTMM strategy revolves around recognizing patterns and strategies used by market makers to find profitable trades. These entities use various tactics to manipulate price movements, such as inducing traders to take positions and then reversing the market direction to profit from these moves. The market makers’ primary tools include the ability to buy or sell currency in different volumes at varying prices, playing on the emotional responses of retail traders.
Interestingly, the BTMM strategy includes recognizing reversal patterns, which are considered vital for successful trading. Whether these patterns are artificially created by market makers or are natural market occurrences is a matter of debate. However, traders using the BTMM strategy focus on identifying and leveraging these patterns rather than getting caught in the market makers’ traps.
How Does the BTMM Strategy Work?
As mentioned, the Beat The Market Maker (BTMM) strategy operates on the premise of understanding and capitalizing on the activities of market makers (MMs). These market makers, often large financial institutions, have significant influence in the markets. They use their buying and selling power to create price movements, which can trap or mislead retail traders.
One of the key aspects of the BTMM strategy is the understanding of the three-day cycle, a pattern often observed in market maker behavior. This cycle starts with the market maker-driven phase, characterized by fast moves (Level I), followed by a phase driven by retail traders’ emotions in the absence of market maker support (Level II), and finally, a return of market makers to the market for profit-taking and further movement in the direction of the technical trend (Level III). Each level of this cycle has distinct behavioral patterns and is essential for a trader to recognize for successful application of the BTMM strategy.
BTMM traders often use intervals of days to identify a three-day cycle pattern, as shown in the chart below.
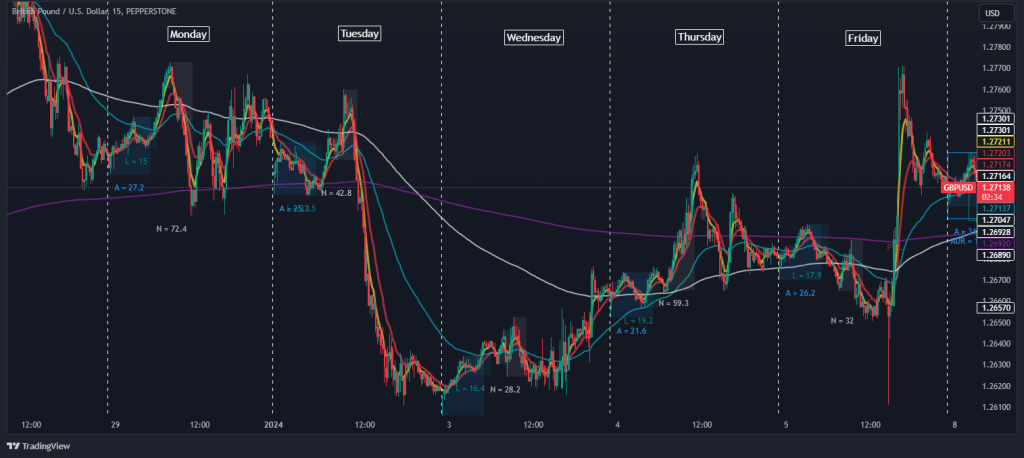
The BTMM strategy entails identifying these cycles and patterns, understanding market makers’ influence, and using this insight to make profitable trading decisions. It’s about aligning with the powerful moves of market makers rather than being caught in common market maker traps.
Overall, that’s the basic idea of the BTMM strategy. It relies on the notion that market makers are those who dominate the markets, and as such, understanding their actions is the key to success in trading.
BTMM Technical Analysis Tools and Indicators
The Beat The Market Maker (BTMM) strategy uses various indicators to analyze market behaviors and predict movements. Here are some of those:
1. Candlestick Patterns
These are the primary tools for BTMM, where particular shapes and formations of candles indicate potential market movements. Key chart patterns include Spike Candles, Spinning Tops, Hammers, Inverted Hammers, Doji Candles, Evening Star and Morning Star Formations, and Railroad Tracks (RRT). Each pattern has its significance, often indicating trend reversals or continuations.
2. Exponential Moving Averages (EMAs)
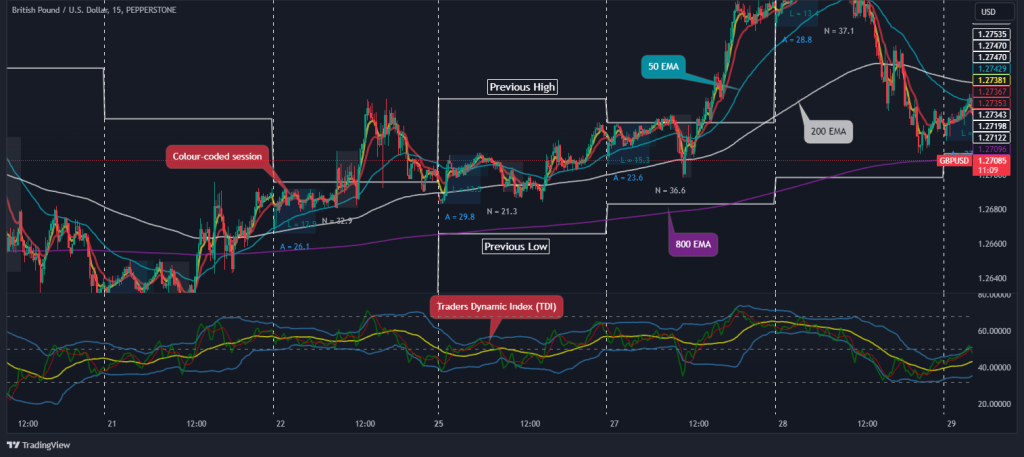
EMAs like 5, 13, 50, and 200 are used for identifying trends, momentums, and potential reversal points. They provide a dynamic view of support and resistance and are essential for interpreting market direction. For example, a crossover of the 5 and 13 EMAs can indicate a signal for entry or exit.
3. Colour-Coded Sessions
This involves marking out specific trading sessions, like the Asian or New York sessions, to identify periods of high trading activity or potential reversals. BTMM traders often use these key levels since they anticipate market makers may place large around these price levels.
4. Previous Highs/Lows of the Day (HOD/LOD)
Similarly to the color-coded sessions technique, this indicator is used to mark the previous day’s high and low points, which often act as significant levels of support and resistance.
5. Pivot Points
These are used to identify potential turning points in the market based on previous days’ highs, lows, and closing prices. They provide a grid-like structure to assess where the market might move, and therefore, the Pivot Point strategy is a vital part of the BTMM technique.
6. Average Daily Range (ADR)
The Average Daily Range indicator is another excellent indicator for the BTMM strategy. It measures the average market volatility and provides high and low estimates that can be crucial for setting up trades.
7. TDI (Traders Dynamic Index)
The Traders Dynamic Index (TDI) is a comprehensive indicator incorporating RSI, moving averages, and volatility bands. For BTMM traders, it helps in providing early entry signals and identifying potential reversals with its unique patterns like “Shark Fins”.
All in all, the BTMM involves a variety of tools placed on a price chart. For some, it might be confusing; however, a BTMM chart can certainly provide plenty of trading signals. As you can see in the chart below, A BTMM price chart is made of a combination of tools and indicators to predict market makers’ traps and manipulations.
Is the BTMM Strategy a Profitable Strategy?
Undoubtedly, the BTMM strategy provides a huge benefit for traders in understanding market dynamics and analyzing the markets. The idea of following market makers makes sense. After all, they have an enormous impact on the markets since they are the first in the chain to place orders from large institutions and even governments. In that sense, the BTMM strategy is more about trader psychology and risk management rather than a technical method of trading the markets.
If well mastered, then yes, the BTMM can be a highly successful strategy that can traders identify potential trading opportunities. However, while the BTMM strategy offers comprehensive tools and insights, its profitability, like all trading strategies, is not a one-size-fits-all guarantee. Success depends on a trader’s skill, adaptability to market conditions, and the precise execution of the strategy’s components.
Frequently Asked Questions About the BTMM Strategy
Here are some frequently asked questions about the BTMM Strategy:
Who developed the BTMM Strategy?
The BTMM strategy was developed by Steve Mauro as a method to interpret the intentions and movements of market makers and trade alongside them. It’s based on his years of trading experience and teaching other traders to understand the market from a market maker’s perspective.
What are the key indicators used in BTMM?
BTMM uses several indicators, including advanced candlestick patterns, Exponential Moving Averages (EMAs), Pivot Points, the Relative Strength Index (RSI), and the Traders Dynamic Index (TDI). These tools are used to analyze market momentum, direction, and potential reversal points.
Can BTMM be applied to all types of markets?
While BTMM is primarily used in the Forex market due to its emphasis on currency pairs and volatility, the concepts of understanding market makers and using specific indicators can be adapted to other financial markets to make profitable trades. However, traders should understand the unique aspects of each market and adapt their strategy accordingly. It’s also important to consider market liquidity, volatility, and regulatory differences when applying BTMM to markets other than Forex.
Risk Disclosure: The information provided in this article is not intended to give financial advice, recommend investments, guarantee profits, or shield you from losses. Our content is only for informational purposes and to help you understand the risks and complexity of these markets by providing objective analysis. Before trading, carefully consider your experience, financial goals, and risk tolerance. Trading involves significant potential for financial loss and isn't suitable for everyone.

