


The Average Daily Range (ADR) indicator shows the average range of price volatility of financial asset prices and can be used by traders to set profit targets and manage risk.
- ADR is a technical indicator that’s used to measure volatility in price within a trading day, aiding traders in making informed decisions.
- It can be applied to various financial instruments and timeframes, offering flexibility to traders.
- A robust strategy involves placing sell orders at the High ADR level and buy orders at the Low ADR level, targeting predefined profit levels.
In this guide, we will cover everything you need to know about the ADR indicator, including how to use the indicator and implement the ADR trading strategy.
- What is the Average Daily Range Indicator?
- Why is the Average Daily Range Indicator Important to Traders?
- How Do You Calculate the Average Daily Range Indicator?
- How to Use the Average Daily Range Indicator in Trading
- Average Daily Range Indicator Trading Strategy
- Average Daily Range Indicator – Pros and Cons
- What’s the Difference Between the ATR and the ADR
- How Accurate is ADR?
- Is the ADR a lagging indicator?
- What is the Average ADR per day?
- What Asset Is the ADR Best For?
- Key Takeaways
What is the Average Daily Range (ADR) Indicator?
The Average Daily Range (ADR) indicator serves as a tool for measuring the average daily price volatility of financial assets. Much like the Average True Range indicator, it equips traders with crucial insights into potential price fluctuations that can transpire within a single trading day.
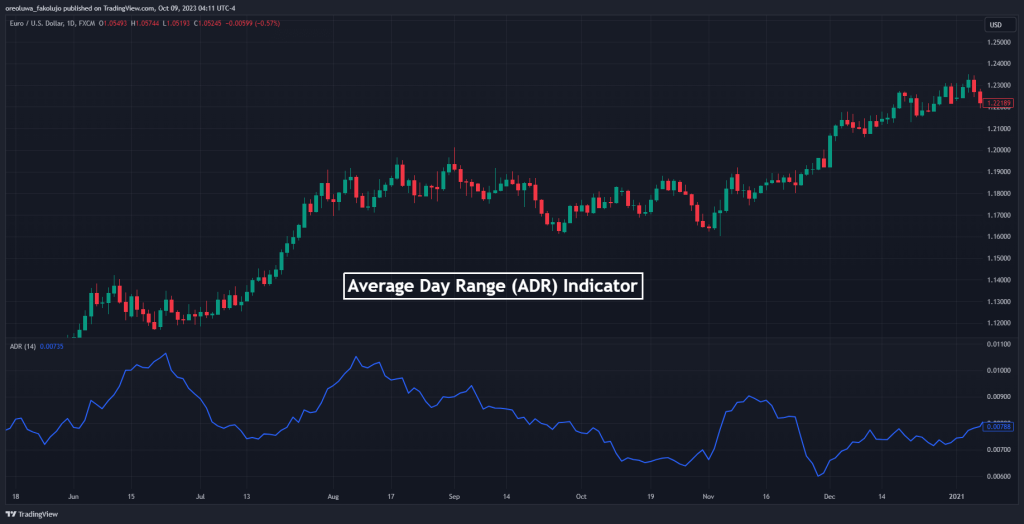
The main reason for using the Average Daily Range is to evaluate whether an asset trades above or below the average price over a specific period. Based on the idea that asset prices tend to go back to trade around the average price level, traders can then determine when to enter and exit positions. It is also widely used as a risk management tool to identify areas of stop loss and take profit.
Generally, the Average Daily Range indicator is versatile and can be applied to a variety of financial instruments, including stocks, currencies, and commodities. It is also adaptable across different timeframes, such as M15, M30, and H1, offering traders the flexibility to integrate it into their distinct trading methodologies and preferences.
Why is the Average Daily Range Indicator Important to Traders?
The Average Daily Range (ADR) indicator is important to traders for several key reasons:
1. Volatility Assessment
It provides traders with a quantitative measure of how much price typically moves within a single trading day. This helps traders gauge an asset’s current volatility and anticipate potential price movements.
2. Setting Profit Targets and Stop Losses
Traders use the ADR to establish realistic profit targets based on the average price movement. Similarly, it helps in placing effective stop-loss orders to manage risk, as traders can position their stops outside the average range to avoid being prematurely stopped out by normal price fluctuations.
3. Market Condition Analysis
By comparing the current price movement to the average daily range, traders can assess whether the market is experiencing heightened volatility or if it’s trading within its normal range. This insight aids in adjusting trading strategies accordingly, such as scaling position sizes or adapting to different market conditions.
4. Trade Management
Understanding the ADR allows traders to make informed decisions about trade entries and exits. For example, if a price movement exceeds the average daily range early in the trading day, it may indicate potential momentum or continuation patterns, influencing trade decisions.
5. Risk Management
Incorporating the ADR into risk management strategies helps traders maintain consistent risk exposure across different assets. By aligning position sizes with the expected volatility (as indicated by the ADR), traders can better control risk and optimize their overall portfolio management.
6. Intraday Trading Strategies
For intraday traders, the ADR serves as a valuable tool for identifying potential price targets and planning trading setups based on expected price ranges. It provides a framework for assessing the profit potential of short-term trades and helps traders avoid overtrading during periods of low volatility.
How Do You Calculate the Average Daily Range Indicator?
Here’s how to calculate Average Daily Range values:
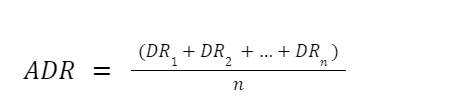
Where “DR” signifies the daily price range, computed as the absolute difference between the highest price and lowest price levels during a trading day (not to be confused with the opening and closing prices). The cumulative sum of these daily ranges over the specified period (n) is divided by the number of days to yield the average daily range.
How to Use the Average Daily Range (ADR) Indicator in Trading
There are quite a few ways to use the Average Daily Range. Depending on your trading style, you can use it to signal potential entry and exit points.
One way many traders try to use it is to mark out daily highs and lows using the indicator. They then go to the lower timeframes to try to see if they can catch reversals or breakouts from these areas. This way, they’re using the ADR range boundaries as dynamic support and resistance levels from which they can trade reversals and breakouts.
So, when an asset’s price action reacts at a daily high, for instance, it takes reversals in the opposite direction. But when price action breaks out of the high, they go long.
Another way to use the ADR indicator is to simply manage your risks after your trade entries. You use it to set your potential profit levels and stop loss levels.
Average Daily Range (ADR) Indicator Trading Strategy
The ADR, in its simplest form, is a risk management tool. Since it shows you how much price is likely to move within a trading period, you can use this information to set your stop losses and take profit levels.
Here’s a simple trading strategy that involves the ADR:
Trade Setup
The idea here is simple. We take our trade entries using any technical indicators or tools of your liking. For instance, you can buy when the price crosses above the 50-period EMA and sell when the price crosses below the same indicator. You can also use a Simple Moving Average or an RSI. What really matters is that we’re trying to catch trade entries using any tool at our disposal.
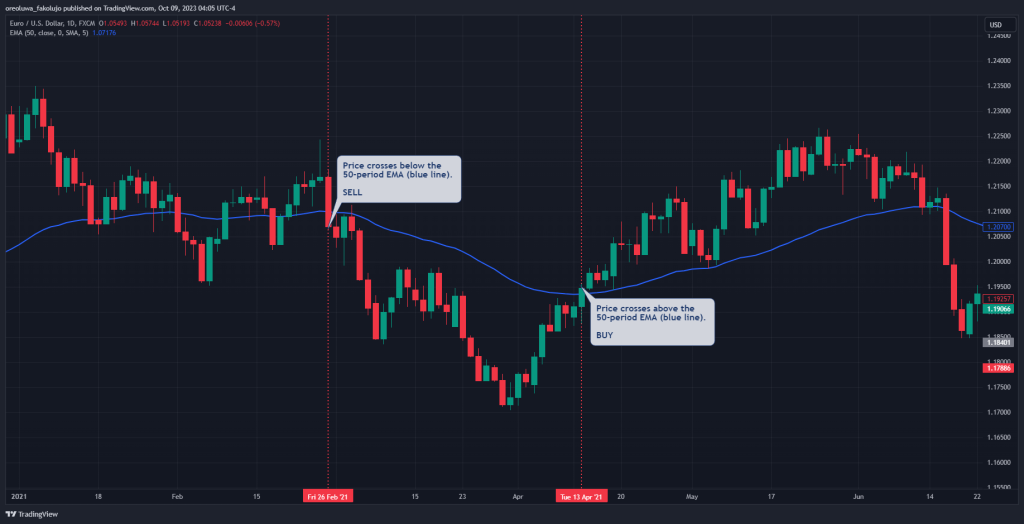
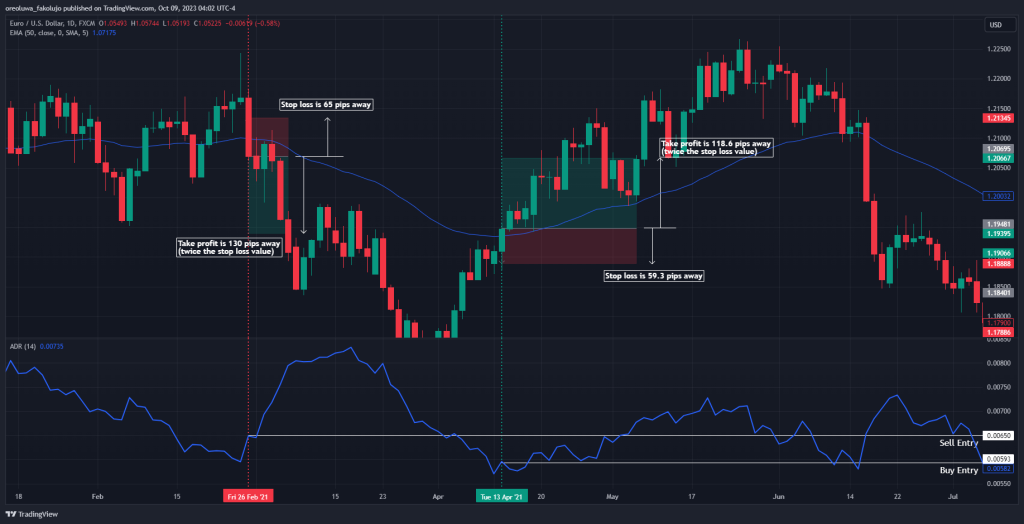
The EURUSD currency pair price chart above shows a simple scenario where we buy when the price crosses the EMA to the upside and sell when the price crosses the EMA to the downside.
The ADR comes in when your exit points are set.
Stop Loss and Take Profit Levels
Place your ADR on your chart. After your entry, check your ADR average value. You can set your stop loss at the same number of pips as your ADR value. And your take profit could be at two times your ADR value.
So, for example, if your ADR value is 617 (61.7 pips), you set your stop loss 61.7 pips away from your entry point. Your take-profit target would then be 123.4 pips away from your entry point.
Continuing with our EURUSD price chart below, notice that the ADR value for our bearish entry point was 65 pips (on the left side of the chart). So, using a risk-reward ratio of 2:1, we set our stop loss 65 pips away from our entry point, and we place our take profit level 130 pips (twice the stop loss value) away from the entry point. For the bullish trade on the right side of the chart, we have an ADR value of 59.3 pips. This means our stop loss was 59.3 pips away from the entry point, and our take profit level was 118.6 pips away from the same entry point.
Also, note that you don’t have to stick to our 1:2 rule. You can set your stop loss at two times your ADR value away and place your stop loss at seven times our ADR. What matters is that you backtest your levels and see which one works best for your trading strategy.
Average Daily Range Indicator – Pros and Cons
Let’s explore the benefits and limitations of employing this indicator to inform your trading decisions.
Benefits of Using the Average Daily Range Indicator
ADR provides valuable insights into market volatility, helping traders gauge the potential price fluctuations within a trading day. It assists in setting realistic profit targets by showcasing the average daily price range, aiding traders in managing their expectations. It also matches all kinds of trading styles, such as scalping and swing trading.
Pros
- Traders can use ADR levels as stop-loss points, improving risk management strategies.
- The ADR indicator is adaptable, making it suitable for traders with different timeframes and trading styles, especially technical analysis traders
- The ADR indicator can be applied across various financial instruments.
Limitations of the Average Daily Range Indicator
ADR is based on historical price data, which means it may not always accurately reflect current market conditions, particularly in rapidly changing markets. News events can significantly affect market volatility, rendering ADR less reliable during such events.
Cons
- Market behavior can change over time, affecting the reliability of the ADR as a predictive tool.
- Relying solely on the ADR indicator may lead to tunnel vision, causing traders to overlook other critical factors affecting their trades.
What’s the Difference Between the ATR and the ADR
Both indicators calculate the average daily range. However, the Average True Range takes into account the gap between price opening and closing prices. The ADR, on the other hand, keeps things simple by only taking the high and low price levels into account.
The table below lists all the differences between both indicators.
| Feature | Average Daily Range (ADR) | Average True Range (ATR) |
|---|---|---|
| Calculation | True range, including gaps and intra-day movements | Average of true ranges considering gaps and price action |
| Focus | Daily high and low prices | True range including gaps and intra-day movements |
| Components Considered | High and low prices | High, low, and previous close prices |
| Purpose | Estimate daily price movement | Assess overall market volatility |
| Use | Set profit targets, determine stop-loss levels | Determine dynamic stop-loss, position sizing |
| Scope | Daily price range estimation | Comprehensive volatility assessment |
| Application | Daily trading range estimation | Risk management, trade sizing |
| Timeframe | Typically daily timeframe | Suitable for various timeframes (intraday to longer-term) and any price action strategy |
| Influence on Trading | Helps in daily trade planning and risk management | Provides dynamic risk assessment based on volatility |
How Accurate is ADR?
Based on empirical findings, there is an 80% likelihood that the price will remain within the High ADR and Low ADR thresholds within trading days. Conversely, there is a 20% probability that the price will exceed these levels. Typically, such occurrences are associated with significant news releases or unforeseen global events.
Is the ADR a lagging indicator?
The ADR indicator falls into neither the category of lagging nor leading indicators, as it doesn’t dictate market trends. Instead, it’s used to present statistically derived levels for profitable trade exits on price charts. This statistical tool is dedicated to pinpointing the most precise average daily trading range.
What is the Average ADR per day?
The average ADR varies for each financial instrument, influenced by multiple factors. These factors include the trading instrument classification (such as stocks, forex, or commodities), its risk profile (speculative, safe-haven, or high-risk), its popularity among traders, and the level of market liquidity. In instances of abundant liquidity, the ADR typically remains low.
Conversely, in markets with limited liquidity, the ADR tends to be higher. Such markets with scarce liquidity are often referred to as “thin,” where significant actions by large players can exert substantial price movement in either direction.
What Asset Is the ADR Best For?
Because of its simple calculation and application, the ADR works on the forex market, stock market, or any other market whose price movement can be represented by candlesticks.
Key Takeaways
- ADR is particularly useful indicator for intraday trading, allowing traders to pinpoint entry and exit levels within the daily price range.
- Traders can utilize ADR levels as stop-loss points, enhancing their risk management strategies.
- Market conditions can evolve, impacting the reliability of ADR as a predictive tool; hence, traders should adapt and remain vigilant.
- When using the ADR indicator, traders should consider market timing, avoiding trading an hour before and after major news releases to mitigate potential volatility risks.
Risk Disclosure: The information provided in this article is not intended to give financial advice, recommend investments, guarantee profits, or shield you from losses. Our content is only for informational purposes and to help you understand the risks and complexity of these markets by providing objective analysis. Before trading, carefully consider your experience, financial goals, and risk tolerance. Trading involves significant potential for financial loss and isn't suitable for everyone.


