


The Traders Dynamic Index (TDI) indicator measures market trends, momentum, and volatility and can be used by traders to identify trends, expect reversals, and increase their win rate.
- The Traders Dynamic Index (TDI) Indicator is a comprehensive tool that integrates various indicators like RSI, moving averages, and Bollinger Bands, providing a holistic market view for informed trading decisions.
- TDI is essential for identifying market trends and their strength, using elements such as the RSI value and moving average crossovers to signal potential market conditions and trend directions.
- Traders use TDI for various purposes like spotting divergence, identifying false market moves (stop hunts), assessing market volatility, and determining optimal entry and exit points in trades.
This comprehensive guide explores how to effectively apply the TDI in trading, including its setup, interpretation, advantages, and limitations, catering to both novices and experienced traders alike.
What is the Traders Dynamic Index (TDI) Indicator?
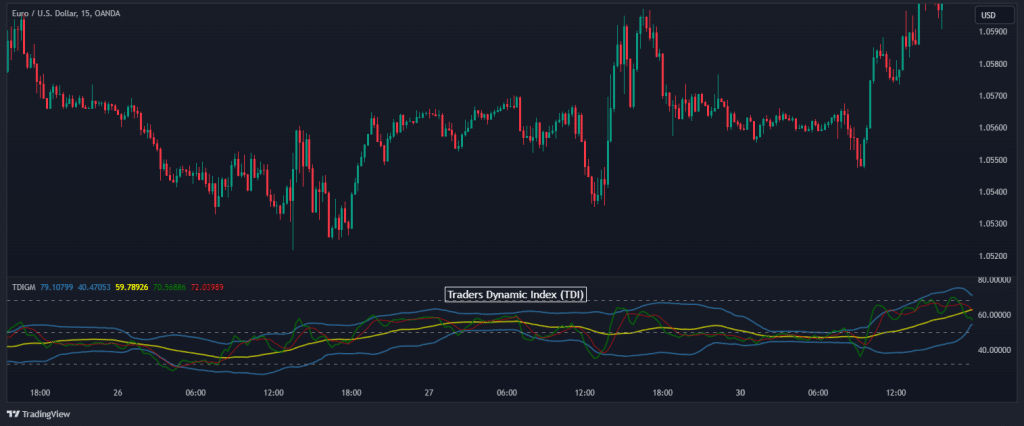
The Traders Dynamic Index (TDI) Indicator is a versatile and comprehensive tool used to analyze market conditions and assist traders in making informed decisions. The TDI, conceptualized and developed by Dean Malone, combines several different indicators into one. This integration makes it a favored choice among traders, including those who follow the Beat the Market Maker (BTMM) method.
The Indicator is designed to identify the current market trend and its strength. It incorporates elements such as the Relative Strength Index (RSI), moving averages, and Bollinger Bands. The TDI is usually added to a chart as a sub-chart, appearing below the main trading chart. This placement allows traders to view the TDI analysis in conjunction with the price action on the main chart, facilitating a comprehensive market analysis.
One of the key components of the TDI is the RSI, which is plotted along with two volatility bands and moving averages. The RSI value is crucial; if it is above 68, it often indicates an overbought condition, whereas a value below 32 suggests an oversold condition. The moving average crossover within the TDI provides additional insights. For instance, when the signal line crosses above the RSI line, it might indicate a potential upward trend and vice versa.
In the context of BTMM traders, the TDI is particularly valuable. It helps in understanding the cyclical nature of the markets, which is a cornerstone of the BTMM philosophy. This approach emphasizes the importance of timing in trading, aligning trades with the natural flow of the market.
Overall, the Traders Dynamic Index stands out as more than just an average indicator. Its ability to provide a comprehensive analysis by combining various market factors makes it a valuable asset for traders.
Key Components of the Traders Dynamic Index Indicator
Understanding how to read and interpret the TDI’s different components is crucial for leveraging its full potential.
The TDI consists of several essential parts, each serving a specific function:
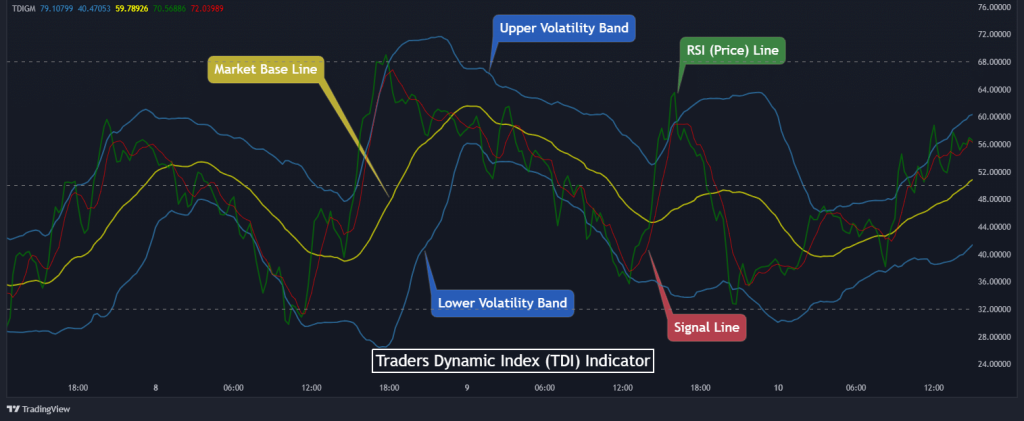
- Market Base Line (MBL): The MBL is a critical component of the TDI, representing the long-term market trend. It’s typically depicted as a yellow line and helps traders assess the overall direction of the market.
- Volatility Bands: These Bollinger bands (blue lines), often drawn above and below the MBL, indicate market volatility. A wider gap between the bands suggests higher volatility, while a narrow gap indicates lower volatility.
- RSI Line: The RSI (Or Price) line, usually a green line, is pivotal in the TDI. It indicates the current market momentum and is vital for short-term market analysis.
- Signal Line: This is the red moving average, providing signals for potential trend reversals or continuations.
The indicator represents these components as green, blue, red, and yellow lines on the chart.
The TDI values – 68, 50, and 32 – also play a significant role in market analysis:
- Above 68: This typically indicates an overbought market condition, suggesting a potential reversal or pullback in price.
- Below 32: Conversely, a reading below 32 often signals an oversold market condition, hinting at a potential upward price movement.
- Around 50: This is a neutral zone, indicating neither a strong bullish nor bearish market.
How to Use the Traders Dynamic Index (TDI) Indicator?
Traders use the TDI for various purposes. Here are some:
1. Spotting Divergence
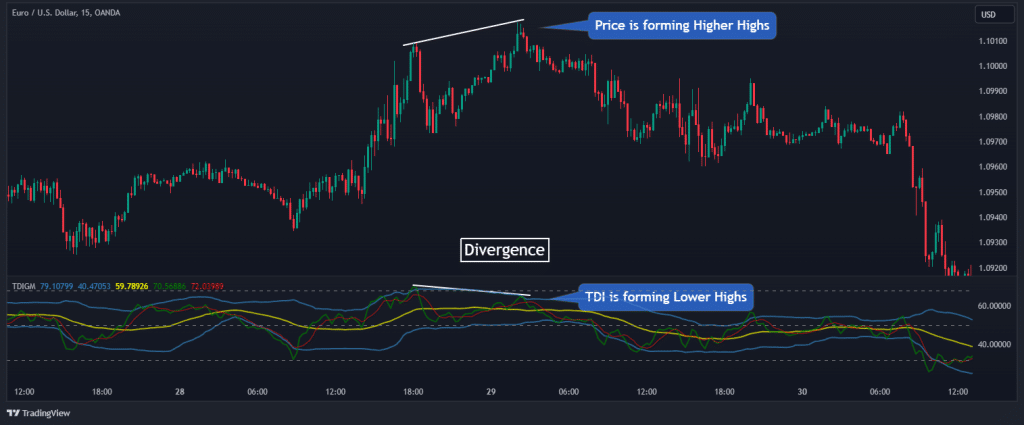
Trends don’t last forever. One extremely effective method to identify trade opportunities is by finding divergences between an indicator and the asset’s price action. For those who are not familiar with the term, a divergence in forex trading is a scenario when the indicator and the asset move in opposite directions.
For example, as you can see in the chart below, observing the divergence between the TDI and the price action can help traders identify potential trend reversals.
Understanding how to spot divergence is essential when trying to trade reversals with the TDI trading strategy; for more about spotting divergences, including a downloadable divergence cheat sheet, take a look at our article on the topic here.
2. Identifying Stop Hunts
Similar to the Smart Money Concept philosophy, most TDI traders believe that institutional traders usually set traps for retail traders to fall into while trading. So, the TDI can help identify false market moves, often referred to as stop hunts, which are temporary movements intended to trigger stop-loss orders.
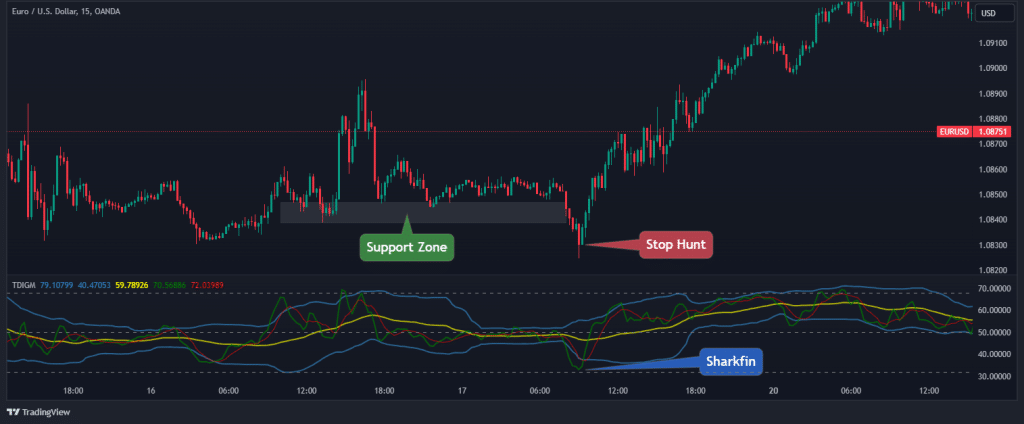
These stop hunts are recognized by a particular TDI setup, popularly called “shark fin.” This setup, as shown in the chart above, is detected when the RSI line comes out of the volatility bands and quickly goes back into the volatility bands, signifying that the market makers have “stop hunted” the retail traders.
3. Reading Price Volatility
The volatility bands of the TDI also provide crucial insights into the market’s volatility and market sentiment, helping traders adjust their strategies accordingly. For that matter, many TDI traders use the TDI volatility bands to utilize the volume trading strategy.
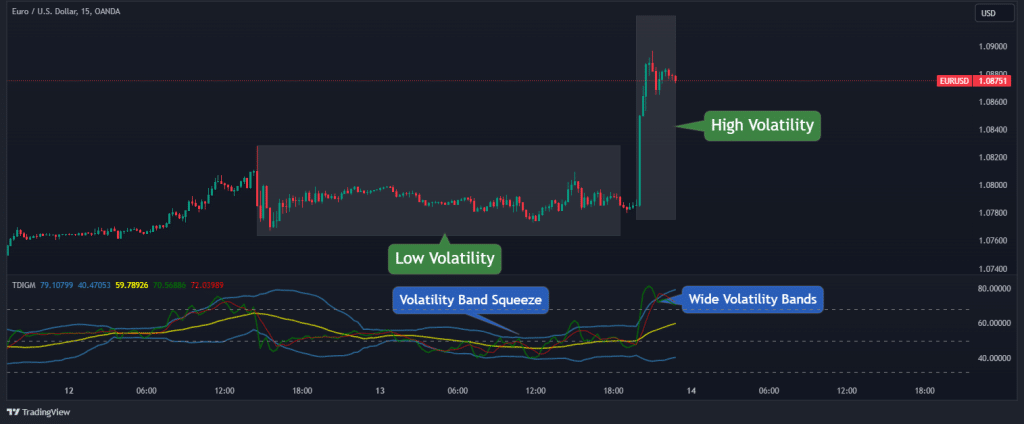
As seen in the chart above, a volatility squeeze suggests that the volatility of the market is low (and a breakout is imminent). In contrast, wide volatility bands suggest that the volatility is high.
4. Determining Entry and Exit Points
Finally, the crossovers and positions of the RSI and signal lines within the TDI provide clear signals for entering or exiting a trade. Simply put, when the green line crosses above and below the red line, a signal is given.
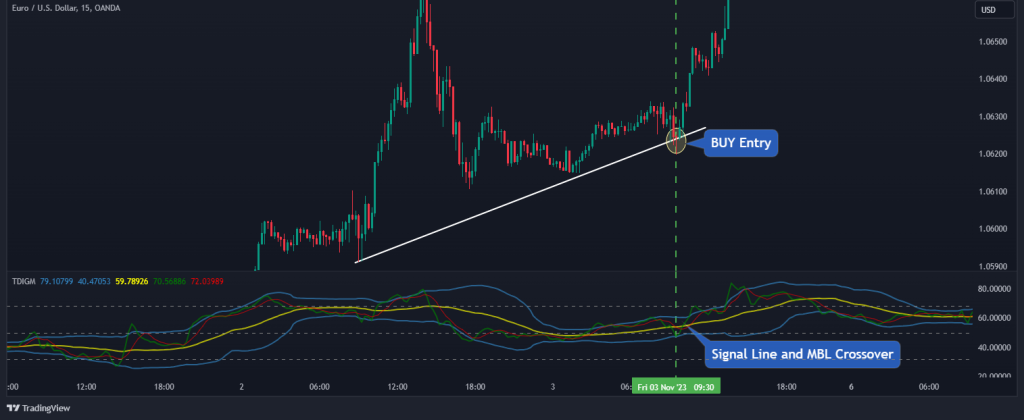
Although it is not advisable to primarily determine your entry and exit points using an indicator, using the TDI as a confluence trading tool for your entry and exit setups will instantly level up your trading game.
In essence, the Traders Dynamic Index is more than just a tool for identifying market trends; as you can conclude from the above, it’s a multi-faceted indicator that offers deep insights into market psychology, momentum, and volatility. So, mastering the TDI can enhance your ability to make informed decisions and improve your overall trading performance.
The TDI Indicator Trading Strategy in 4 Steps
Traders with various experience levels find the TDI to be a vital part of their trading system. Being such a versatile tool, different traders tend to use it in very different ways.
But in this section, we will provide you with the simplest and one of the most effective ways of using the TDI trading strategy.
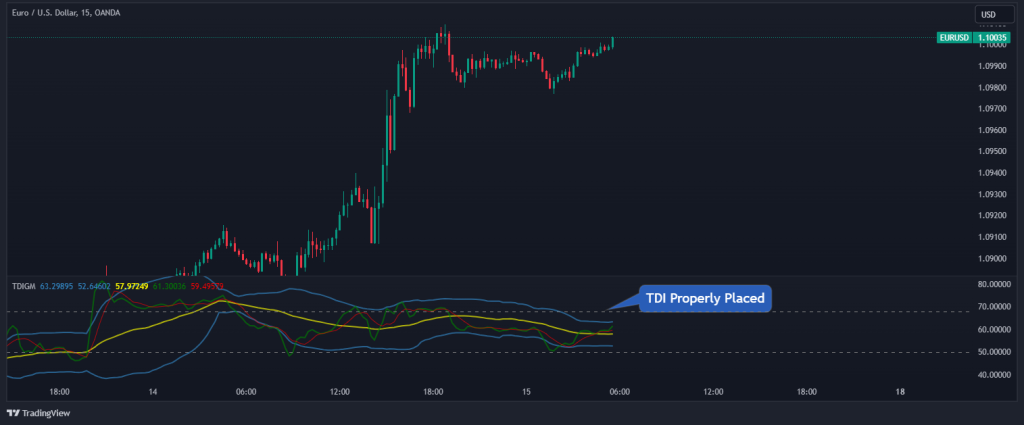
Step 1: Setting Up The Traders Dynamic Index Indicator On Your Chart
The first and obvious thing to do when starting with this strategy is to add the TDI Indicator to your chart, which is quite a challenge on its own. For example, on MT4/5, you must download the indicator on a third-party application and manually add it to your platform. On TradingView, you can choose the first option that pops up when you search for the TDI indicator.
Also, keep in mind that different traders use different settings for their RSI lines. Some use the 13th period, while others use the 21st period. Either way, you must ensure a clear view of the RSI line, Market Base Line (MBL), and the volatility bands.
Step 2: Identify the Overall Market Trend Using the MBL
We have earlier discussed the role of the yellow Market Base Line in giving us a hint as regards the overall market trend. So, if the MBL is trending upwards, you should focus on finding buy signals. Conversely, if the MBL is trending downwards, look for sell signals.
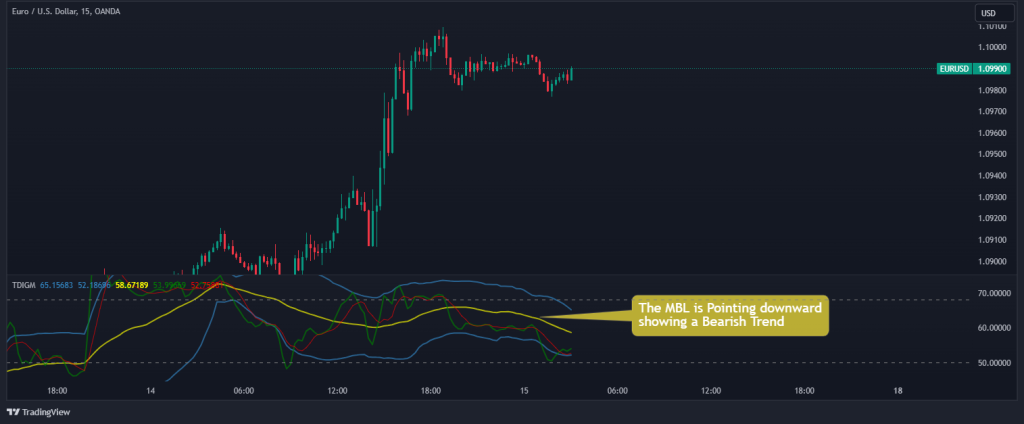
From the chart above, it is clear that the MBL is pointing downward, showing us the higher timeframe narrative on this pair is bearish. Hence, we can start looking to sell this asset.
Step 3: Wait for the RSI Line to Cross below the MBL but NOT Below the Lower Volatility Band
Knowing the overall trend is not enough reason to jump into a position. The key to this strategy is to wait for the RSI line to cross below or above the MBL.
- For a buy signal, the RSI line should cross above the MBL.
- For a sell signal, the RSI line should cross below the MBL.
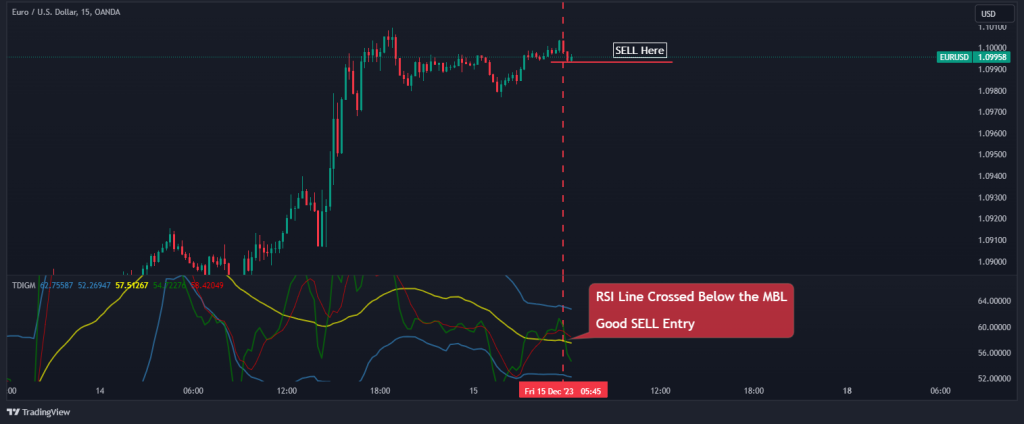
In our example, since we are looking for a sell entry, we simply wait for the RSI line to cross below the MBL but NOT below the lower volatility band. This move suggests that the current price action is ready to move together with the overall trend, presenting us with a high probability short-sell setup.
Step 4: Setting Stop Loss and Take Profit
Now that we are in the trade, how do we manage our position? In our case, place the stop loss just above the most recent swing high.
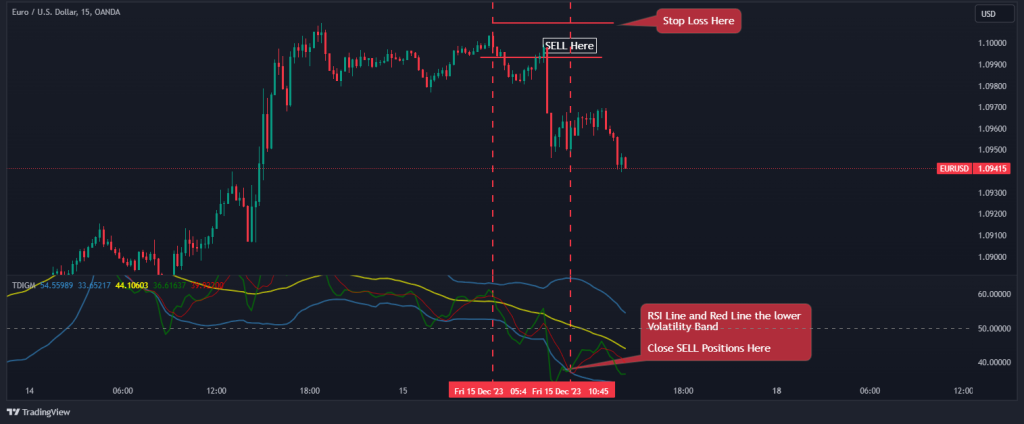
You can also set take profit at a fixed pip amount, or you can wait for the RSI line and the Red Line to reach the lower volatility band before exiting, as shown in the example above.
Traders Dynamic Index PDF Free Download
If you need something to easily carry around and refer to when it comes to TDI trading, this PDF is for you:
Traders Dynamic Index PDF Free Download
Does the TDI indicator repaint?
The Traders Dynamic Index Indicator on the MT4 and MT5 trading platforms repaints. It repaints, which makes it hard to trust its signals. It edits past signals, something that no indicator should do. So does this make the TDI completely useless? No. C’mon. We have a whole blog post on it, so there has to be something in it.
There are non-repainting versions of the TDI on TradingView. You’ll find many of them on TradingView. You can use those as we’ve described in this post. Of course, don’t expect it to be 100%. Even the non-repainting version should be used in conjunction with other indicators.
Traders Dynamic Index Indicator – Pros and Cons
Understanding both the strengths and weaknesses of the Traders Dynamic Index Indicator is essential for traders aiming to utilize it effectively in their trading strategy. Here are some important pros and cons to be aware of:
Benefits of Using the Traders Dynamic Index Indicator
One of the major benefits of the TDI is its ability to combine multiple indicators into one, thereby providing a holistic market perspective. This integration of the TDI indicator allows traders to see the big picture and make informed decisions. Another significant advantage is its versatility. The TDI is suitable for various trading styles and timeframes, making it a valuable tool for both short-term day traders and long-term investors.
Pros
- Integrates multiple indicators, offering a broad view of the market
- Suitable for different trading styles and timeframes
- It helps identify market trends and potential reversals
- Despite its complexity, it is relatively easy to interpret and use
Limitations of the Traders Dynamic Index Indicator
Like any trading tool, the Traders Dynamic Index Indicator is not without its limitations. For instance, due to the combination of various indicators, the TDI can sometimes provide too much information, which may be overwhelming, especially for new traders. Another limitation is its reactive nature. As with most technical indicators, the TDI is based on historical data and might not always accurately predict future market movements.
Cons
- It can be overwhelming due to the amount of data presented
- The data is based on historical data, which may not always forecast future trends accurately
- May provide signals after the optimal entry or exit point has passed
Risk Disclosure: The information provided in this article is not intended to give financial advice, recommend investments, guarantee profits, or shield you from losses. Our content is only for informational purposes and to help you understand the risks and complexity of these markets by providing objective analysis. Before trading, carefully consider your experience, financial goals, and risk tolerance. Trading involves significant potential for financial loss and isn't suitable for everyone.


