The Williams Alligator indicator is a trend trading indicator that uses three moving average lines to predict potential trade entry and exit points during market trends. The crossover is one of the most common trading strategies with this indicator. But you can also trade trend confirmations and candlestick breakouts with it.
- The Alligator indicator is a technical analysis tool that helps traders identify trends and consolidations.
- It uses three moving average lines to give potential buy and sell signals.
- The indicator’s signals are more reliable when the alligator is awake than when it is asleep.
Without further ado, here’s everything you need to know about the Bill Williams Alligator indicator, its trading strategies, and real examples of this indicator in charts.
 Table of Contents
- What is the William Alligator Indicator?
- How Does the William Alligator Indicator Work?
- How to Use the Alligator Indicator in Trading?
- Williams Alligator Indicator Trading Strategy Tutorial
- What are the Benefits and Limitations of the William Alligator Indicator?
- Key takeaways
- Frequently asked questions
What is the Williams Alligator Indicator?
Developed in 1995 by the professional trader Bill Williams, the Alligator indicator has since become one of the favorite indicators among forex traders. The indicator uses three smoothed moving average lines to determine market trends to provide long and short trading signals.
Theoretically, Bill Williams believed that the market only moved in trends 15% to 30% of the time. The rest of the time, it moves inside a range. He also believed that it is in these scarce trends that the trader has the highest chance of making money.
So, this indicator is his attempt to show traders when the market is trending with many trading opportunities and when it is locked in a range. It is, therefore, the perfect indicator to trade ranges as well as utilize the range trading strategy. As a matter of fact, many of Bill Williams’ indicators also follow this idea.
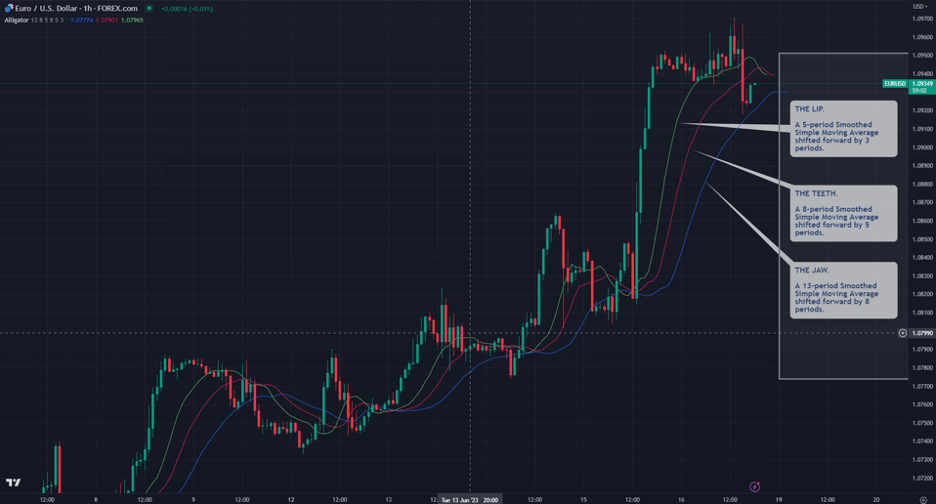
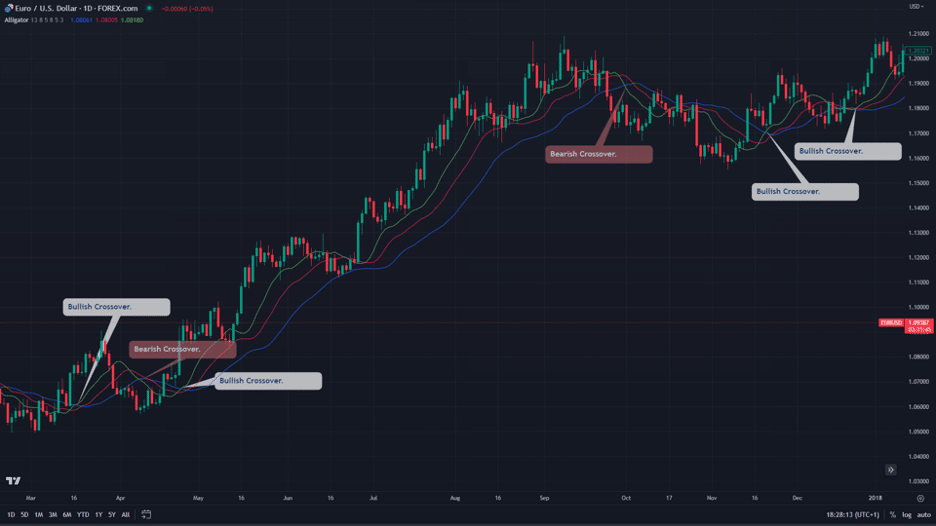
Here’s what the Alligator indicator looks like on a price chart:

In terms of display, the Williams Alligator indicator overlays on your chart. It doesn’t need to create a separate window for itself and appears as an extra indicator on your main chart. Also, the indicator comes custom-built into TradingView, MT4, and MT5, three of the most popular trading platforms. So, you should have no issues locating and using it.
How Does the Williams Alligator Indicator Work?
Unlike other technical indicators, the William Alligator indicator is easy to use. When you open it, it appears as three lines (red, green, and blue) that constantly cross over one another as trends change. Each line has dramatic names from the body parts of the alligator animal.
Bill Williams called the blue line the Alligator’s Jaw. The Jaw is just a smoothed simple moving average with a period of 13, shifted forward by 8 bars. The red line is called the teeth, a smoothed simple average with a period of 8 and shifted forward by 5 bars. Finally, the green line called the lip, is also a smoothed moving average with a period of 5 shifted forward by 3 bars.
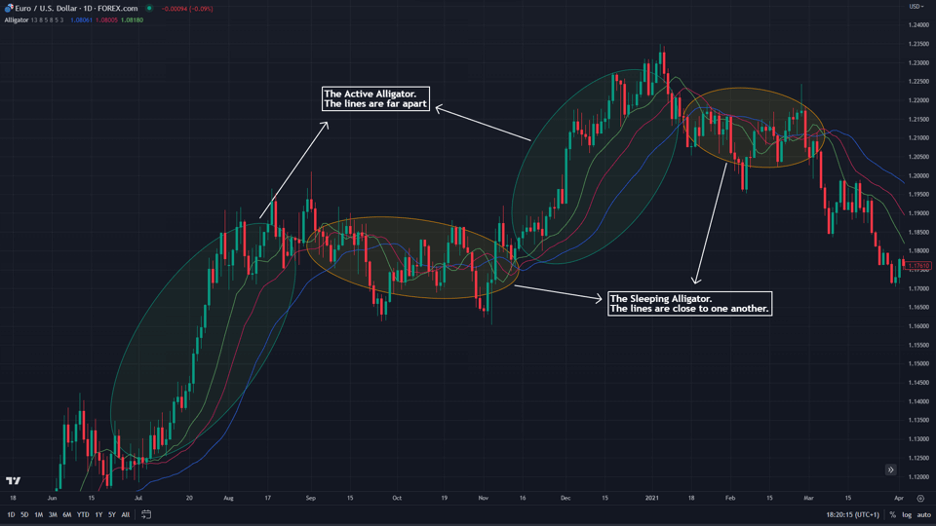
When the alligator’s lip, teeth, and jaw are close, Bill Williams says the alligator is ‘sleeping’. Hence, its signals are prone to be false. But when the lines are far apart, the alligator is said to be awake and, therefore, it provides trading signals.
By the way, the periods of these smoothed simple moving averages were not chosen randomly; Those are numbers based on the Fibonacci sequence. In the Fibonacci sequence, the first two numbers are 0 and 1, and the following number is the sum of the two numbers immediately before it.
Fibonacci numbers are special because they seem to have an uncanny ability to appear in nature, either directly or indirectly. For instance, the ratio of any two numbers in that sequence, apart from 1, 2, and 3, is always 1.618, or a number creepily close to that. In fact, that ratio is called the golden ratio.
In nature, if you divide the length of your shoulder to the tip of your finger by the length of your elbow to the tip of your finger, you get the same golden ratio. Try it. These numbers are unique, and it’s no surprise that Bill Williams used them in his indicator.
However, an important thing to note when backtesting the indicator is that it looks like a heavily lagging indicator at first glance. But remember that the indicators have been shifted by a number of periods into the future. So, whatever signal you had when backtesting was actually for the candlesticks a few periods back.
How to Use the Alligator Indicator in Trading?
Having learned about the Williams Alligator, let’s discuss how you would use it in trading.
But first, here’s a quick explanation of how to add it to your chart in TradingView or MetaTrader4/5.
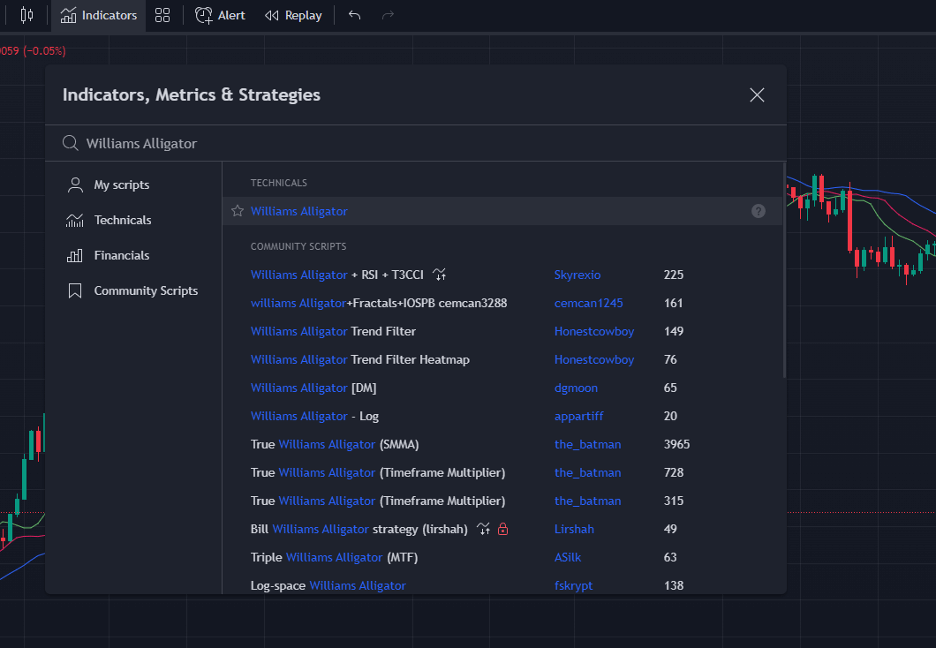
Open the chart of the asset you want to trade on your TradingView, and then open the “Indicators” tab at the top of the chart. In the search box that comes up, search for Williams Alligator and open it.
Remember that this indicator appears on your chart as three lines constantly crossing over one another. Take note of these crossovers because they bear your trading signals.
And if you’re on your MT4 or MT5, navigate to your Indicators menu. You can find this indicator under your “Navigations” section or by choosing “Indicators” from the “Insert” tab. The next thing to do now is select “Bill Williams” then “Alligator.”
Now, let’s see the different use cases to successfully utilize the alligator indicator.
1. Crossover Trading
This is perhaps the most straightforward Bill Williams Alligator strategy, and its rules are simple. Buy when the lip of the alligator, or the green line, crosses over the jaw (blue line) and the teeth (red line) to the upside. Similarly, a sell signal is given when the lip crosses the jaw and the teeth to the downside.
2. Identify Trend Reversals and Continuations
Another way to use the Williams Alligator indicator is to identify trend reversals and continuations by looking at the three lines. When they are wide apart, it means a trend is in full force. But when constricted, it signals that a trend is about to end or that the market is in consolidation.
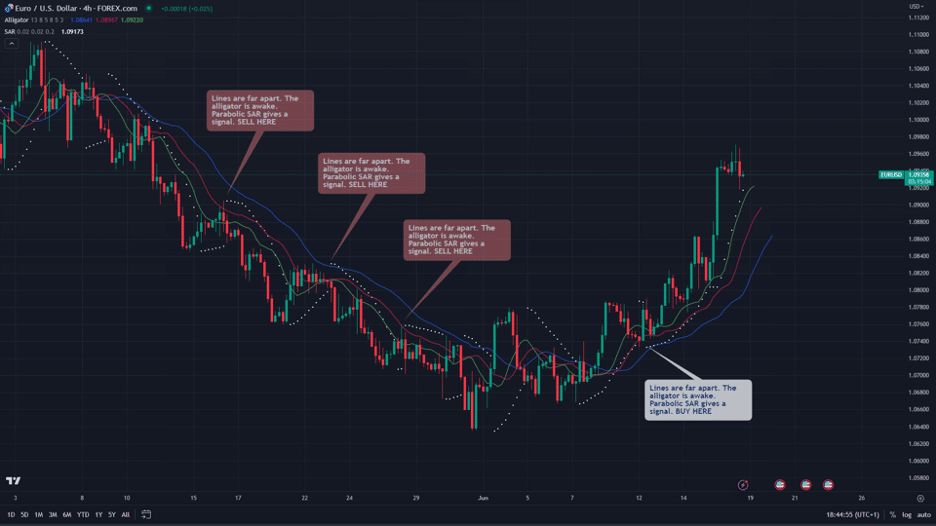
Trend traders will immediately find this helpful because they can easily combine the indicator with other indicators or price action strategies to make a trading system. And the rules are simple:
- When the lines are far apart, the trend is in full force. When that happens, scout for trend trading opportunities.
- When the lines are constricted, steer clear of the market until the lines open up again.
Breakout of the Lip
The lip of the alligator indicator (the green line) is the most active and dynamic of the three lines. However, it sometimes doesn’t cross the other lines fast enough to give signals. And that’s why some traders rely on the Alligator breakout strategy.
The rules are these:
- Buy when a bullish breakout of the green line appears.
- Sell when a bearish breakout of the green line appears.
Here’s an example of the Alligator indicator breakout trading strategy.
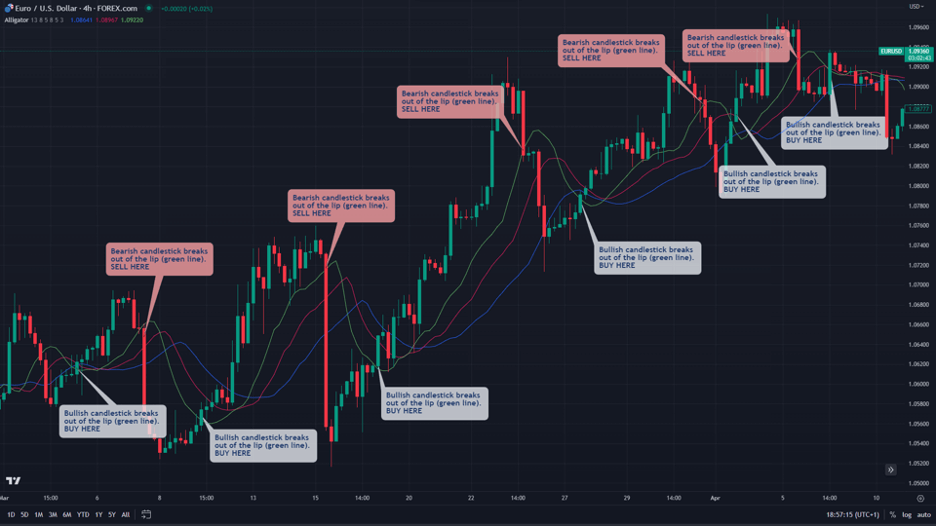
But be careful; this is an aggressive strategy. It could get you into trends early but also get you into trouble with false signals just as often. As such, it is best to use a tight stop loss and combine this strategy with other technical indicators.
Williams Alligator Indicator Trading Strategy Tutorial
Here’s a step-by-step guide to using the William Alligator indicator trading strategy:
Step 1: Add the Indicator
First, you need to add the Williams Alligator indicator to your price chart. The indicator is available on the popular MetaTrader trading platforms MT4 and MT5. You’ll find it when you open the list of your Indicators and Bill Williams from there.
You can also find the indicator when you open the “Indicators” tab on your TradingView and search for it.
Step 2: Find Buy and Sell Signals and Enter a Trade
This is where you refer to any of the Williams Alligator trading strategies we discussed. You could use the crossover, the breakout, or even combine the indicator with other indicators to identify trading opportunities.
In the chart below, for instance, we’re using the breakout strategy on the EURUSD 4-hour chart. We wait for the candlestick to complete a breakout of the lip, and we open an appropriate position; hence, a long buying position.

Step 3: Place Stop Loss and Take Profit Target
Your trade management strategy depends on your preferred Alligator indicator strategy. For instance, if you use the crossover for your trade entries, you can also use it to exit the trades. That’s, perhaps, the easiest way to set stop loss and take profit levels: by entering at one crossover and exiting at the next crossover.
For example, you can exit your buy positions when the lip of the alligator crosses the teeth and the jaw to the bottom side. Similarly, exit all sell positions when the lip of the alligator indicator crosses the teeth and the jaw to the upside.
While that trade management strategy is the easiest, it isn’t usually the most practical strategy. Other ways to set your targets include using market structures and price action tools, such as support and resistance levels. You can also rely on indicators, such as the Fibonacci extension and retracement.
What are the Benefits and Limitations of the William Alligator Indicator?
Like all indicators and technical analysis tools, the alligator indicator has scenarios where it shines the best. Likewise, it has some situations where it is more of a burden than an asset. So, here are some of the pros and cons of the alligator indicator:
Benefits of Using the Alligator Indicator
Pros
- Trend traders will immediately find it useful because it gives trade entry signals and tells you when a trend is active or ending
- It fits into various trading systems because of the various strategies you can trade it with. Some of the strategies you can use with the alligator indicator include crossover, breakout, and trend continuations
- You can tweak the alligator indicator settings to make it even more suitable for your trading style or your preferred time frame
Limitations of the Alligator Indicator
Cons
- It is exclusively a trend trading indicator. If you try to trade it when the market is consolidating, you will likely lose over the long term. The Alligator indicator is very useless outside of trending markets
Key Takeaways
 Key Takeaways
- The Williams Alligator indicator is a technical indicator for identifying trends and predicting potential trade entry opportunities.
- It appears on the chart as three lines—the jaw, teeth, and lips, which are smoothed simple moving averages—constantly crossing one another.
- Some of the ways to use the alligator indicator include crossovers, breakouts, and trend continuations.
- The indicator is best used in trending markets. The frequency of its false signals increases, though, when the market is consolidating.
Frequently Asked Questions About Trading the Alligator Indicator
Here are some of the frequently asked questions about the Williams Alligator indicator.
What are the best settings for the alligator indicator?
The default settings of the alligator indicator are great for most trading scenarios. However, if you want something that suits your trading strategy, you might have to do some tweaking yourself to find what works for your system. For example, longer periods typically work better for swing and position traders, while short periods are ideal for scalping and the day trading strategy.
How accurate is the alligator indicator?
The Alligator indicator is not accurate all the time. It has a lot of false signals, especially when the alligator is asleep. Also, the accuracy of the indicator depends on how you use it. So, it is hard to place a figure on it and say, “The Alligator indicator is this percent accurate, or that percent accurate.” Having said that, if used properly, the Alligator indicator is certainly considered an accurate and reliable indicator.
What is the formula of the alligator indicator?
The Williams Alligator indicator uses smoothed; simple moving averages shifted by a number of periods into the future. The green line called the lip of the alligator, is a 5-period SMMA shifted by three periods into the future. The red line is an 8-period SMMA shifted by five periods into the future, called the teeth. Finally, the blue line is called the jaw of the alligator, and it is a 13-period SMMA shifted forward by eight periods.
Risk Disclosure: The information provided in this article is not intended to give financial advice, recommend investments, guarantee profits, or shield you from losses. Our content is only for informational purposes and to help you understand the risks and complexity of these markets by providing objective analysis. Before trading, carefully consider your experience, financial goals, and risk tolerance. Trading involves significant potential for financial loss and isn't suitable for everyone.


