


When you first start learning to trade, you often hear about Doji candlestick patterns. These unique candle patterns indicate indecision, a tussle between bulls and bears. But not every Doji is similar; some are different from others. One of them is the Morning Doji Star candlestick pattern, which is an effective trend reversal chart pattern.
- The Doji Morning Star pattern is a key indicator of potential market reversals.
- This pattern plays a crucial role in forecasting market price movements.
- Specific entry and exit strategies are often developed around the Doji Morning Star pattern.
So, if you want to add another tool to your trading arsenal, this guide is for you. Here, we’ll explain the Doji Morning Star pattern and how you can trade with it.
What is the Doji Morning Star Candlestick Chart Pattern?
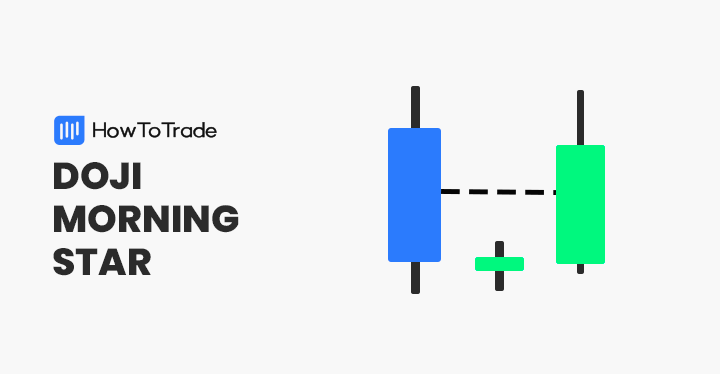
The Doji Morning Star is a three-candle pattern that signals a bullish trend reversal. It appears in a downtrend and forms a small wick on the upper and lower end. In the Encyclopedia of Candlestick charts, Thomas Bulkowski first introduced the pattern to the Western world.
The idea behind the Doji Morning Star is that the bearish momentum is about to end, and the bulls will take charge soon. It is the opposite version of the Evening Star candle pattern that appears at the end of an uptrend and signals a bearish trend reversal.
The middle candle, which is a Doji Morning Star, shows the market’s indecision. Then, the third bullish candle appearing after the middle candle confirms that bullish momentum is likely to begin.
The question is how the Doji Morning Star differs from the traditional Doji. Basically, the traditional Doji candlestick indicates market indecision, while the Morning Star signals the likelihood of a bullish reversal. Also, the Doji pattern may appear in an uptrend or downtrend, while the Doji Morning Star only appears in a downtrend.
How to Identify the Doji Morning Star Candlestick Pattern in Trading?
Identifying the Doji morning star candle pattern is relatively simple as the formation includes just three candlesticks.
Firstly, a long bearish candle is formed, which signals a continuation of the previous downward price trend. Then, we have the middle Doji morning star candlestick, which has a very small body and long upper wick.
However, note that the Doji Morning Star usually does not have the exact opening and closing price. Finally, a third bullish candle is formed, which confirms the beginning of a new uptrend. Let’s see what the pattern looks like on a price chart:
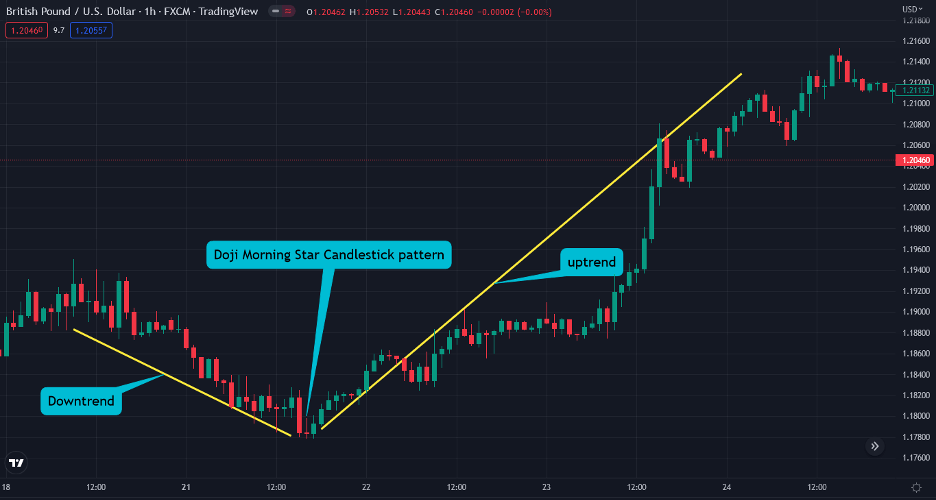
In the chart above, you can see the market trend reversal following the formation of the Doji Morning Star. Here, you’ll enter a long position when you notice the last bullish candle.
Considering the above, here are some tips to easily identify and trade the morning star Doji pattern.
- Look for the pattern in a downward trend.
- The first candle must be bearish. The second candle is the Doji morning star candle which appears with a small body and long upper wick.
- The third candle following Doji morning star should be bullish.
- Wait for the confirmation from another technical analysis tool or enter the trade once the next candle following the third candle is completed.
How to Trade the Doji Morning Star Pattern (2 Trading Strategies Included)
The Doji Morning Star is an effective pattern, but as we said earlier, some traders need clarification when they locate this candlestick pattern.
So, what’s the solution? To avoid false signals, the most effective way is to confirm the trend reversal with other technical indicators. Such tools include the RSI (relative strength index) or MACD (Moving Average Convergence Divergence). Here, we’ll explain how to confirm the Doji morning star candle pattern with both indicators.
1. Relative Strength Index (RSI) and Doji Morning Star Pattern
The RSI is one of the most widely used and popular technical analysis indicators. It indicates overbought and oversold levels and can tell key divergences in price action. Moreover, combining the indicator with the Doji Morning Star adds a confluence in that anticipated move and confirms the direction of the trend.
Check the example in this screenshot:
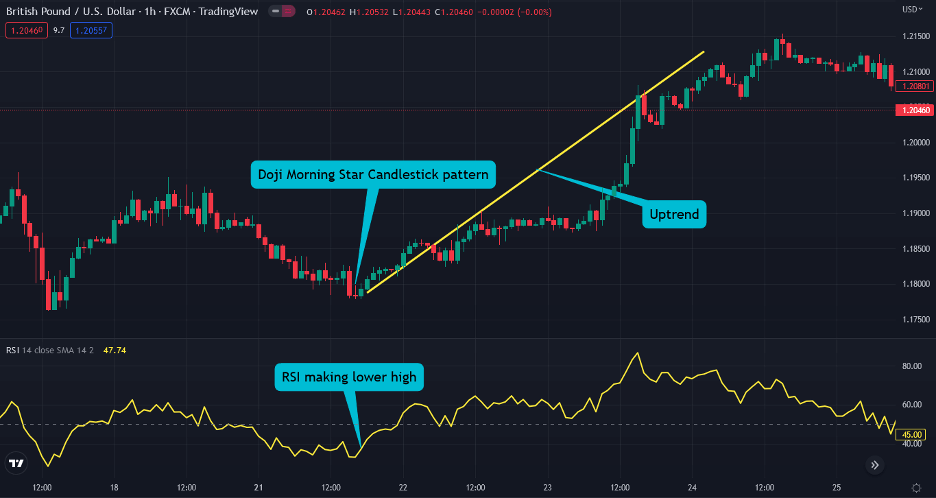
On the above GBP/USD chart, you can see a Doji morning star pattern along with the RSI. Note that the RSI provides an extra signal to enter a long position when the third bullish candle is formed following the Morning Star Doji. As such, when the RSI shows that the bearish momentum is changing and the price action shows the same, you get a strong signal to enter the trade, knowing that it’ll continue upwards.
As for our entry point, we’ll enter the trade after the confirmation candle. Some traders like to enter a trade immediately after the formation of the Doji Morning Star; however, it’s best to wait and check the RSI if it rises above 30 (or 50, for that matter).
Furthermore, you can place a stop-loss order at the lowest price level of the Doji Morning Star or at the lowest price level of the recent swing low. Finally, for take-profit, you can set it at the recent high or exit the trade when the RSI makes a bearish divergence (price making higher highs while the RSI makes higher lows).
2. MACD and Doji Morning Star Pattern
The MACD (Moving average convergence/divergence) works similarly to the RSI indicator, and you can use it the same way to confirm the Doji morning star pattern. In addition to divergences, you can also wait for the MACD signal line and the histogram bars to show momentum changes.
Here’s how it works. You first confirm the Doji Morning Star and look at the MACD histogram and the signal line. Then, you can enter the trade when the MACD histogram bars and the signal line rises above zero, and there’s a crossover of the two MACD moving averages.
Once again, you can set the stop-loss at the lowest price level of the Doji Morning Star candlestick or the recent low of the bearish price swing. For take-profit, you can place an order at the recent high or when the MACD shows a slowing bullish momentum.
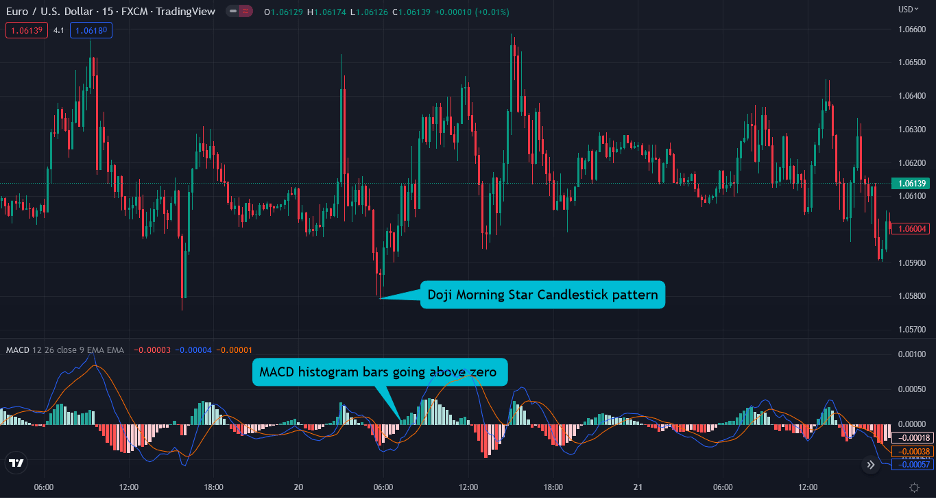
Now, to increase the chances of success, you can also combine a volume indicator with the Doji Morning Star pattern. Here, in the EUR/USD chart, you can see how increasing trading volume at the exact time of the formation of the Doji morning star provides another signal to enter a buying trade.

The Doji Morning Star Candlestick Chart Pattern – Pros and Cons
Like any other chart pattern, the Doji Morning Star has pros and cons. So, let’s take a quick look at the pros and cons of the pattern.
Pros
- The Doji Morning Star is an accurate chart formation of a bullish trend reversal
- Entry points and a stop loss order are well defined
- When combined with indicators like MACD and RSI, the Doji Morning Star may provide an accurate trading signal
Cons
- The Doji morning star does not frequently occur in the markets
- Sometimes the price may continue with the downtrend providing false signals, despite the appearance of the Doji morning star
Key Takeaways
In a nutshell, here are the main takeaways from trading the Doji morning star candlestick pattern.
- The Doji Morning Star is a single-candlestick bullish reversal pattern that occurs during a downtrend and often signals a trend reversal
- The pattern is made of three candles – a first long bearish candlestick followed by a middle Doji morning star candle and a third bullish candlestick
- When the Doji Morning Star forms, a bullish trading signal is given
- It’s best to combine additional indicators like the RSI or MACD for further signal confirmation
- Upon entering the trade, you can also combine a volume indicator for further confirmation
Frequently Asked Questions (FAQs)
Here are some of the most frequently asked questions about the bull flag pattern in forex:
What does a Doji morning star candlestick indicate?
The Doji Morning Star indicates a bullish reversal following a downward trend. As such, it appears at the end of a downtrend and suggests that sellers are losing momentum.
What is the difference between a Doji morning star and the morning star candle pattern?
Like the Doji star candle pattern, the morning Doji star pattern also appears in a downtrend and indicates a bullish reversal. However, the difference comes in the shape of the body of the middle candle, hence the Doji candle. In Doji Morning Star, the opening and closing prices are not the same, while in the Doji Star pattern, it usually has the exact opening and closing price, making it look similar to the letter + sign.
Is the Morning Doji Star candle pattern bullish?
Yes, the Doji Morning Star is a bullish trend reversal pattern.
Risk Disclosure: The information provided in this article is not intended to give financial advice, recommend investments, guarantee profits, or shield you from losses. Our content is only for informational purposes and to help you understand the risks and complexity of these markets by providing objective analysis. Before trading, carefully consider your experience, financial goals, and risk tolerance. Trading involves significant potential for financial loss and isn't suitable for everyone.


