Using Fibonacci Retracement with Candlesticks
By now, you know how to combine the Fibonacci retracement tool with support and resistance levels and trend lines to create a simple but super awesome Fibonacci trading strategy.
So, continuing from where we stopped, this chapter will show you how to use various candlestick formations in combination with Fibonacci retracement levels and what you should be looking for to increase your chances of success in forex trading.
The Fibonacci Retracement Tool & Candlestick Patterns
As you already know, candlestick patterns are reliable signals of a price-action reversal. Usually, when a reversal candlestick pattern appears when the price collides at the Fibonacci retracement level, the signal to enter or exit a trade is much stronger.
Therefore, reversal candlestick patterns combined with Fibonacci retracement levels portray a strong signal that the price is likely to change direction. When combined, the goal is to look for exhaustive candlesticks like a hammer or a shooting star Japanese candlestick formations. Why?
It’s simple. If you can tell when buying pressure or selling pressure is exhausted, it can tell you the ultimate direction of the trend. For example, below is a 4-hour price chart of EUR/USD.
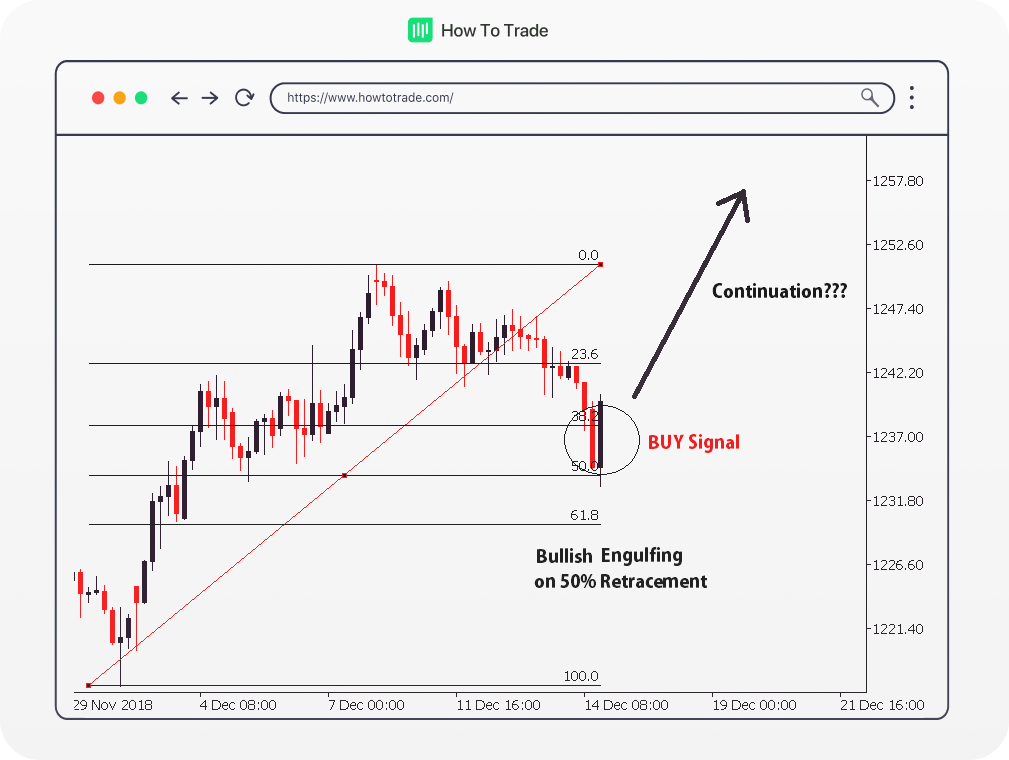
As you can see in the above chart, the currency pair seems to have been in an uptrend for the past couple of hours, but the move seems to have paused for a bit. Will there be a chance to get in on this uptrend? Let’s put the Fibonacci tool to work!
Observing the chart, you’ll notice we’ve identified our Swing Low and Swing High points and accordingly drawn the Fibonacci retracement levels. We can see a candlestick pattern formation on the Fibonacci levels. It seems that it formed a bullish engulfing pattern precisely at the 38.2 Fibonacci support level.
Does this serve as a confirmation for a buy signal? Yes, it appears to be a strong indicator. Let’s take a look at what happened afterward.
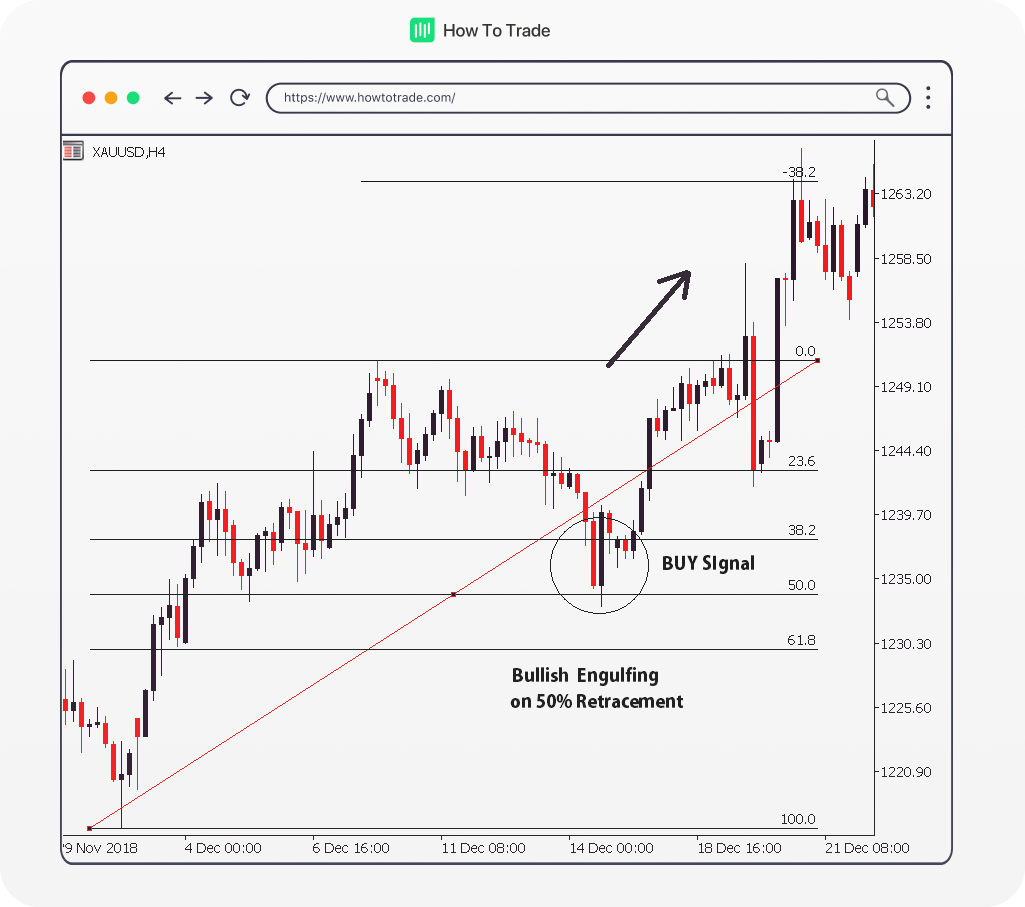
You can see the Fibonacci retracement level held well when the reversal candlestick pattern appears at 23.6% Fibonacci sequence level. From there, the market continued to move to trade in an upward direction until the Fibonacci extension level reached the level of -38.2%. This could be interpreted as an additional confirmation that the price trend is expected to continue.
Placing your order around these Fibonacci levels would likely have resulted in a favorable outcome!
Key Takeaways
- Using reversal candlestick patterns in conjunction with Fibonacci retracement levels offers stronger signals for potential price direction changes in forex trading.
- Recognizing exhaustive candlesticks like hammers or shooting stars at Fibonacci levels can indicate when buying or selling pressure is diminishing, suggesting possible trend continuations.
- The effectiveness of Fibonacci retracement analysis is heightened when used with Japanese candlestick charts, which are essential for identifying critical price points in forex trading.
The Bottom Line
Mastering the combination of Fibonacci retracement levels with other technical indicator and tools, such as the Japanese candlesticks, will unveil many minor and significant trading opportunities for a forex trader. Remember, Fibonacci numbers are used by many traders in the forex market. As such, these horizontal lines that become extremely important price levels can help you pick out price trends and find potential support and resistance levels.
Now, proceed to the next lesson, and don’t forget to download our comprehensive Fibonacci levels cheat sheet for quick reference.


Trade 1 Lot for just $2.5 commission*
- Trade 1,000’s of global markets.
- 0% deposit and withdrawal fees.
- Rapid funding turn-around times.
- Trade on MetaTrader 4 and 5.