- MSS is a technical pattern indicating a potential trend reversal, where prices break past recent highs or lows, signaling a possibility of trend reversal.
- As a strategy, the market structure shift represents a collective shift in market sentiment, where the underlying fundamentals or trader perceptions have changed, driving the market in a new direction.
- Order blocks, fair value gaps, the break of structure, and RSI readings can help traders find entry and exit points when an MSS is identified.
The ability to read and react to what is happening in the market can be the difference between failure and success in your trading journey. For instance, what do you do when a trend changes? How do you even know if a reversal is about to happen? That’s where the market structure shift comes in.
This beginner’s guide is designed to demystify MSS and equip you with the knowledge to identify these important technical patterns. Let’s get to it.
- What is Market Structure Shift – MSS Explained
- How to Use Market Structure Shifts to Find Trade Opportunities
- What is the Difference Between Market Structure Shift vs Liquidity Grab?
- Identify Market Structure Shifts Using ICT Concepts and Tools
- How to Trade Market Structure Shifts
- The Free Market Structure Shift Trading PDF
- What are the Benefits and Limitations of Market Structure Shift in Trading?
- What Causes the Market Shift Structure in Trading?
- Is Market Structure Shift the Same as Change of Character
- What is the Difference Between a Market Structure Shift and a Break of Structure?
- What’s the Best Way to Use Market Structure Shift in Trading?
- Bottom Line
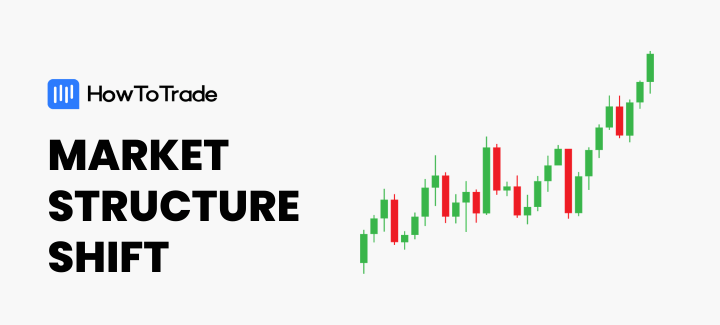
What is Market Structure Shift – MSS Explained
The market structure shift is a key part of the ICT trading methodology, which is a trading theory that relies on chart analysis and smart money concepts. When we talk about the Market Structure Shift (MSS) in trading, we’re referring to a technical pattern (or patterns) that signals a reversal in the market’s trend. That’s what it’s all about.
It’s usually represented by an aggressive move above or below an old structure level, where a signal for a price reversal is given.
In an uptrend, for instance, we recognize a bearish market structure shift when prices drop below a significant recent low. This is a clear flag, suggesting that the bullish energy is fading and a bearish reversal might be around the corner.
For traders, it suggests getting ready to sell the asset, hence, a bearish market structure. On the flip side, during a downtrend, if the price breaks above a significant high, it’s a sign of bullish MSS. This break signals a shift in market sentiment or direction, with buyers gaining the upper hand over sellers.
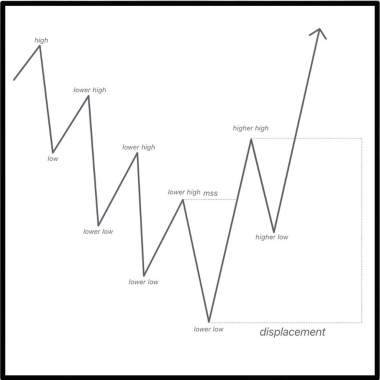
It’s important that this market structure shift comes with a displacement price action. In other words, the move looks intentional and almost direct.
So, let’s see an example of what a market structure shift looks like on a price chart:
As you can see in the above example, the bullish trend is broken once the lower low is formed. The move leading to this lower low was significant and intentional.
Identify Market Structure Shifts Using ICT Concepts and Tools
Identifying shifts in market structure comes with a lot of opportunities for traders. As part of the smart money concept strategy, various tools can be used to identify market structure shifts and trade opportunities. Here are three of the most effective ways to find trading opportunities using market structure shifts in the forex market:
Order blocks
Order Blocks are essentially the footprints of the market’s big players, areas where they have previously entered or exited their positions in significant volumes.
Identifying these zones can be crucial because they often act as turning points for price movements. When a Market Structure Shift occurs near an order block, the order block acts as a potential entry or exit point for traders.
To identify order blocks in the market, it’s advisable to use tools such as level 2 market data and order flow trading.
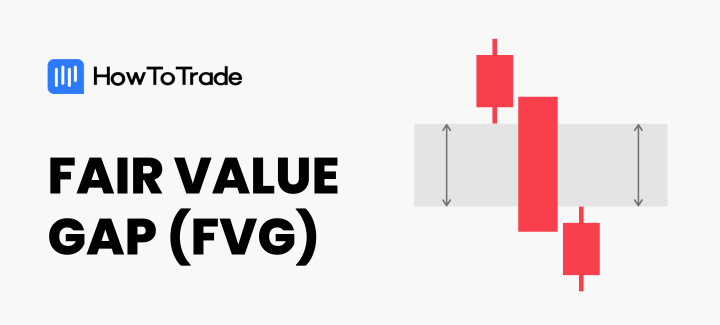
Fair Value Gaps (FVGs)
One of the clearest displacement indicators, and thus MSS, is the occurrence of fair value gaps, or a double fair value gap. These are the spaces on a price chart where the market jumps from one price to another without any trades happening in between. These gaps are like footprints, revealing the market’s momentum and offering clues about upcoming shifts.
So, we can easily identify a trend change by observing where the price broke the last opposite swing point with displacement while leaving a fair valued gap behind.

FVGs appear when there’s a significant price jump, leaving a gap on the chart. These gaps are areas where the price has not established fair value, and they often act as magnets for future price action. When a Market Structure Shift aligns with a fair value gap, it can suggest a strong move back to fill it, presenting a clear opportunity for traders to join the new trend.
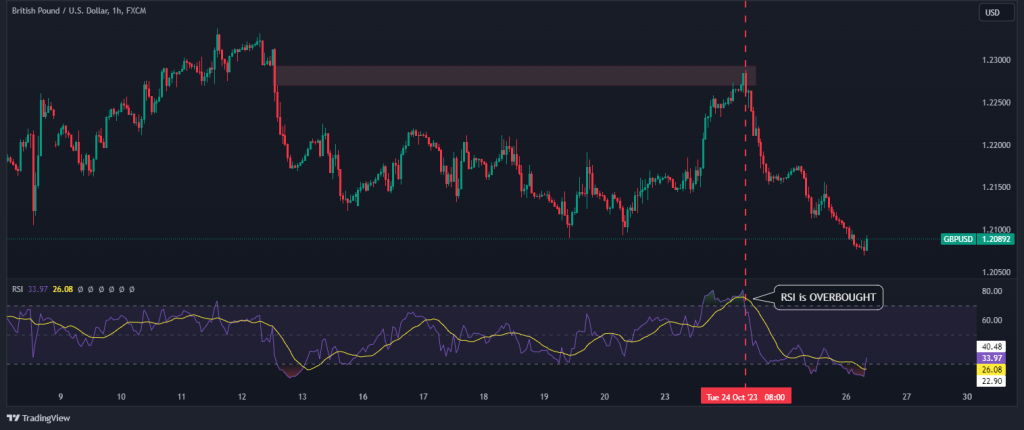
The Relative Strength Index (RSI)
Another way to identify market structure shifts is by using technical indicators. One example is the Relative Strength Index indicator – When the RSI indicates overbought or oversold conditions, it’s a hint that the market’s current trend may be exhausted. If this signal coincides with a Market Structure Shift, it’s often a strong indication that the market may be about to change direction. Traders can use this information to position themselves on the right side of the market’s new course.
As you can see, incorporating these tools into your trading strategy takes some practice to master. Each element supports the others, providing checks and balances to navigate the market’s shifting tides. An order block can confirm a potential MSS, a fair value gap can suggest where the price might head next, and the RSI can indicate whether the timing is right.
Overall, here are all the technical analysis and SMC tools that can be used to identify market structure shifts:
- Order blocks
- Fair value gaps
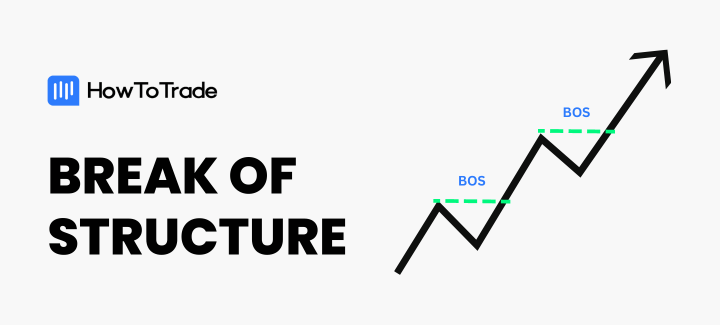
- The break of structure
- ChoCh trading pattern
- Technical indicators
- Supply and demand
How to Use Market Structure Shifts to Find Trade Opportunities
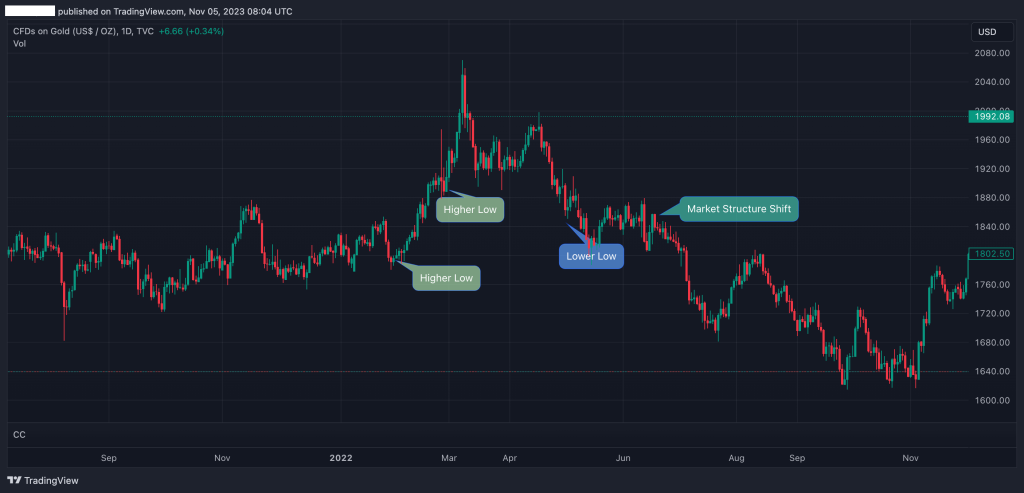
To use market structure shifts in trading, we can start by looking for patterns of higher highs and higher lows to identify an uptrend or lower highs and lower lows for a downtrend.
As explained earlier, a market structure shift occurs when these patterns are broken—such as when a price makes a lower low after a series of higher highs and higher lows, signaling a potential change from an uptrend to a downtrend or vice versa, as shown in the chart below.
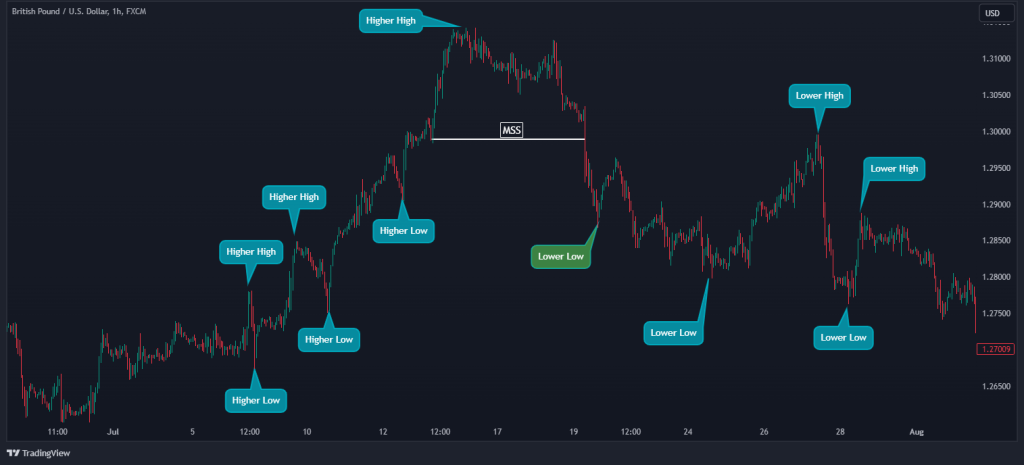
As you can see in the chart above, the lower low levels signify the shift in market structure and help in identifying a U shape when the market completes a reversal.
So, recognizing these shifts can really help you identify trading opportunities, forecast potential market turns, and set entry and exit points accordingly. The concept can be applied across various time frames, offering trade opportunities to both short-term day traders and long-term position traders.
With that in mind, here are the steps you need to take to use Market Structure Shifts in trading effectively:
- Identify the current market structure
- Monitor for structure breaks
- Confirm the shift with price action strategies or other technical analysis tools and indicators
- Plan your trade
Learn more about Market Structure Trading with in this video:
How to Trade Market Structure Shifts
By now, you should be familiar with identifying market shifts and have a basic understanding of how to take advantage of this concept while trading. It’s now time to see how everything we’ve discussed earlier can be used to trade financial assets.
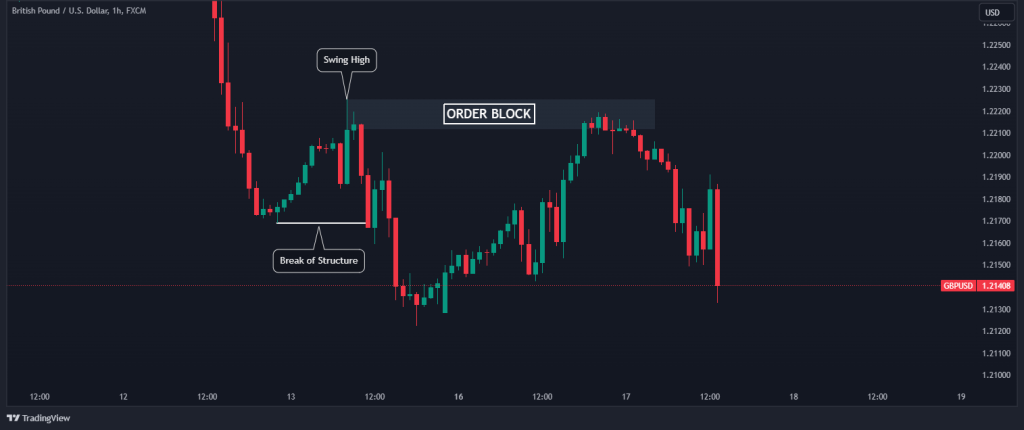
For this example, we are focusing on the GBP/USD chart on the hourly time frame.
The first thing to do is identify the market structure shift. From the chart below, you can see that the price shift structure from bearish to bullish by breaking above the last swing high.
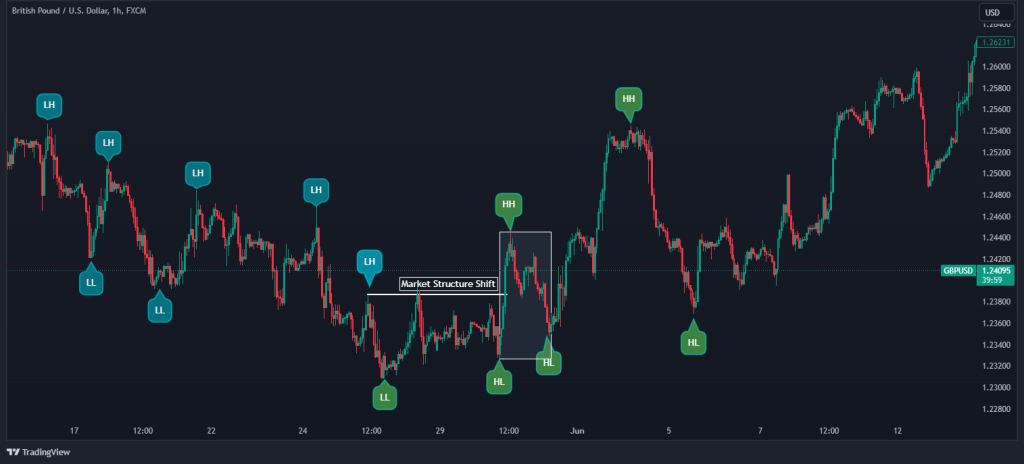
In this bullish market structure shift example, when the first higher high closes above the previous lower high, a market structure shift pattern is confirmed. At this point, you can look for entry opportunities to buy the market.
The good thing about trading the market structure shift is that it’s easy to plan the trade. In that case, you can use the previous lowest level as a stop-loss level. Then, since the market structure usually creates a U shape, the profit target can be placed at the highest level of the previous market trend before the MSS formation.
A market structure shift occurs when these patterns are broken—such as when a price makes a lower low after a series of higher highs and higher lows, signaling a potential change from an uptrend to a downtrend or vice versa.
The Free Market Structure Shift Trading PDF
If you need something to easily refer to when you’re trading, here’s a concise market structure shift trading PDF. It’s free, by the way:
Market Structure Shift Trading PDF.
What are the Benefits and Limitations of Market Structure Shift in Trading?
Market structure shifts are undoubtedly a powerful trading tool when used right. It has many benefits, which make traders swear by it. On the flip side, however, it has its limitations.
Here are some of the benefits and limitations of the market structure shift in trading:
Benefits
- By identifying potential trend reversals through MSS, you can aim to enter positions at the beginning of a new trend, potentially maximizing profits.
- Recognizing a shift in market structure can help you identify when your current trend might be weakening.
- MSS analysis emphasizes identifying strong confirmations of trend breaks, which can help you focus on higher probability entries rather than chasing every minor price movement.
- MSS is a basic concept that fits into many trading strategies and systems, making it a useful tool for just any kind of trader.
Limitations
- Identifying a true MSS can be subjective, as price action interpretation can vary. This can lead to missed opportunities or false signals.
- Not all price breaks beyond key levels turn into full trend reversals. Markets can experience false breakouts that quickly retrace, leading to losing trades if a trader reacts too hastily.
- MSS is best used in conjunction with other technical indicators or price action confirmation techniques for a more robust trading strategy.
What Causes the Market Shift Structure in Trading?
A significant change in supply and demand dynamics typically causes market structure shifts. This can be due to various factors such as economic data releases, changes in monetary policy, geopolitical events, or shifts in market sentiment.
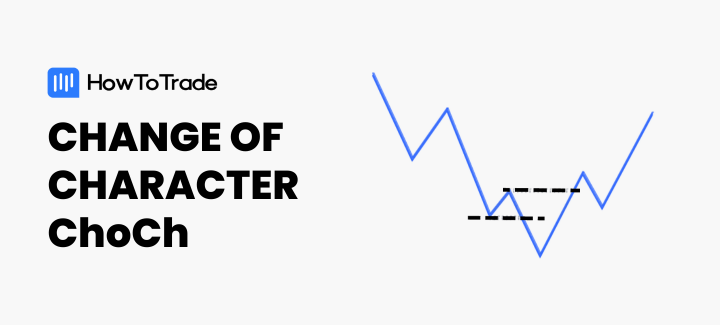
Is Market Structure Shift the Same as Change of Character?
While they are related, they’re not the same. A market structure shift indicates a significant trend reversal after breaking a significant low in an uptrend or a high in a downtrend. In contrast, a change of character involves breaking the recent high in a bearish trend or the most recent low in a bearish trend. The main difference here is the significance of the move and the swing point broken. An MSS confirms a change in market trend, which may even start with a change of character. A change of character marks a potential shift in market structure, before an MSS or an inducement.
What is the Difference Between a Market Structure Shift and a Break of Structure?
A break of structure occurs when the price moves beyond a defined support or resistance level but doesn’t necessarily indicate a trend reversal. A market structure shift, on the other hand, is a more significant move that suggests a new trend is beginning, often confirmed by a series of breaks in structure.
What’s the Difference Between Market Structure Shift vs Liquidity Grab?
Market Structure Shift and Liquidity Grab often confuse beginners. Both are pivotal, but they play very different roles in trading.
A market structure shift is an ICT concept that occurs when a price breaks past a swing high or low with a full-bodied candlestick, signaling a change in the market’s direction. This isn’t just a brief pullback; it’s a sign that the trend may be reversing.
Liquidity Sweep or Grab, on the other hand, is more of a feint. It happens when the price quickly dashes past the previous swing high or low with just a wick — that thin line on a candlestick chart — as if reaching out to “collect” or grab liquidity from traders who have placed stop-loss orders just beyond these points before the price in the same direction. Unlike MSS, this doesn’t indicate a trend reversal but rather a temporary move.
What’s the Best Way to Use Market Structure Shift in Trading?
The best way to use MSS in trading is to integrate it into a comprehensive trading plan. This involves identifying MSS in conjunction with other technical indicators, understanding the context of the overall market, and using it to find high-probability entry and exit points. It’s also important to manage risk and have clear rules for trade management when an MSS is identified.
Bottom Line
The concept of market structure shift is certainly a powerful tool used by many professional traders; if you know how to use it properly, it helps you to identify potential trend reversals and new trade opportunities. Essentially, the MSS works pretty much the same as many other chart patterns; however, by using other tools like liquidity, order blocks, and fair value gaps enables smart money traders to increase the chance of trading success.
Like many other SMC concepts, identifying market structure shifts can help analyze market sentiment and predict future movements.
So, as you use them, remember that trading is not just about recognizing patterns; it’s about understanding the story behind the movements and acting with informed confidence, and that’s exactly what you get after you’ve mastered this concept.
Risk Disclosure: The information provided in this article is not intended to give financial advice, recommend investments, guarantee profits, or shield you from losses. Our content is only for informational purposes and to help you understand the risks and complexity of these markets by providing objective analysis. Before trading, carefully consider your experience, financial goals, and risk tolerance. Trading involves significant potential for financial loss and isn't suitable for everyone.