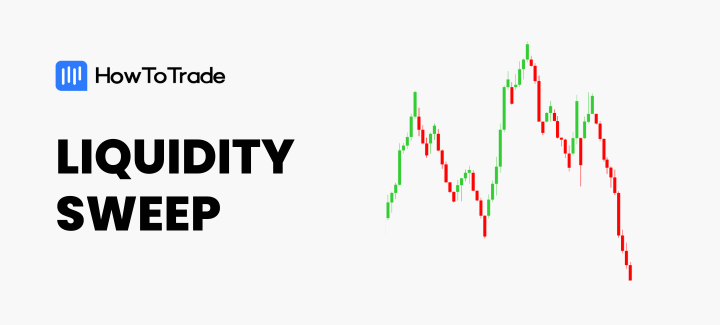
- A liqudity sweep refers to the process of a market execution of which the platform scans through multiple liquidity providers to find the best bid and ask prices and the lowest trading costs.
- In the context of trading, liquidity sweeps occurs when the price makes a sudden unexpected move to trigger large pools of orders, creating liquidity zones.
- Liquidity sweeps events can provide many trading signals, especially when used as part of the SMC trading strategy.
Becoming a professional trader requires an understanding of certain key trading concepts, one of which is the topic of liquidity sweep.
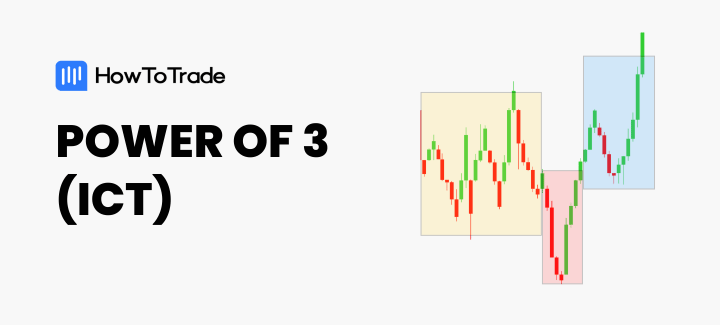
The liquidity sweep technique is a major backbone of the smart money concept and inner circle trading strategies. So, in this article, you will learn the following:
- What is the meaning of liquidity sweep?
- How can you spot these liquidity zones?
- How is it different from a break of structure?
- Finally, how to trade the liquidity sweep trading strategy.
- What is a Liquidity Sweep in Trading?
- How to Spot a Liquidity Sweep in the Market?
- A practical Example of How to Trade Liquidity Sweeps
- Liquidity Sweep Trading PDF Free Download
- What Are the Benefits of Using the Liquidity Sweep Strategy?
- Liquidity Sweep vs Break of Structure – What’s the Difference?
- What is the Difference Between Liquidity Sweep and Liquidity Grab?
- Frequently Asked Questions About Liquidity Sweeps
What is a Liquidity Sweep in Trading?
A liquidity sweep in trading refers to a trading phenomenon that occurs when institutional market players cause the market to move aggressively to trigger large pools of orders, such as stop losses and pending buy or sell orders, in specific areas on the chart known as liquidity zones. This process is vital for generating market momentum and is integral to the functioning of financial markets.
Understanding liquidity sweeps is key for any trader looking to make informed decisions. Liquidity zones are chart areas where there’s a high concentration of orders. When the market hits these zones, causing a sweep, it gives traders valuable insights into potential market directions and the behavior of other market participants. By identifying these sweeps, traders can better predict market movements, giving them a strategic edge in planning their trades and potentially improving their overall trading outcomes.
Types of Liquidity in Trading
There are two main types of liquidity as far as their positioning on the chart is concerned. They are Buyside liquidity (BSL) and Sellside Liquidity (SSL).
1. Buy-side Liquidity
The buy-side liquidity refers to areas on the chart where buyers have placed their stop orders. These are the ones you’ll find resting below double bottoms, bottoms of bullish trends, and even below swing lows.
2. Sell-side Liquidity
The sell-side liquidity refers to areas on the chart where sellers have placed their stop-loss orders. You’ll find them at the top of bearish trends, double tops, or swing highs. You’ll also find them above resistance levels in consolidating zones. Pretty much anywhere sellers are likely to put their stop losses when they sell.
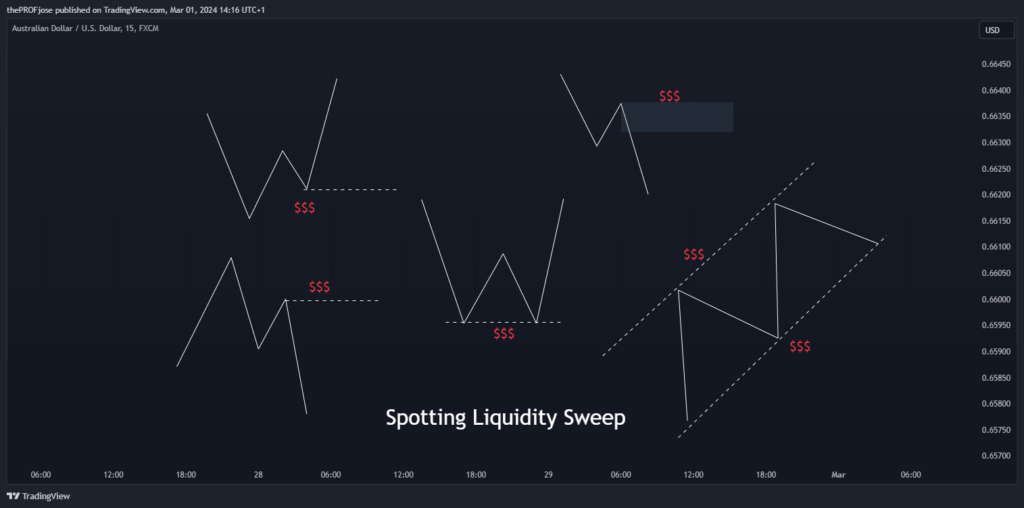
How to Spot a Liquidity Sweep in the Market?
Spotting a liquidity sweep in the market requires a keen eye for detail and an understanding of where liquidity zones typically form on trading charts. When a liquidity sweep occurs, these zones are critical areas where significant orders accumulate, acting as magnets for price action. Here are some of the key areas to spot liquidity sweep:
- Equal Highs and Swing Highs: These are areas where you see selling pressure building up. When the price approaches these levels again, it often indicates that there’s a pool of sell orders waiting to be activated, making it a potential liquidity zone.
- Equal Lows and Swing Lows: Similarly, areas that have previously marked equal lows or swing lows can attract buying interest. These levels are watched closely by traders, as they may signal an accumulation of buy orders, creating another form of liquidity zone.
- Dynamic Trend Lines and Channels: These technical analysis tools help traders spot areas where the price is likely to react. Liquidity zones can form above or below these trend lines or within the trend channels, as these are places where retail traders often set their orders in anticipation of a break or bounce.
- Order Blocks and Order Flows: Significant past orders or clusters of pending orders create what is known as order blocks or order flow analysis. Identifying these on your chart can point you to potential liquidity zones, as these are areas where large volumes of trades have been executed or are anticipated to be executed.
- Support and Resistance Levels: Price levels that have served as support or resistance in the past are key to finding liquidity zones. These supply and demand levels are closely watched by market participants and can attract a significant amount of orders, making them prime areas for liquidity sweeps.
- Fibonacci Levels: Many traders use Fibonacci retracement and extension levels to make trading decisions. These levels often become self-fulfilling prophecies as traders place orders around them, expecting the price to react, thus creating liquidity zones around these Fibonacci levels.
Here’s an illustration of the different ways traders can spot liquidity sweeps:
A Practical Example of How to Trade Liquidity Sweeps
Liquidity Sweeps are not a trading strategy in themselves per se; it takes a combination of the concept with other concepts, such as order blocks, fair value gaps, or even support and resistance, to have a tradable system.
So, in this section, we will walk you through how the liquidity sweep trading strategy works in the live market.
Before we go into the details, here’s the trading checklist for this strategy:
- Identify the trend
- Identify a tradeable point of interest (POI)
- Identify the liquidity sweep
- Set your stop loss and take profit
Now that we have the checklist as our road map to identifying high-probability trades let’s get down to business.
1. Identify the trend
There are many ways to identify trends in the trading world. While some use technical indicators like moving averages, Bollinger Bands, and others, understanding market structure is probably the best method for trading this strategy.
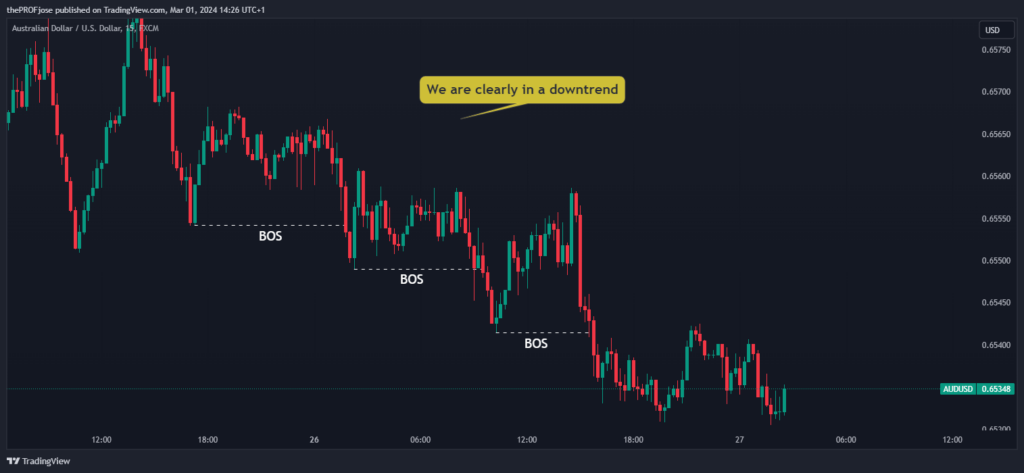
From the chart above, you can see that the price is creating a break of structures to the downside, signifying that the price is in a downtrend. So, in this scenario, we are looking to sell this pair.
2. Identify a Tradable POI
Point of Interest (POI) stands for where you are expecting to actually take trades from. It’s not good enough just to know what the trend is; knowing where to anticipate an entry helps you avoid having significant drawdowns and risking too much.
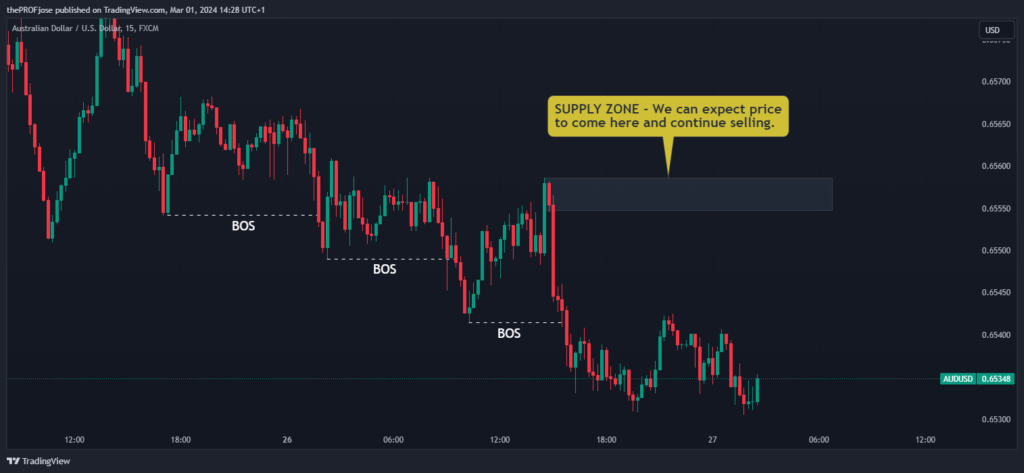
We have clearly chosen a bearish order block as our POI. The expectation is that the price should retrace into this zone and then sell from there. However, we don’t just get to set out limit orders just yet.
3. Identify Liquidity Zone
This is the most important part of this liquidity sweep trading strategy. After carrying out the first two steps, we must ensure there’s a liquidity zone that price is waiting to sweep, otherwise, the setup is invalidated.
In our case, we have a swing high just below the bearish order block. We expect the price to sweep this liquidity before coming into our POI and resuming its downward movement.
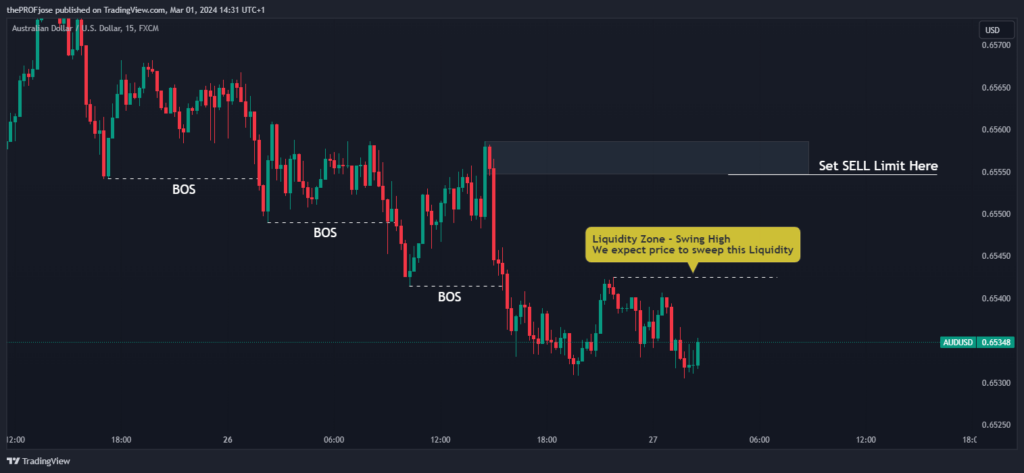
Once this is identified, we can set our sell limit order just below the bearish order block, as shown in the chart above.
4. Set Your Stop Loss and Take Profit
Trading is a game of probability, after all, so we don’t expect the market to go our way 100% of the time. So, how do we save money when the market doesn’t go our way? Simple: we use our stop-loss orders as part of a risk management plan.
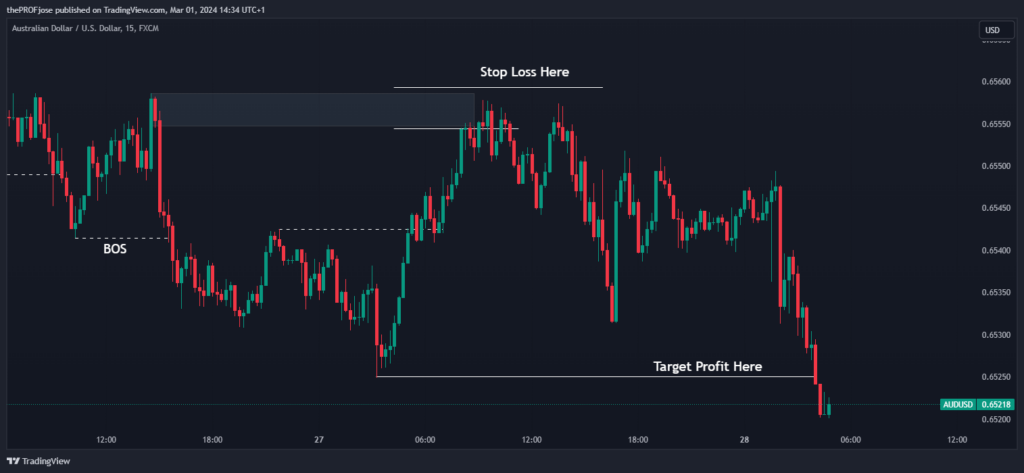
Placing a stop loss order in the liquidity sweep trading strategy is as simple as setting your entry. In a sell trade, all you have to do is place the stop loss a few pips above the bearish order block (as shown above.) While you simply have to shove it below the bullish order block in an uptrend.
Setting where to place your target profit is up to you. You can decide to place it at swing points or at fixed risk-reward ratios. For a buy trade, you can target the next swing high. On the other hand, you can place the take-profit point at the swing low when you’re in a sell trade.
Liquidity Sweep Trading PDF Free Download
If you need something to easily carry around and refer to when it comes to liquidity sweep trading, this PDF is for you:
What Are the Benefits of Using the Liquidity Sweep Strategy?
It’s crucial to underscore the benefits this approach brings to the table for traders at all levels.
Understanding and utilizing liquidity sweeps can significantly enhance trading strategies, providing a robust framework for making informed decisions in the dynamic world of financial markets. Here are the key benefits of the liquidity sweep strategy:
- Liquidity sweeps provide a deeper understanding of market conditions, enabling traders to anticipate changes and adjust their strategies accordingly.
- Identifying liquidity sweeps allows traders to pinpoint optimal entry and exit points, improving the potential for profit while minimizing exposure to risk.
- By recognizing and understanding liquidity zones, traders can set stop-loss orders more effectively, protecting their investments from unexpected market movements.
- Mastering the liquidity sweep strategy offers traders a competitive advantage by allowing them to leverage market insights that are not apparent to all market participants, thereby enhancing their trading performance.
Liquidity Sweep vs Break of Structure – What’s the Difference?
Understanding the nuances of trading terminology is crucial for anyone looking to navigate the markets effectively. Two terms that often emerge in discussions among traders are “liquidity sweep” and “break of structure.” While they might sound similar to the uninitiated, they represent distinct concepts that can significantly influence trading decisions and strategies.
Liquidity Sweep Overview
A liquidity sweep, often called a liquidity grab or stop hunt, is a strategy large market players employ to manipulate market liquidity. This manipulation aims to move the price in a specific direction, often opposite to the initial movement, by liquidating positions to grab extra liquidity.
Liquidity in financial markets is the ease with which assets can be bought or sold without significantly affecting their price. Market liquidity, funding liquidity, and operational liquidity are the three types of liquidity crucial for the smooth functioning of financial markets.
These sweeps are instrumental in maintaining market equilibrium, influencing asset prices through price adjustment, market sentiment, volatility, and sometimes triggering a liquidity feedback loop.
Break of Structure (BoS) Explained
On the other hand, a break of structure (BoS) is identified when there’s a significant change in the market’s trend direction, indicating a potential continuation or reversal.
BoS happens during trending markets and is a fundamental concept that involves a strong break with the intention of continuation in the current market structure. Unlike liquidity sweeps, BoS is more straightforward and aligns with the trend’s basic trading principles.
The primary difference lies in the intent and outcome of these movements. Liquidity sweeps are tactical maneuvers by large investors to manipulate the market for liquidity purposes, often resulting in short-term price movements intended to trigger stop losses or fill large orders.
In contrast, a break of structure signals a more substantial change in market sentiment or trend, potentially leading to longer-term price movements.
To further clarify, let’s highlight the key differences between a liquidity sweep and a break of structure:
| Liquidity Sweep | Break of Structure |
| To ‘clean out’ accumulated orders and generate momentum. | To signal a potential continuation or change in market direction or sentiment. |
| Concentration of orders in specific chart areas. | Breakthrough of defined support or resistance levels. |
| Short-term momentum and potential insights into market movements. | Possible long-term change in market trend. |
| Traders may use sweeps to identify entry or exit points based on market momentum. | Traders may adjust their positions to align with the new market trend indicated by the break. |
Interestingly, what appears as a sweep on a higher timeframe might look like a BoS on a smaller timeframe. This perspective shift underscores the importance of context in market analysis. Traders often can only differentiate between the two after the movement has occurred. However, understanding these concepts can enhance strategic planning, especially in anticipating market manipulations to identify fake liquidity grab events and aligning trades with broader market trends.
What is the Difference Between Liquidity Sweep and Liquidity Grab?
While both terms are often used interchangeably, there is a subtle difference between a liquidity sweep and a liquidity grab:
- Liquidity Sweep: This involves the market moving through a liquidity zone to trigger a large volume of orders, leading to rapid price movements. It’s a broader market movement that can affect a significant price range and is often driven by larger market players.
- Liquidity Grab: This term is sometimes used to describe a more specific, often short-lived market action where the price quickly moves to a certain level to trigger orders before reversing or continuing in the original direction. It’s seen as a tactical move to ‘grab’ liquidity by triggering stops or pending orders to fuel a price movement or reversal.
Both concepts revolve around the idea of targeting areas where orders are clustered to influence price movements, but the scope and implications of each can differ.
Frequently Asked Questions About Liquidity Sweeps
Here are some frequently asked questions about liquidity sweep in trading:
What is a liquidity sweep in forex trading?
A liquidity sweep in the forex market refers to the process where large volumes of buy or sell orders in a specific market area are triggered and executed in a short period. This usually happens around key price levels where pending orders, such as stop losses and limit orders, have accumulated, creating a liquidity zone. When price action sweeps through these zones, it absorbs the liquidity, often leading to significant price movements. It is believed that institutional traders use these moves to trap the average retail trader.
Is there a technical indicator for liquidity sweep?
Currently, there is no specific technical indicator designed solely to identify liquidity sweeps as they are more about market dynamics and order flow analysis than a measurable metric like price or volume.
However, traders often use a combination of order book analysis, volume indicators, and key price levels (support/resistance, Fibonacci retracements) to anticipate and identify potential liquidity sweeps. Understanding where liquidity is likely to accumulate and monitoring these areas can help traders spot these sweeps manually. Some traders even use the Beat the Market Maker (BTMM) strategy to learn how to identify these areas where the smart money is being placed.
Risk Disclosure: The information provided in this article is not intended to give financial advice, recommend investments, guarantee profits, or shield you from losses. Our content is only for informational purposes and to help you understand the risks and complexity of these markets by providing objective analysis. Before trading, carefully consider your experience, financial goals, and risk tolerance. Trading involves significant potential for financial loss and isn't suitable for everyone.