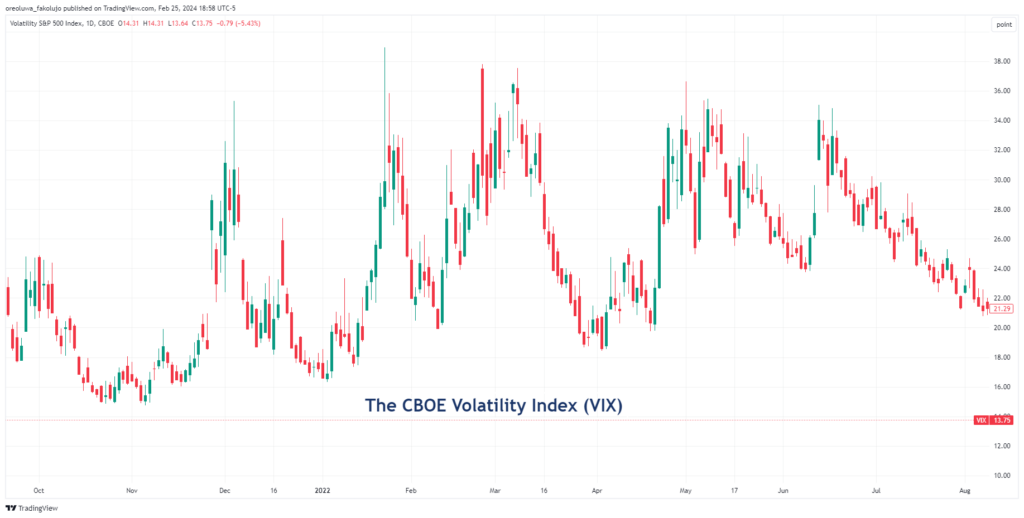
- The VIX, also known as the fear index, is a tool that measures how much investors and traders expect the S&P 500 (and the stock market in general) to fluctuate in the upcoming 30 days.
- When the VIX number is low, the market is expected to have low volatility in the coming days. And when the VIX is high, the market is expected to have high volatility in the coming days.
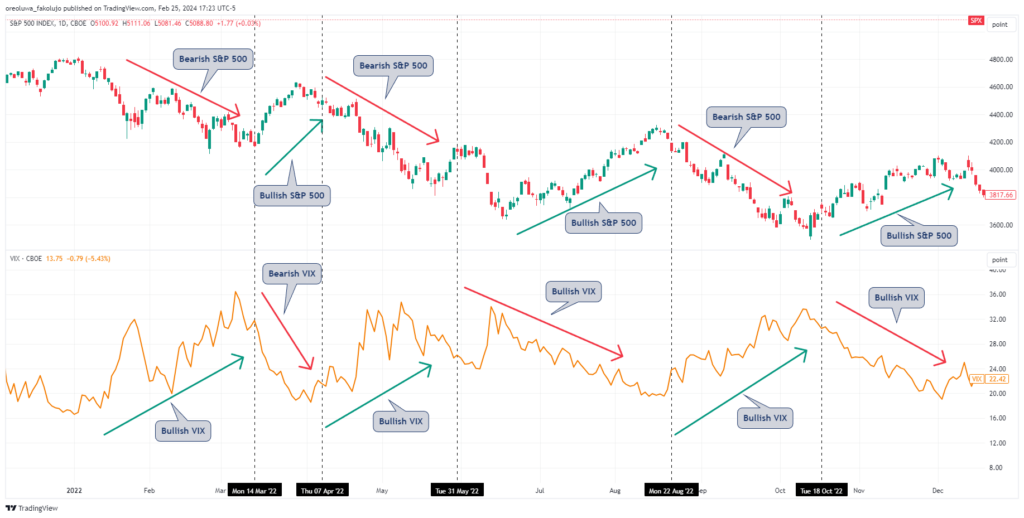
- Many VIX trading strategies rely on the instrument being inversely correlated to the S&P 500. So, the S&P 500 falls when the VIX rises, and vice versa.
The CBOE Volatility Index (VIX) is a tool used to gauge market sentiment and the degree of fear in the market. It has an uncanny correlation with the market, and many traders and investors rely on it to plan and manage their risks, as well as to predict future price movements. While you cannot buy the instrument like you would buy a stock, a bond, or a currency pair, there are ways to trade it. On this page, we are going to explain everything you need to know to trade the VIX trading strategy.
In the rest of this piece, you’ll learn:
- What the CBOE Volatility Index (VIX) is.
- Ways to trade the VIX.
- How to use the VIX.
- Some of the best VIX trading strategies.
- What is the CBOE Volatility Index (VIX)?
- How Does the VIX Work?
- What is Volatility in the Stock Market?
- How Does the VIX Trading Strategy Work?
- What Are the Best VIX Trading Strategies?
- The Free VIX Trading Strategy PDF
- What Are the Benefits and Limitations of Trading the VIX?
- How Does the VIX Trading Strategy Work?
- How Can You Trade the VIX?
- Frequently Asked Questions
What is the CBOE Volatility Index (VIX)?
Developed by the Chicago Board Options Exchange (CBOE) Global Markets in 1993, the CBOE Volatility Index measures how much the US stock market is expected to fluctuate in the next 30 days. Simply put, it measures the implied volatility of the stock market within the next 30 days.
You see, the trading of the stock market relies heavily on price fluctuations or volatility. On some days, the market can be sluggish. On other days, it moves extremely fast. This unpredictability in fluctuation made it challenging for traders to determine and plan their investment/trading risk ahead of time. Then came the VIX, aiming to help traders to predict this stock market volatility.
The use of the VIX measures how much market participants expect the stock market to fluctuate in the future. Armed with this information, participants have an idea of what to expect from the market within the next 30 days in the market. The VIX is essentially a gauge of investor sentiment and fear in the market. That’s why it is often called the “fear index.” The logic is very simple – when the VIX is low, then the market is in risk-on mode, meaning stock markets are rising, and the economy is usually booming. On the other hand, when the VIX is rising, stock indices are falling, and investors may consider a risk-off mode.
When the VIX index was created, it was only used on the S&P 500. Even in its calculation, as you’ll soon see, the VIX only considers the S&P 500. But over time, investors have come to rely on it to gauge the overall stock market fluctuation. And seeing that the S&P 500 itself is only an index that tracks over 500 U.S. stocks, the relationship makes sense.
The VIX measures how much market participants expect the stock market to fluctuate in the future. With it, traders can have an idea of what to expect from the market in terms of volatility, and plan their risks accordingly.
How Does the VIX Work?
Technically, the VIX index tracks the options market’s strike prices of SPX (S&P 500 options contracts) over a specific time range. Remember that in the options market, traders predict what the price of an asset will be on a future date. So, if the strike prices are low in the options market, the VIX figure goes lower, implying that investors aren’t expecting low risk in the coming days; hence, investors can apply the risk-on mode. But if the strike prices are high in the options market, the VIX rises, implying that investors expect some volatility/risk in the market in the coming days.
So, how can traders use the VIX? A high VIX figure indicates that the S&P 500 and the general U.S. stock market will likely become more volatile within a month. It also indicates that the markets are likely to drop since investors’ fear is rising. A low VIX figure signals a potential low volatility in the S&P 500 within the next 30 days. Generally, it is said that the market is at increasing risk when the VIX rises above 30. On the other hand, when VIX is trading below 20, investors interpret it as a low-risk market condition.
Evidently, as of the end of February 2024, VIX is standing at 13.65. Unsurprisingly, all leading US stock indices are trading at all-time levels.
The formula from which the VIX is calculated is somewhat complex, and you may never need to use it. If you must have it, though, check out the VIX whitepaper.
What is Volatility in the Stock Market?
You can see volatility as fluctuations in the market. You could also call it the measure of stability in the prices of securities. If the price of security swings widely in any direction within a short period, you could say the security is highly volatile. However, if that security tends to have steady pricing over time, it has low volatility.
Volatility in the market can be of three types: beta, standard deviation, and implied volatility.
- Beta volatility refers to how volatile a security is compared to the market. If a stock has a beta that’s above 1.0, it is more volatile than the market.
- Standard deviation volatility is simply how volatile a security is within a period.
- Implied volatility measures how volatile a security will likely be in a future timeframe. This implied volatility is what the VIX measures.
How Does the VIX Trading Strategy Work?
The VIX trading strategy is based on one single rule: The stock market is inversely correlated with the VIX. So, when the VIX is low, stock market prices often rise. But when the VIX is high, stock market prices usually fall.
The SPX chart below is a perfect example of this correlation. The VIX is the line graph below it.
This correlation can be somewhat explained this way:
- When the VIX is low, the market becomes complacent and “fearless.” This encourages traders and investors to throw their capital at the stock market, causing prices to rise.
- When the VIX is high, investors are more “fearful” and cautiously approach the market. Some take their capital off the market, while others steer clear altogether. Then, prices drop.
Every VIX trading strategy is based on that foundation. But, of course, the VIX is not 100% accurate. No tool is. So, you should always cautiously approach the market regardless of a high or low VIX number.
This market correlation is extremely interesting, especially when the VIX tends to move slightly before the SP500. It is a great tool not only for predicting price movement but also for getting a sense of investors’ sentiments about the stock markets and the economy in general.
What Are the Best VIX Trading Strategies?
Here are some of the best and most straightforward VIX trading strategies:
1. Trade the VIX Index with the 20 EMA Indicator
Of course, the first VIX trading strategy is to trade the tool as its instrument. This means you are trading the VIX index.
Note, however, that because the VIX is simply a measuring tool, you can’t buy or sell it like you would a stock or bond. But there are CFDs, options and futures contracts, and Exchange Traded Products (ETPs) based on the VIX. You can trade the VIX through any of these methods.
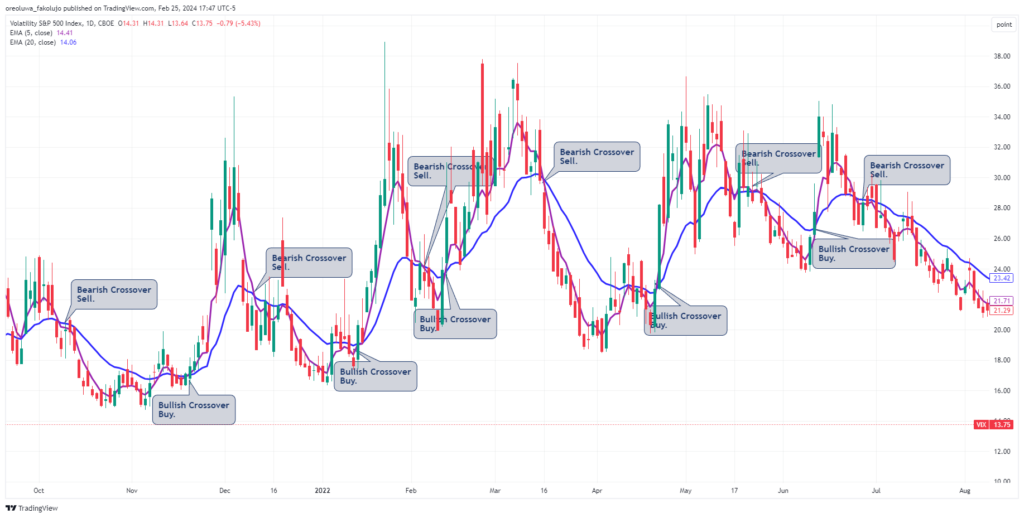
And a simple strategy to trade the VIX is to place the moving average on it. For the sake of our example, we’re using the 20-EMA trading strategy.
Step 1: Place Trades
With this strategy, whenever the 20-EMA crosses the VIX to the upside, we sell. And we buy whenever the 20 EMA crosses the VIX to the downside.
Step 2: Manage Risk
Place stop losses below the most recent swing low in a bullish trade and above the most recent swing high in a bearish trade. But if your VIX is very choppy and the potential stop loss level is too far away, get creative and use other risk management strategies.
And for profit-taking, you can set a standard 1:2 risk-to-reward ratio. This means you take your profits off the trade when you’ve made two times the amount you’re risking.
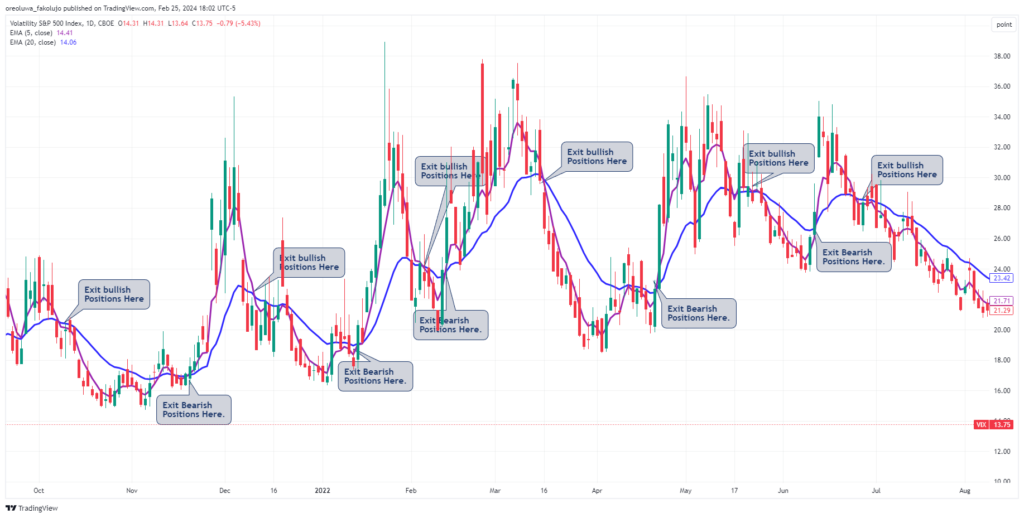
Another way to get out of the trade when in profit is to monitor when the EMA gives an opposing signal to the one you’ve entered. If the EMA signals a sell when you are in a bullish trade, exit your position. And if you were in a bearish trade when the EMA signals a buy, exit your position. Use the chart below to see what we mean.
2. Trade VIX Alongside the S&P 500
The second method is to utilize the asset correlation trading strategy by trading the VIX alongside the S&P500. Investors and traders can use the uncanny correlation between the VIX and S&P 500 to their advantage using the following steps:
Step 1: Place the Moving Average on the VIX Chart
Once you have the S&P 500 and the VIX charts on your screen, place the 20-EMA on the VIX chart. In the chart below, the candlestick chart on the upper half of the image is the S&P 500. The orange line on the lower half of the image is the VIX. We changed it from a candlestick chart to get a clean look. Finally, the blue line crisscrossing the VIX is the 20-EMA.
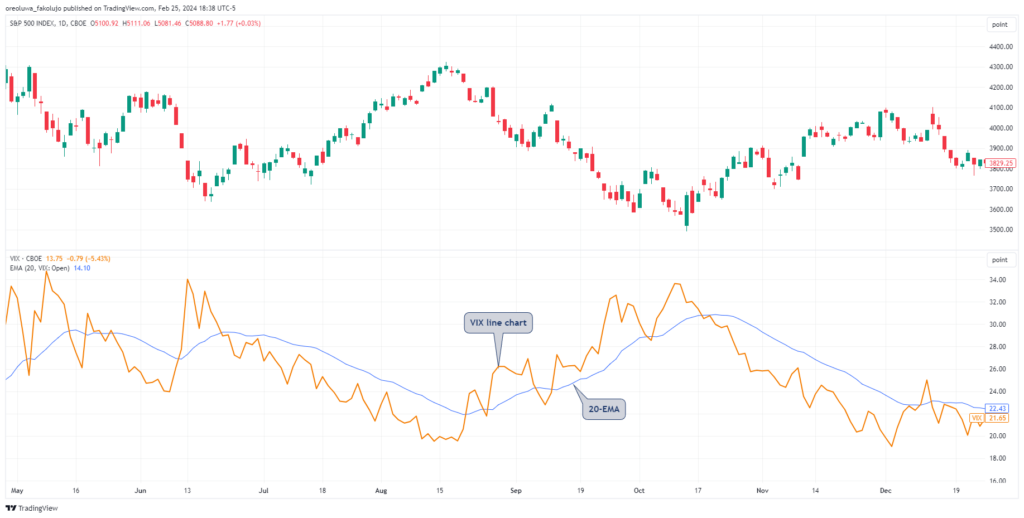
If you’re using multiple trading monitors, you don’t need to complicate things. Just make sure your 20-EMA is on the VIX. Your S&P 500 can be on another screen.
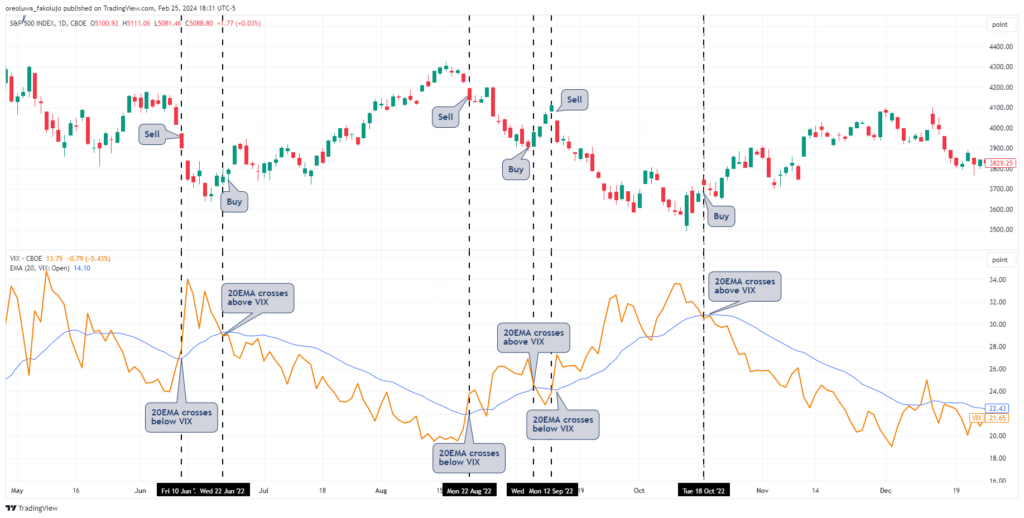
Step 2: Place Trades
Upon using this strategy, you should enter a bearish trade on the S&P 500 whenever the 20 EMA crosses the VIX to the downside. Conversely, enter a bullish trade on the S&P 500 whenever the 20 EMA crosses the VIX to the upside (as presented in the chart below).
Step 3: Manage Your Risk
Your stop loss on the S&P 500 can be below the most recent swing low in a bullish trade and just above the most recent swing high in a bearish trade.
Step 4: Backtest Your Strategy
We chose the 20-EMA as the signal indicator because the moving average is straightforward to use and portrays the strategy without so much fuss. But, like many other indicators, it can be prone to many false signals, as you saw in the chart above. So, to find the most accurate trading combination, you must try other moving average periods, other indicators, or other trading strategies altogether. Whatever you do, just ensure you backtest it extensively on a demo account and build consistency before you employ the strategy in a live account.
3. Evaluating VIX Long/Short Positions
This is another VIX trading strategy that many investors use, especially those who engage in swing and position trading. And because it isn’t technical, many traders sleep on it.
Here’s how to trade the VIX Long/Short Positions trading strategy.
Step 1: Check the Latest CFTC COT Report for VIX Futures
The Commodity Futures Trading Commission (CFTC) releases the Commitment of Traders (COT) report every week. You can get the report for the VIX futures from the CFTC website.
Step 2: Observe the Disparity Between Commercial and Non-Commercial Net Positions
Sometimes, the disparity in the net long and short positions of the commercial traders can give you an insight into what’s happening. See the report from the 20th of February, for instance.
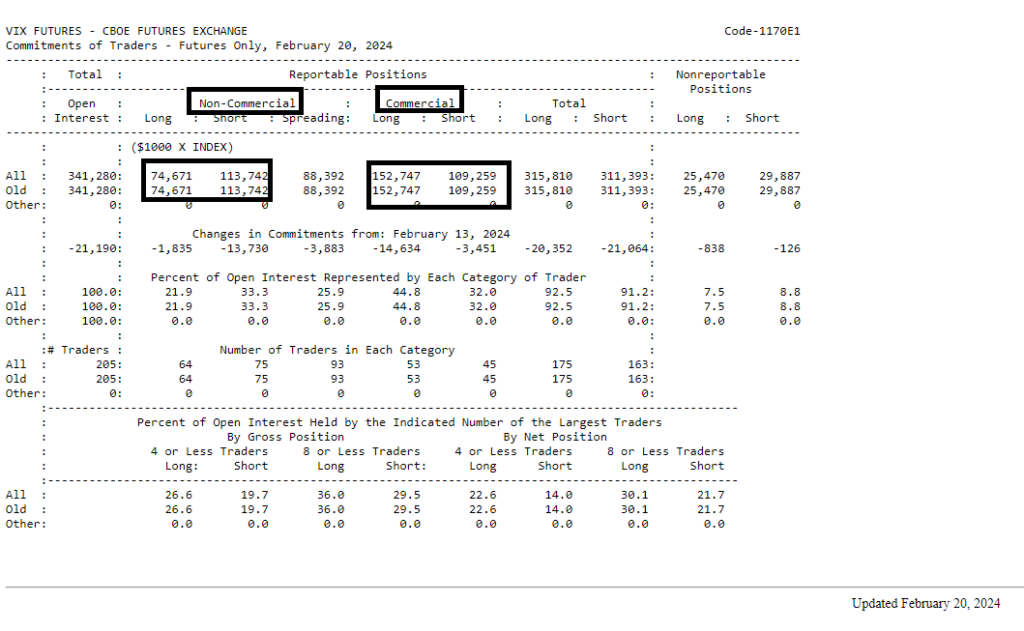
Notice that the non-commercials are mostly going short while the commercials are mostly going long. This may mean the big guys know something you don’t know, and it may be worth digging into.
This strategy doesn’t offer you trade entry signals but gives you useful insights into the market that you may not find anywhere else.
The Free VIX Trading Strategy PDF
If you need something to easily refer to when you’re trading, here’s a concise VIX trading PDF. It’s free, by the way:
The Free VIX Trading Strategy PDF
What Are the Benefits and Limitations of Trading the VIX?
The VIX is an undroppable tool for many traders, and rightfully so. One of its most significant benefits is that it helps to measure market sentiment. When there’s a concern in the markets among economists and investors, the VIX is the first financial instrument to show that. As a result, traders can employ a systematic approach to trading, being fully cognizant of how much volatility to expect in the coming days.
Additionally, the VIX can be used as a hedging tool against market volatility and unexpected events.
Conversely, trading the VIX is not the ideal way to trade the markets. Normally, getting access to VIX as a tradable product can be quite a hassle. It’s not very likely to be part of a traditional trading account, which means you need to make an effort to be able to trade it. Another drawdown is the Contango risk, which may bite into the investor’s profits.
Either way, Black Swan events like natural disasters and unexpected political developments can cause the VIX to spike sporadically. So, if you’re trading VIX in any form, put proper risk management in place.
A low VIX figure signals a potential low volatility in the S&P 500 within the next 30 days. Generally, it is said that the market is at increasing risk when the VIX rises above 30. On the other hand, when VIX is trading below 20, investors interpret it as a low-risk market condition.
How Can You Trade the VIX?
So, how can you trade the Volatility Index? The primary method for doing that is to open a Futures trading account and trade VIX futures contracts or options directly on the CBOE. This is the most conventional way to get access to VIX trading; however, it also requires you to make a fairly high initial deposit and go through a long and complicated registration process.
The second method is to trade VIX via ETFs (Exchange Traded Funds) or ETNs (Exchange Traded Notes). Once again, for that matter, you typically need to invest a large sum to be able to make substantial profits as a trader.
Lastly, another option to trade VIX is through CFDs (Contract for Difference). Those are derivative contracts offered by CFD brokers. Bear in mind, however, that not all brokers offer VIX CFD contracts. If you wish to take this route, you can visit our top brokers’ page to find the one that allows you to trade the Volatility Index as a CFD contract.
Frequently Asked Questions About the VIX Trading Strategy
Here are some common questions regarding the VIX trading strategy:
Is it a good sign when the VIX is down?
It is neither good nor bad when the VIX is down, up, or in the middle. From an economic perspective, it means the US and global economic activity are on the right path. For an individual trader, however, it doesn’t matter. All that matters is where your position lies as it concerns the VIX. For instance, short sellers will not be happy when the VIX is down because this often means the S&P is rising. On the other hand, the bulls may not see it as a good sign that the VIX is high because this often correlates with the falling of the S&P 500.
What are high and low VIX numbers?
Generally, VIX is said to be low when it’s below 12 and high when it’s above 20. Others might argue that a risk begins when the VIX is above 25 or 30. So, you may have to do your backtest to determine what VIX number is “low” or “high” for you.
How do you start trading using the VIX trading strategy?
The first thing you need to do is to get yourself a broker that allows you to trade VIX in any form. SwitchMarkets, for instance, is a broker enabling you to trade CFDs. Then, you need to practice your VIX trading strategy on a demo account until you can make a consistent profit with it. You can also join our trading academy to see how we trade the VIX trading strategies.
Risk Disclosure: The information provided in this article is not intended to give financial advice, recommend investments, guarantee profits, or shield you from losses. Our content is only for informational purposes and to help you understand the risks and complexity of these markets by providing objective analysis. Before trading, carefully consider your experience, financial goals, and risk tolerance. Trading involves significant potential for financial loss and isn't suitable for everyone.