
- The Rally Base Rally formation consists of an impulsive upward push (the rally), a brief sideways consolidation (the base), and another impulsive upward push (another rally).
- The RBR trading strategy relies on the ability of the base to form demand zones.
- While this strategy is a failry simple-to-use one, we recommend that you still use it in confluence with other trading tools.
The Rally Base Rally formation consists of three main parts: the rally, the base, and the rally. These three parts make up a reliable way to exploit trading opportunities. The average supply and demand trader uses this price pattern in one form or the other. So, in this article, we’ll show you how to use the Rally Base Rally trading strategy.
At the end of this article, you should be able to:
- Understand what the Rally Base Rally pattern is.
- Spot high-probability Rally Base Rally pattern.
- Trade the Rally Base Rally trading strategy.
 Table of Contents
- What is the Rally Base Rally Trading Strategy?
- How Do You Identify and Draw the Rally Base Rally Pattern?
- What Tools and Techniques Make the Rally Base Rally Trading Strategy More Effective?
- How Do You Trade the Rally Base Rally Trading Strategy (Trade Example)?
- What are the Benefits and Limitations of the Rally Base Rally Trading Strategy?
- Is the Rally Base Rally a Good Trading Strategy?
What is the Rally Base Rally Trading Strategy?
The Rally Base Rally (RBR) is one of the ways by which a demand or supply zone is formed on the trading chart. It consists of three major phases.
- Rally: The first impulsive move to the upside. This is the first move of the formation.
- Base: A brief consolidation after the rally
- Rally: A final impulsive move
Usually, after this pattern forms, the base forms a demand zone in an uptrend move that often serves as a support level in the future. So, the Rally Base Rally trading strategy involves how you would use that demand zone to build trading opportunities. The strategy depends on demand and supply trading, where traders attempt to catch trades from areas with significantly higher demand than supply or the other way around.
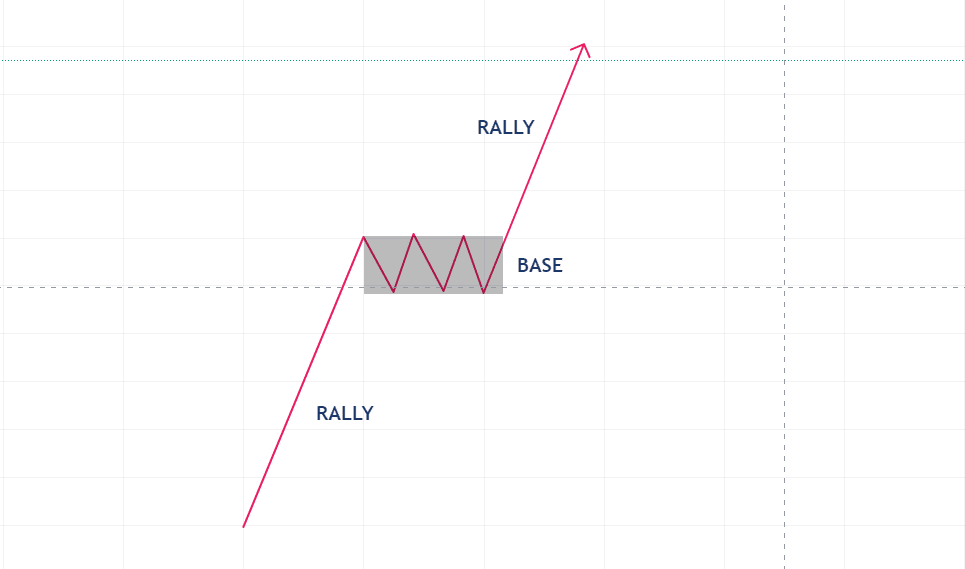
The RBR pattern often forms during bullish trend continuations, and it’s a good way to enter a trend after it’s taken off. Simply put, the Rally Base Rally provides an excellent entry point for joining a trend.
Note that the RBR only forms demand zones, so you can only use it for bullish trade opportunities. A similar pattern that forms supply zones and can be used in bearish directions is called Drop Base Drop. So, instead of a demand zone, a support zone materializes, which the trader can use as a resistance level later.
Other similar patterns are the Drop Base Rally (another demand trading strategy) and the Rally Base Drop pattern.
How Do You Identify and Draw the Rally Base Rally Pattern?
The RBR pattern is quite simple to identify, especially if you know what to look for. Don’t forget your pattern consists of three main parts: the first rally, the base or a brief consolidation, and the second rally.
To identify these on our chart, follow these steps:
1. Look for a Strong, Bullish Push
The RBR pattern usually occurs after a significant rally, which occurs as a result of a major market trend. This strong, bullish push is what makes the first rally of the RBR pattern. Ideally, you want to see a Fair Value Gap (FVG) in this movement. These indicate a strong bullish movement that can be formed into an RBR.
2. Wait for the Formation of the Base
The base is perhaps the most essential part of the RBR pattern because that’s where your demand zone forms. It appears as a series of candlesticks (at least two) without a clear upward or downward bias. It’s a consolidation with smaller candlesticks compared to the first rally.
3. Wait for Another Strong Bullish Push
The formation is complete when the final push occurs. It often appears as a sudden return of volume into the market after the brief consolidation. This usually comes with its FVG as well.
Once these three things form, you have our generic RBR pattern. However, not all RBR patterns offer a strong demand zone. The next section below will show you how to identify high-probability RBR formations using extra tools and techniques.
Check out our daily market analysis page for insights about leading FX pairs, global indices, and commodities.
What Tools and Techniques Make the Rally Base Rally Trading Strategy More Effective?
Although you don’t necessarily need tools to find the generic RBR pattern on your chart, the following tools and techniques can help you confirm one when you see it.
1. Volume Indicators
The RBR pattern attempts to interpret volume movements on the chart, which is why Volume indicators can come in handy.
For the ideal RBR pattern, you want to see a rise in volume with at least one of the rallying movements. If both rallies are accompanied by spikes in volume, all the better. Between these two rallies, you want to see reduced volume in the base. Some useful volume indicators include the Volume Profile indicator and the Volume Price Trend (VPT) indicator.
2. Fair Value Gaps
Fair value gaps or imbalances are integral parts of smart money concepts you would like to see at your rallies. When you see this, it means the price rose very swiftly, confirming the demand zone.
3. Change of Character
The Change of Character (Choch) is extremely useful when trying to catch entries using the RBR pattern on lower timeframes. For instance, you can use the change of character to scout entries for an RBR demand zone formed in a high timeframe or a lower timeframe.
4. Support and Resistance
The RBR can also serve as the break of some form of past resistance, especially in the base phase. This doesn’t happen all the time, though. But when it happens, it adds confluence to your RBR pattern.
Note that all of these supply and demand zones are ideal for the formation of an RBR pattern. However, you won’t always find them all aligning. If you see at least two out of these, though, you’re good to go.
How to Trade the Rally Base Rally Trading Strategy – Trade Example
Here’s a trade example of the RBR trading strategy. In this example, we use the GBP/USD chart.
Step 1: Identify the RBR Pattern
The first thing you want to do is identify the RBR chart pattern. Looking closely enough, you’ll see many RBR patterns on the chart, especially when the market is trending. However, to identify the high-probability formations, you need to combine the tools mentioned in the previous section.
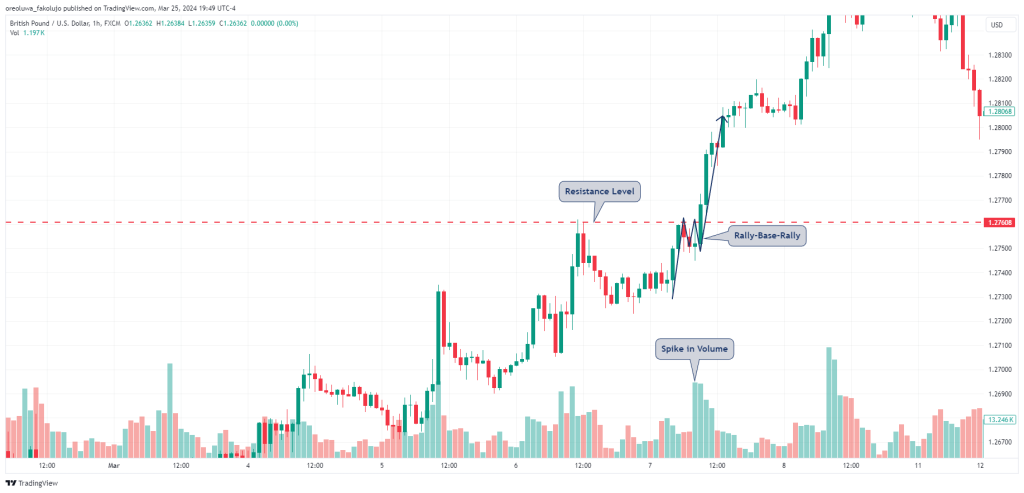
Look at the GBP/USD hourly chart above, for instance. You’ll see the Rally, the Base, and the next Rally. Notice that there’s a volume spike that coincides with the second rally. That’s good. You’ll also notice that the base of the RBR coincides with a previous resistance level that the second rally then breaks. If you look closely enough, you’ll also notice that there are fair value gaps on both rallies. All of these combine to suggest that the RBR pattern is likely high-probability.
Step 2: Draw Out Your Demand Zone
As soon as you’ve identified your RBR, draw your demand zone. Depending on your trading style, there are a few ways to draw demand zones.
- You can draw your demand zone as an extension from the base’s lowest price point to its highest price point.
- You can also use the entire width of the last candlestick in the base before the impulsive candlestick breaks out of the base. If there’s a Fair Value Gap, all the better. See an example below:
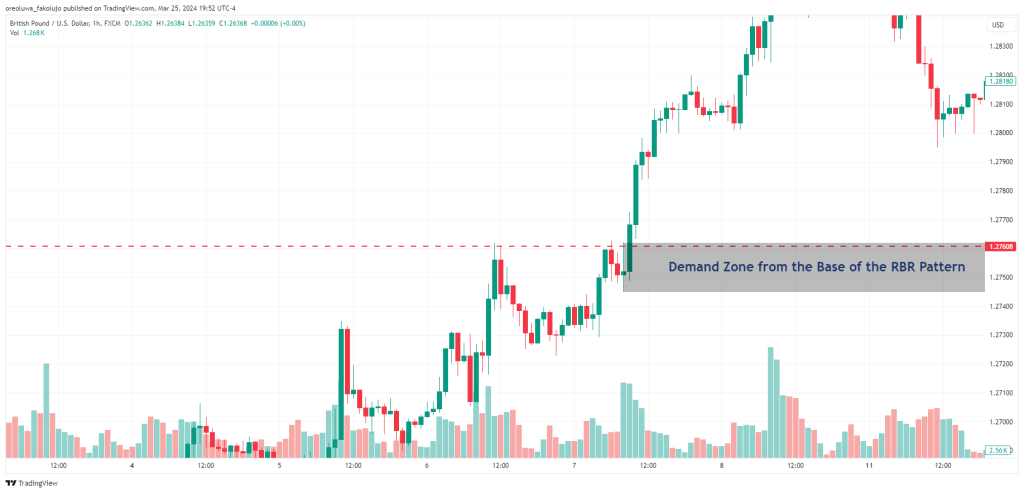
After you extend your demand zone to the right, wait for the price to break above the highest level of the support zone.
Step 3: Trade Entry
At last, you need to find the ideal entry point. There are several ways to enter trades using the Rally Base Rally trading strategy. The first and most aggressive is to set a buy limit order at the top of your demand zone. If you want a tighter risk-to-reward ratio, you can place your buy limit order in the middle of your demand zone.
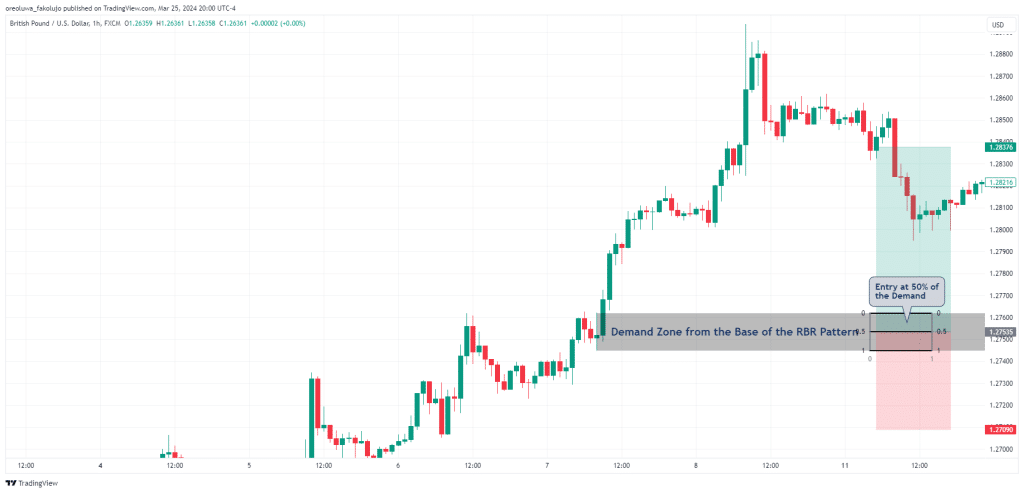
This entry method is very risky because the demand zone is not infallible. Sometimes, the price passes through it, putting you at a loss. On the flip side, you’ll never miss an RBR trading opportunity this way.
However, if you’re a conservative trader, you’ll want to wait for confirmation of the demand zone. You can do this on a smaller timeframe, say, the 5-minute. If you see a Change of Character (Choch) formation in this demand zone with an FVG/imbalance, that might be your entry signal. Once the Choch happens, set a buy limit at the top of the FVG. If there are multiple FVGs, use the FVG that completes the Choch.
Step 4: Risk Management
If you use the aggressive entry method, you can place your stop losses right underneath your demand zone. However, if you used the confirmation/conservative method, you can place your stop loss right underneath your swing low.
Your take-profit level can then be set based on your trading system. Some traders place their take-profit levels at the next resistance level (if there’s one). This usually guarantees a higher reward for your risk when the price hits your take-profit level. But the price won’t always hit the next resistance level, causing you to potentially lose whatever profit you might have gained.
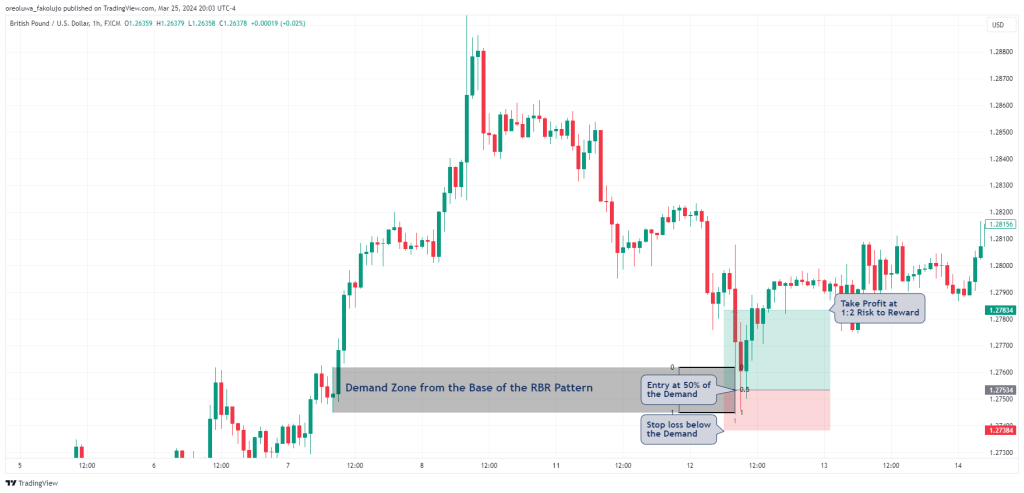
Another way to set take-profit levels is to use a standard risk-to-reward ratio, say 1:2. In our trade example above, we aim for a simple 1:2 risk-to-reward ratio.
What Are the Benefits and Limitations of the Rally Base Rally Trading Strategy?
Like many other trading strategies, the Rally Base Rally trading strategy has benefits and limitations. One benefit is that it’s a good and fairly simple-to-use continuation trading strategy. So, instead of chasing trends that have left you, you can use the RBR to get some trading opportunities off the trend.
Another benefit of the RBR trading strategy is that you can easily combine it with other trading concepts, including supply and demand trading, supports and resistances, the smart money concept trading strategy, and many more. It’s not restrictive, so any trader of any trading style can try to use it.
The fact that the RBR concept is based on pure price action trading is also a benefit. How so? Because the charts are fractal. So, concepts (like the RBR) that appear in the daily chart can also appear on the 4-hour or even the 1-minute chart. This means that regardless of your trading style, you can use it.
On the flip side, a major limitation is that sometimes, the price passes through your RBR demand zones as if they weren’t even there. This is unavoidable, as no trading strategy works 100%. And this is where your risk management comes in. As some professional traders will say, “It isn’t our trading strategy that makes you a profitable trader. It’s your risk management strategy.”
Is the Rally Base Rally a Good Trading Strategy?
In sum, the Rally Base Rally trading strategy is neither good nor bad. It is a simple strategy, though, and its effectiveness largely depends on the trader using it. Needless to say, we recommend using it as part of a more comprehensive trading system and not in isolation. Overall, the RBR is a chart pattern strategy that appears frequently on price charts and tends to provide good entry levels to join market trends. Some great examples where you can find the RBR pattern include assets that have major market trends, such as Bitcoins, Tesla, Meta Platforms, and the USD/JPY.
In the trading example in this guide, for instance, we used the RBR demand zone in combination with the concepts of Fair Value Gaps and Change of Character. We also combined a volume indicator to confirm high-probability setups. That’s a trading system right there.
However, you don’t have to follow our guidelines strictly. What matters most is that you understand how to use the RBR trading strategy, which is the ultimate aim of this article. With this knowledge, you can incorporate it into your trading system as you see fit. If you still need guidance on how to use this strategy, as well as many other strategies, we invite you to join our Trading Academy, where we teach you everything you need to increase your chances of success in trading.
Risk Disclosure: The information provided in this article is not intended to give financial advice, recommend investments, guarantee profits, or shield you from losses. Our content is only for informational purposes and to help you understand the risks and complexity of these markets by providing objective analysis. Before trading, carefully consider your experience, financial goals, and risk tolerance. Trading involves significant potential for financial loss and isn't suitable for everyone.


