- The Keltner Channel is an envelope indicator used to identify price trend and reversals.
- Upon using the Keltner Channel indicator, traders can employ a wide range of strategies, with two of the most common include the breakout and pulback trading strategies.
- The Keltner Channels strategy stands out for its simplicity and effectiveness, providing clear signals that assist traders in making informed decisions.
Among the plethora of technical analysis tools available to traders, the Keltner Channel Indicator stands out for its precision, adaptability, and ease of use. Tested and trusted for over 60 years among beginner and professional traders, the Keltner Channels strategy is certainly a valuable tool in trading. This article is a deep dive into how to make this indicator work for you.
At the end of this article, you should be able to:
- Understand what the Keltner Channel Indicator is
- Trade with the Keltner Pullback Trading Strategy
- Trade with the Keltner Breakout Trading Strategy
- Use the Keltner Trading Strategy In Trending and Ranging Markets
What is the Keltner Channel Indicator?
The Keltner Channel Indicator traces its origins back to the innovative work of Chester Keltner in the 1960s. It was Keltner who first introduced the concept of Keltner Channels, laying the groundwork for what would become a widely used technical analysis tool.
However, the version of Keltner Channels commonly used by traders today is not exactly what Keltner defined initially.
In the 1980s, Linda Bradford Raschke introduced significant updates to the indicator, refining its methodology and making it more adaptable to the financial markets. This updated version, credited with greater accuracy and responsiveness, is embraced by traders worldwide.
Keltner Channels belong to the envelope indicator family, with the most familiar of all being Bollinger Bands. Like their counterparts, these channels are plotted on a price chart, framing the price action with an upper and a lower band. This creates a dynamic channel that visually encapsulates the price range within its bounds. Envelope indicators, including Keltner Channels, provide traders with a clear graphical representation of market volatility and potential price trends.
Here’s what Keltner channels look like on a price chart:
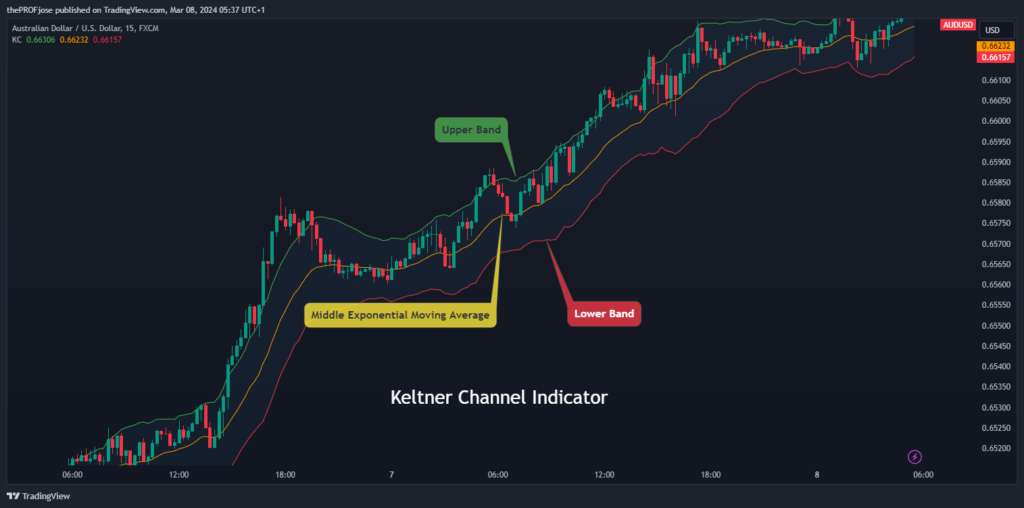
At the heart of the Keltner Channel is a simple exponential moving average (EMA), which serves as the indicator’s baseline. This average is flanked by two bands: an upper band and a lower band. These bands are not static; their positioning relative to the central EMA is determined by the trader’s settings, which can be adjusted based on the trader’s analysis strategy and the specific characteristics of the market being analyzed.
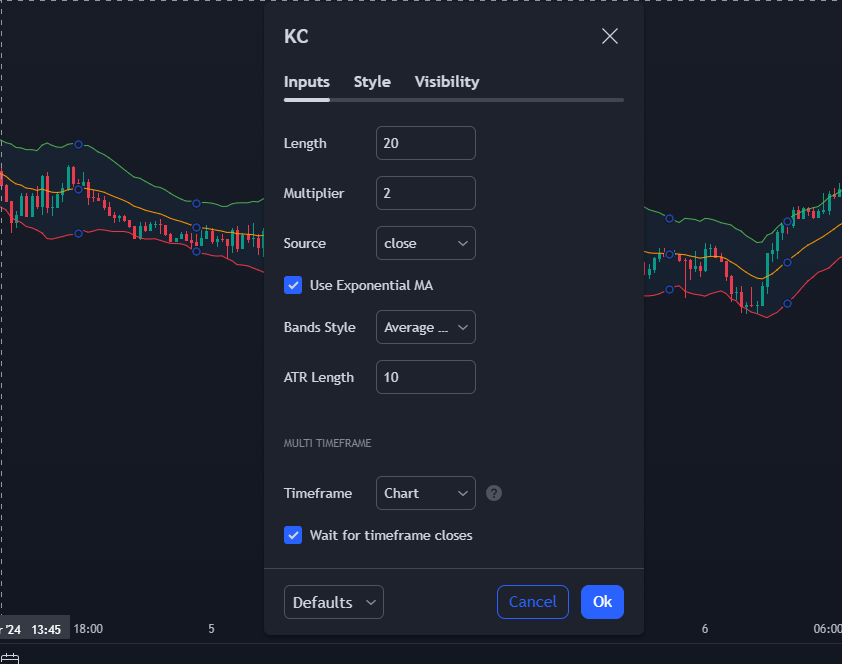
Keltner Channel Strategy Best Settings
Understanding how to optimize Keltner Channel settings is crucial to leveraging them effectively in your trading strategy. Fundamentally, Keltner Channels integrates two key indicators: the Exponential Moving Average (EMA) and the Average True Range (ATR).
The EMA provides a weighted average of prices over a specified period, prioritizing more recent prices over older ones. This sensitivity to recent price movements makes the EMA an invaluable component of the Keltner Channel, offering a dynamic baseline that reflects the current market trend.
The ATR, a concept introduced by J. Welles Wilder Jr. in his seminal 1978 book, “New Concepts in Technical Trading Systems,” measures market volatility. It calculates the true range for any given day as the greatest of three values: the current high minus the current low, the absolute value of the current high minus the previous close, or the absolute value of the current low minus the previous close. A moving average of these true ranges, typically over a period of 14 days, then represents the ATR. This measure of volatility is pivotal in adjusting the Keltner Channels to suit the fluctuating nature of the market.
The calculation of Keltner Channels involves setting an upper, middle, and lower band around the EMA, with the ATR influencing the distance of the upper and lower bands from the EMA:
- Upper Band = EMA + (ATR x Multiplier)
- Middle Band = EMA
- Lower Band = EMA – (ATR x Multiplier)
Choosing the appropriate settings for the EMA and the multiplier applied to the ATR is essential for tailoring the Keltner Channels to your trading style and the specific asset you’re trading. For day traders, an EMA period of 15 to 40 days is commonly employed, balancing responsiveness to price changes and smoothing out market noise.
It’s important to note that the best settings for Keltner Channel strategies are not one-size-fits-all. Still, they should be customized based on the trader’s objectives, the trading time frame, and the specific characteristics of the asset being traded. Experimentation and backtesting different trading strategies with different EMA periods and ATR multipliers are indispensable practices for identifying the most effective settings for your trading approach.
Most Popular Keltner Channel Trading Strategies
For an indicator that has been around for over 40 years, traders have devised tens of Keltner channel trading strategies. Among these, the Keltner Channel Breakout Strategy and the Keltner Channel Pullback Strategy stand out for their popularity and potential for capturing significant market moves.
1. Keltner Channel Breakout Strategy
The Keltner Channel breakout strategies are used mainly near a major market open when the most explosive movement occurs. This allows traders to utilize the breakout trading strategy using Keltner Channels. The general strategy is to buy if the price breaks above the upper channel line or sell short if the price drops below the lower band after the market opens, as shown in the chart below. Based on this strategy, traders typically follow the upper and lower lines to identify breakouts.
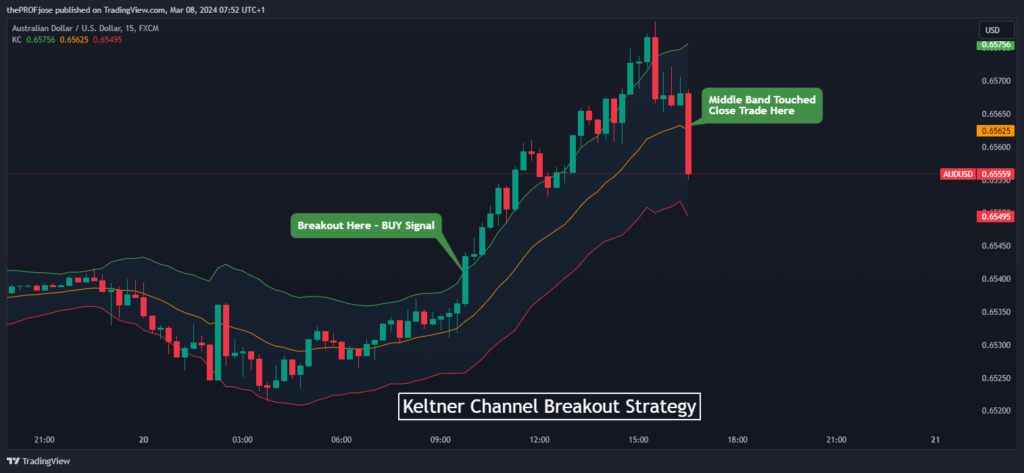
The middle band signals when to exit the trade manually. You should exit the trade whenever the middle band is touched, whether the trade is a loser or a winner.
Since the market is typically volatile right after the opening, you may get one signal that results in a loss or small profit, immediately followed by another signal. Trade the second signal as well. Take only two trade signals for this strategy. If a big move doesn’t occur on the first two-channel breakouts, then it probably isn’t going to happen.
2. Keltner Channel Pullback Strategy
On the other side of the strategy spectrum lies the Keltner Channel Pullback Strategy, which focuses on buying during an uptrend when the price retraces to the middle line or selling short during a downtrend when the price rallies back to the middle line. This strategy is predicated on the natural ebb and flow of market prices, capturing gains by trading the pullbacks within a broader trend.
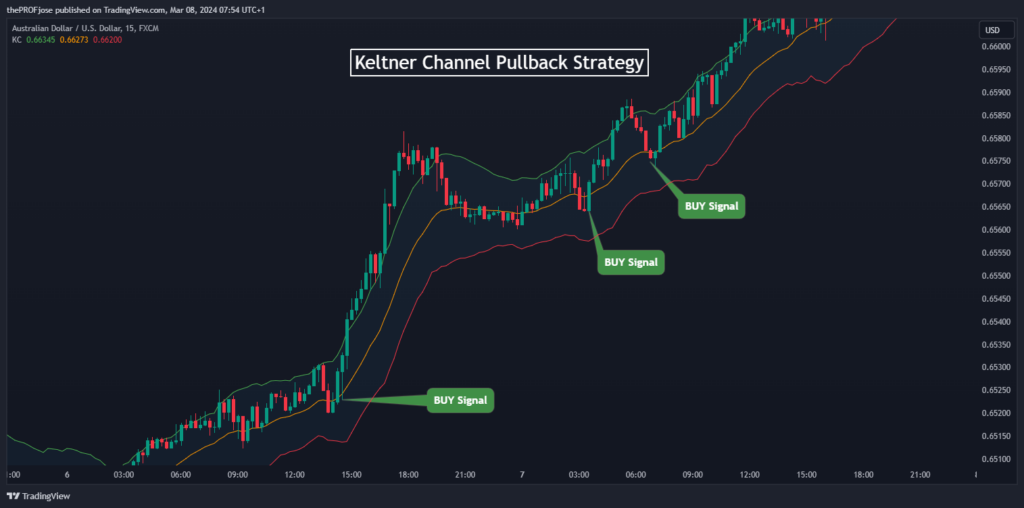
Effective risk management is a cornerstone of the pullback trading strategy. The stop loss is typically placed about halfway between the middle and the corresponding outer band (lower for buys, upper for sells), with the target price set near the opposite band. This setup aims for a risk-reward ratio of approximately 1.
However, not every pullback to the middle band is a viable trading opportunity. Traders must discern whether the market is exhibiting a clear trend or if price movements are too erratic and lacking direction. The effectiveness of this strategy diminishes in sideways markets, where the price frequently oscillates between the upper and lower bands without a clear trend.
How to Trade Using the Keltner Trading Strategy?
We’ve shown how to trade both the Keltner Channel Pullback Strategy and the Keltner Channel Breakout Strategy. However, let’s take it a step further. Every trader knows that the market won’t range or trend forever. So, there’s a need for a complete system that gives the trader an edge in these evolving market conditions.
In this section, we introduce you to how to trade the trending and ranging market using the Keltner Trading Strategy.
Catching Trends with the Keltner Trading Strategy
We’ve heard a billion times that the trend is our friend as traders, and this strategy helps us to put it to good use. To get started on the right path, you need the following on your chart:
- Keltner Channel Indicator
- Average Directional Index (ADX)
Once you have those installed, your chart should look like this:
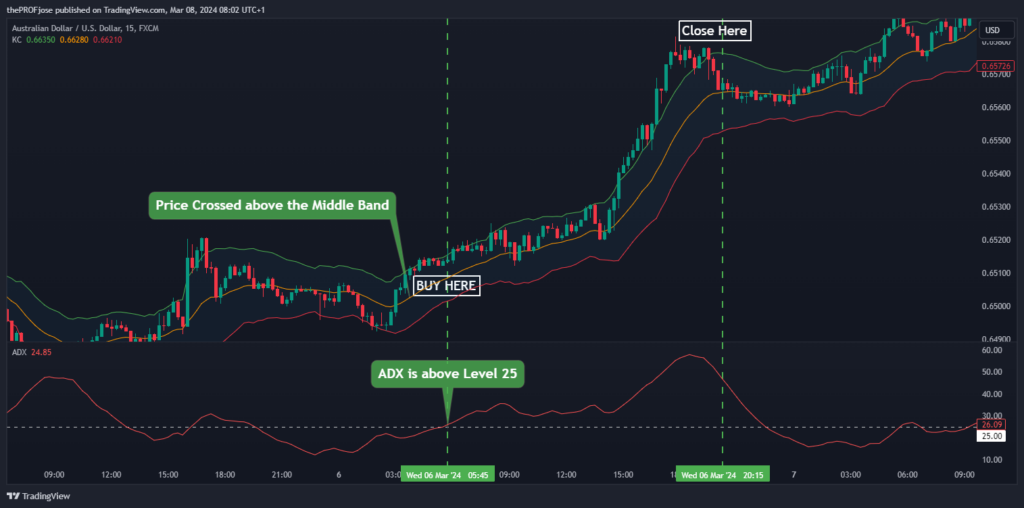
From the chart above, you’ll see that we were able to enter a good BUY trade; here’s how we do it:
- The first thing to do is to ensure that the ADX is above Level 25, showing that the market is trending.
- After that, all you have to do is wait for the price to crossover the middle Keltner Channel Band. If it crosses above it, enter a BUY trade. If it crosses below it, enter a SELL trade.
- Finally, for a BUY trade, set your stop loss slightly below the swing low. While you set your stop loss slightly above the swing high in a BUY trade.
Trading Ranging Market with the Keltner Trading Strategy
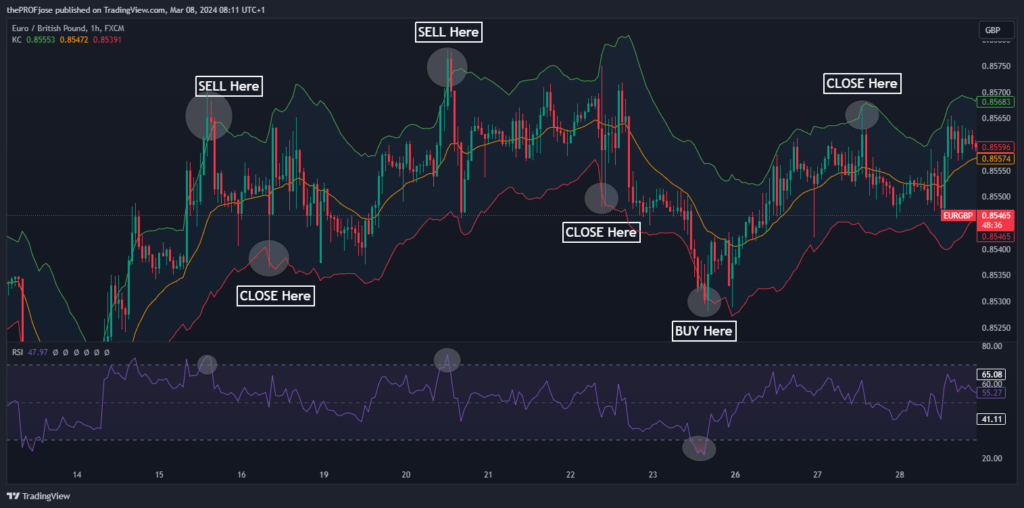
The ranging market strategy can be challenging, especially for new traders. It might be surprising, but range trading is a very profitable way to make profits in intraday trading. And with the right tools, like Keltner channels, you can master it in no time. So, to trade in this environment, we need a technical analysis such as the Relative Strength Index (RSI) indicator to help us identify overbought and oversold levels.
This strategy is quite to the point:
- We BUY when the RSI shows that the price is oversold and bounces off the lower Keltner Channel Band.
- On the other hand, we can SELL the market when the price bounces off the Keltner Channel’s upper band when the price is overbought.
- You can easily place your stop loss level below the lower band (in a BUY trade) or above the upper band (in a SELL trade) while targeting the opposite band as your profit target.
The Free Keltner Channels Trading Strategy PDF
Here, we have a PDF about Andrew’s Pitchfork trading strategy that can be downloaded for free. It’ll come in handy should you need something quick to refer to concerning the strategy:
The Keltner Channels Trading Strategy Free PDF Download
Why Should You Use the Keltner Channel Trading Strategy?
So, why should you use the Keltner channels strategy? Simply put, because this Strategy offers traders many advantages, making it a compelling choice for individuals looking to enhance their trading performance. The strategy, which involves using the Keltner channels indicator on its own or in combination with other technical analysis indicators, stands out for its simplicity and effectiveness, providing clear signals that assist traders in making informed decisions.
One of the primary reasons to incorporate the Keltner Channel into your trading arsenal is its ability to simplify market analysis. The channel’s structure, with its upper and lower bands enveloping the price action, offers an intuitive visual guide to understanding market volatility and trend strength. This clarity is invaluable, especially in fast-moving markets, enabling traders to assess the situation and act accordingly quickly.
What’s more, this strategy does not confine itself to a specific market or timeframe, making it a versatile choice. Whether you’re trading stocks, forex, commodities, or cryptocurrencies, the Keltner Channel can be applied effectively. Similarly, it adapts seamlessly across various timeframes, making it suitable for day traders, swing traders, and long-term investors. This universal applicability ensures that traders of all types can leverage the Keltner Channel to spot potential entry and exit points, regardless of their market focus or trading style.
Finally, the Keltner Channel trading strategy offers a degree of customization that allows traders to tailor it to their specific trading preferences and risk tolerance. Adjustments can be made to the exponential moving average and the bands’ width, enabling traders to fine-tune the indicator’s sensitivity to price movements. This adaptability ensures that the Keltner Channels can be optimized for different trading strategies and market conditions, enhancing its effectiveness as a trading tool. All in all, it’s an excellent and simple-to-use strategy that can help traders find lots of trade signals if, of course, used correctly.
Risk Disclosure: The information provided in this article is not intended to give financial advice, recommend investments, guarantee profits, or shield you from losses. Our content is only for informational purposes and to help you understand the risks and complexity of these markets by providing objective analysis. Before trading, carefully consider your experience, financial goals, and risk tolerance. Trading involves significant potential for financial loss and isn't suitable for everyone.