- Bollinger Bands is a widely used technical analysis tool in trading, developed by John Bollinger in the 1980s.
- They consist of a simple moving average (SMA) as the center line and two standard deviation lines above and below, forming a volatility channel.
- Prices tend to stay within the upper and lower band limits; bands expand with increased volatility and contract with decreased volatility. Breaches of upper or lower Bollinger bands may signal overbought or oversold conditions, indicating potential reversals or corrections.
Unlocking the secrets of successful trading involves the understanding of technical analysis tools, and one such potent tool is the Bollinger Bands strategy. Developed by John Bollinger in the 1980s, these bands visually represent market volatility, helping traders identify potential entry and exit points.
In this article, we delve into the core components of Bollinger Bands, explore how to trade with it effectively and shed light on common mistakes to avoid.
What are Bollinger Bands in Trading?
Bollinger Bands are a widely used technical analysis tool in stock and forex trading. Developed by John Bollinger in the 1980s, these upper and lower bands are plotted above and below a simple moving average (SMA) middle band to depict a financial instrument’s volatility and price levels. The primary components of Bollinger Bands include the SMA as the center line and two standard deviation lines above and below it, forming a channel that encapsulates price movement.

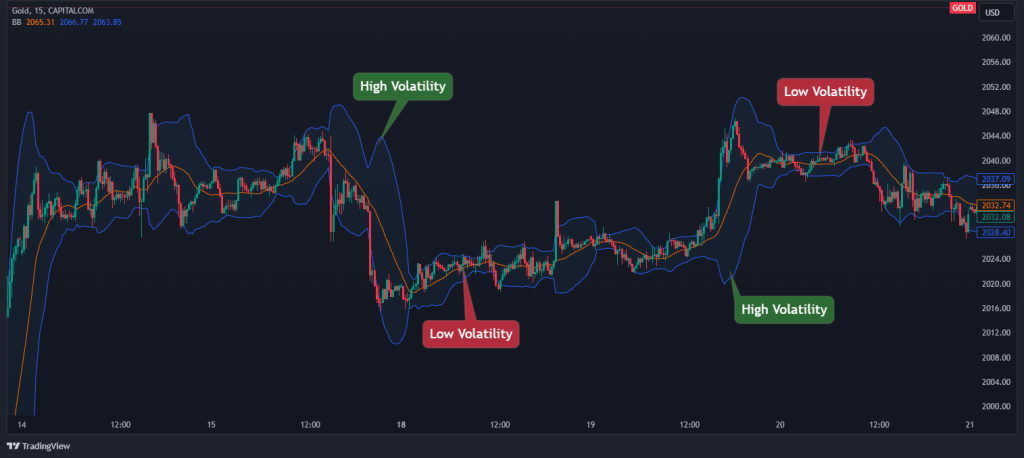
The functioning of Bollinger Bands is grounded in the concept that prices tend to remain within the upper and lower band limits. As you can see below, the bands expand as volatility increases and contract as the volatility decreases.
Traders often interpret the breach of these bands as potential buying or selling signals. When prices touch or surpass the upper band, it may indicate an overbought condition, suggesting a possible reversal or correction. Conversely, touching or breaking the lower band might imply an oversold condition, signaling a potential upward price movement.
Essentially, Bollinger Bands visually represent market volatility and help traders identify potential entry or exit points based on deviations from the norm. As the gap between Bollinger bands expands, traders can interpret that as increasing volatility in the market. On the other hand, when Bollinger Bands squeeze, the volatility decreases. Understanding these bands is crucial for traders making informed decisions in dynamic market conditions.
Overall, Bollinger Bands are considered an extremely effective indicator because they provide insights into the price’s moving average and volatility.
How Do You Use the Bollinger Bands Indicator Effectively?
Generally, the primary use of Billonger Bands is to buy the asset when the price breaks above the upper Bollinger Band and sell when the asset’s price breaks below the lower Bollinger Band.
However, the key to using Bollinger Bands is understanding that when the price touches the upper or lower band, it is not an automatic buy or sell signal. Instead, it’s crucial to interpret these touches in the context of the broader price pattern and trend. For instance, during strong trends, prices may repeatedly touch or break through the upper and lower bands, a phenomenon known as “walking the band.”
Rather than reacting immediately to these touches, traders should look for specific chart patterns such as a “double bottom,” “classic M top,” or a “three pushes to high” formation.
However, while BB can signal a trend continuation, Bollinger Bands can also signal the end of strong trends. An expansion of the bands can indicate an increase in volatility, often seen at the end of a trend. The lower band moving opposite to a strong uptrend might signal the trend’s end. Narrow bands, or a ‘ Bollinger Band squeeze,’ suggest low volatility, with an expectation of volatility increase, potentially leading to significant price movements.
Ultimately, you should know that mastering Bollinger Bands is a journey, not a destination. You must backtest your strategies on historical data, refine your interpretations, and practice disciplined risk management. As you gain experience, you’ll be able to develop an understanding of their language, allowing you to navigate the market with newfound confidence and seize profitable opportunities.
Common Mistakes to Avoid in Bollinger Bands Trading
Bollinger Bands, with their intuitive and visually appealing representation of volatility, have become a mainstay technical indicator for many traders. However, the road to profitable Bollinger Bands trading is paved with cautionary signs. Let’s explore some common pitfalls to avoid, ensuring your Bollinger Band-based strategies don’t hit a dead end.
1. Misinterpreting Signals
It is tempting to view the price touches of the lower or upper Bollinger Bands as absolute buy/sell signals. However, remember that they simply reflect volatility changes. A touch of the upper band isn’t a guaranteed signal of trend exhaustion, just as a touch of the lower band doesn’t automatically scream “oversold.” Interpreting these signals in isolation can lead to premature entries and exits, eroding potential profits.
2. Ignoring Market Context
Bollinger Bands thrive on context. A breakout above the upper band in a trending market holds more significance than the same event in a range-bound environment. Ignoring the broader market trend, support/resistance levels, and other technical indicators can lead to false positives and missed opportunities.
3. Overreliance on Bollinger Bands Alone
While Bollinger Bands offer valuable insights, relying solely on them for trading decisions is a recipe for disaster. Combining them with other indicators like Moving Averages or Relative Strength Index (RSI) paints a more complete picture of market dynamics. Additionally, fundamental analysis shouldn’t be neglected. Bollinger Bands can certainly be a confusing indicator, so understanding the underlying reasons behind price movements adds crucial context to Bollinger Band signals.
Bollinger Bands Strategy – Trade Example
Now that we have covered the basics of the strategy, let’s delve deeper into how the Bollinger Bands strategy works in the live market. As mentioned, there are tons of ways to trade using this indicator; however, here are the two simple and effective Bollinger Bands trading strategies:
Bollinger Bands & Moving Average Strategy
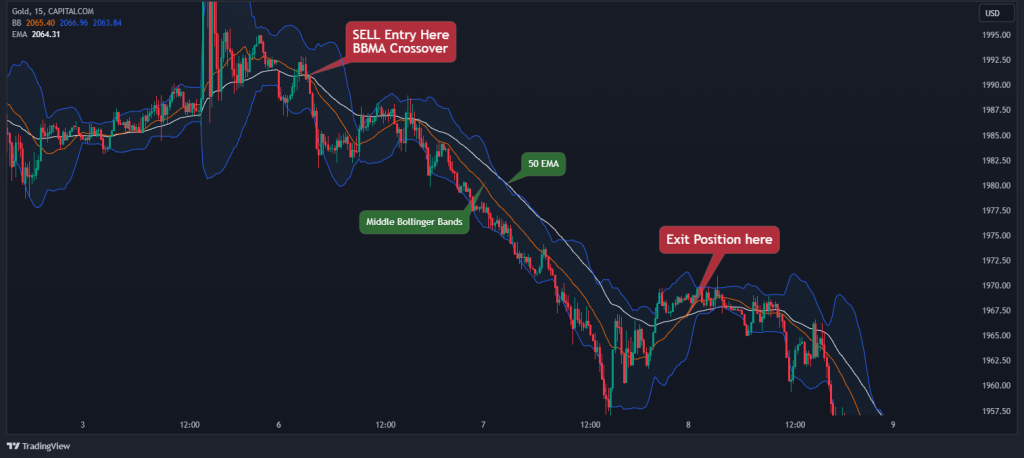
Often referred to as the “BBMA” Strategy, this is the easiest way to trade the Bollinger Bands strategy. Here’s a step-by-step breakdown of how it works:
- Add 50 EMA and Bollinger Bands to your chart (the white line in the chart below).
- Buy when the 50 EMA crosses over the middle Bollinger Band to the upside. Or, sell when the 50 EMA crosses over the middle Bollinger Band to the downside.
- Close your position when there’s a crossover in the opposite direction.
Here’s what it looks like on the chart:
RSI and Bollinger Bands Strategy
Another way to trade with the Bollinger Bands is to combine it with the RSI. Again, traders have different ways of going about this, but we will keep it simple. Remember that the RSI is a leading momentum indicator while the Bollinger Bands is a lagging indicator, which means that combining them helps us spot reversals better.
Here’s a simple way to trade them:
- Wait for the RSI to be overbought or oversold (above or below 70 and 30).
- Ensure that the price is trading outside the Bollinger bands.
- Wait for the price to cross the middle Bollinger band for entry.
As you can see in the Gold chart below, you can confidently open a position if the price fits the above criteria. Here’s a chart demonstrating how it works:
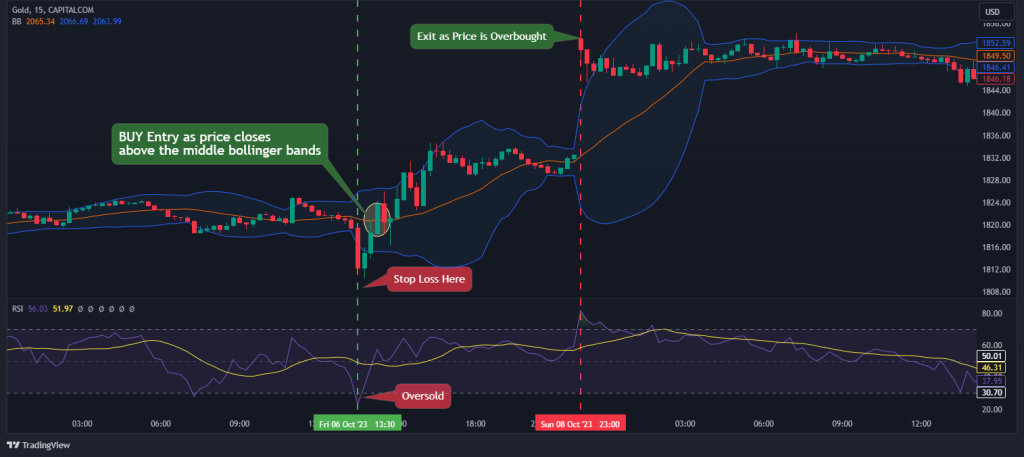
From the example above, we can easily target the next overbought area as our target profit area and set our stop loss order some pips below the swing low.
The Free Bollinger Bands Trading PDF
If you need something to easily refer to when you’re trading, here’s a concise Bollinger Bands PDF. It’s free, by the way:
The Free Bollinger Bands Trading PDF
Is The Bollinger Bands Strategy Profitable?
Here’s the burning question: Is the Bollinger Bands strategy truly profitable? Well, the answer is not black and white, as you may hope. The profitability of the Bollinger Bands strategy hinges on various factors, including market conditions, individual trading plans, and risk management practices.
It would be fair to say that many traders often find success by combining Bollinger Bands with other indicators, confirming signals, and maintaining a favorable risk/reward ratio. Remember, the Bollinger Bands is an indicator, and as such, it should be treated as a trading tool that may assist you in finding trading opportunities. But it must be in conjunction with other tools and a broader trading plan.
Your ability to become a successful trader lies in building trading knowledge and gaining experience and instincts. The good thing – if you need help with that, we are here to help you. By joining our trading academy, you can get full support from our trading coaches and various tools and resources to build your trading career.
Frequently Asked Questions About the Bollinger Bands Trading Strategy
Here are some frequently asked questions about the Bollinger Bands strategy:
What is the success rate of the Bollinger Bands?
The success rate of Bollinger Bands varies based on market conditions and individual trading strategies. Traders often succeed by combining Bollinger Bands with other indicators and confirming signals, aiming for a favorable risk/reward ratio. Success depends on the trader’s skill, market understanding, and risk management.
Do Professional Traders Use Bollinger Band?
Yes, professional traders often incorporate the Bollinger Band indicator into their analysis. The indicator’s versatility in identifying volatility, breakouts, and trend-following opportunities makes it valuable. However, its effectiveness depends on how well it is integrated into a trader’s overall strategy and complemented by other indicators.
What is the best time frame for the Bollinger Bands strategy?
The choice of time frame for the Bollinger Bands strategy depends on individual preferences and trading goals. Shorter time frames (e.g., 1-hour or 15-minute charts) suit day traders seeking quick opportunities. In comparison, swing or position traders prefer longer time frames (daily or weekly charts), aiming for more significant price movements.
Are Bollinger Bands Leading or Lagging?
Bollinger Bands are considered a lagging indicator. They react to price movements rather than predicting them. The bands adjust to volatility, providing a dynamic perspective on price action. Traders often use them with leading indicators to enhance predictive capabilities and make informed decisions based on evolving market conditions.
Risk Disclosure: The information provided in this article is not intended to give financial advice, recommend investments, guarantee profits, or shield you from losses. Our content is only for informational purposes and to help you understand the risks and complexity of these markets by providing objective analysis. Before trading, carefully consider your experience, financial goals, and risk tolerance. Trading involves significant potential for financial loss and isn't suitable for everyone.