- The double moving average crossover strategy uses two moving averages of different lengths to generate buy and sell signals, and identify market trends. It’s most effective in trending markets, helping traders capitalize on market momentum.
- This strategy is best applied in trending markets, where using a long-term EMA as a “directional bias” indicator can significantly improve trade outcomes.
- Executing the strategy involves selecting the right moving average periods, identifying crossover points for trade entries, and managing trades with clear risk parameters to enhance consistency.
Trading strategies often come with a learning curve, but some are more approachable than others. The double-moving average crossover strategy is one such method—simple yet surprisingly effective. Don’t let its simplicity fool you; when used correctly, it can completely change your trading game.
In this guide, we’ll break down how to effectively use this strategy, showing you when and how to unlock its full potential regardless of your trading style.
 Table of Contents
- What is a Double Moving Average Crossover?
- When Should You Use The Double Moving Average Crossover?
- How To Use the Double Moving Average Crossover Strategy
- Double Moving Average Crossover Settings
- EMA vs. SMA: Which is Better for the Crossover Strategy?
- Summary – Is the Double Moving Average Crossover Strategy Profitable?
- FAQs
What is a Double Moving Average Crossover?
Traders learning how to trade with moving averages usually come up with different types of moving average trading strategies, ranging from simple strategies to much more complicated ones. One of these moving average trading strategies is the double moving average crossover.
In simple terms, the double moving average crossover is a trading strategy that uses two different moving averages of different lengths and waits for the crossover for entry and exit signals. This particular trading strategy can work wonders when the market is trending, however, it can also be extremely helpful in a choppy or ranging market, when trades utilize the range trading strategy.
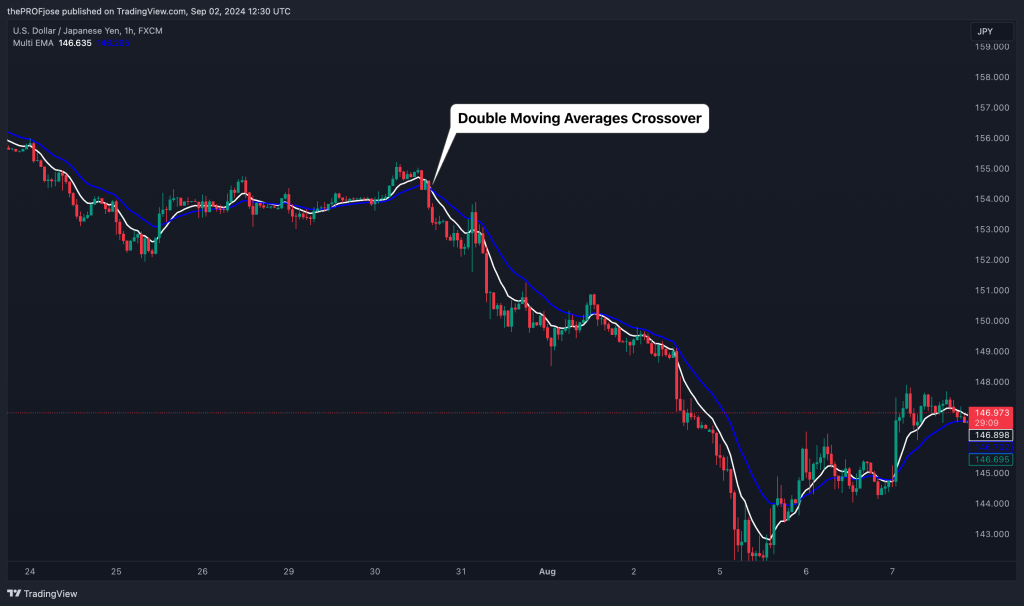
As seen in the chart above, the double moving average crossover strategy involves using two moving averages – a short and long – to identify entry and exit levels whenever a double moving average crossover occurs. And, much like the triple moving average crossover strategy, it is known as a simply yet accurate trading technique for spotting trading opportunities.
When Should You Use The Double Moving Average Crossover?
Before we start exploring how to use this moving average trading strategy, it is important to stack the odds of success in your favor by knowing where the strategy gives you the best edge in the market.
It is a popular fact that the moving average indicator is a trend-following indicator. This implies that you’ll get the best results when using this strategy in a trending market. Now that we know the best market for using the double-moving average trading strategy, the next logical question to ask is: how do I know the trend?
The short answer is: that there are many ways to go about it. But we are going to limit ourselves to the one that complements this strategy effortlessly.
This method is by using a long-term exponential moving average to get the overall trend. For instance, if you are using the 9 and 21 EMA for your double crossover strategy, you can then use the 100 EMA as your “directional bias” indicator. Here’s what it looks like on the chart:
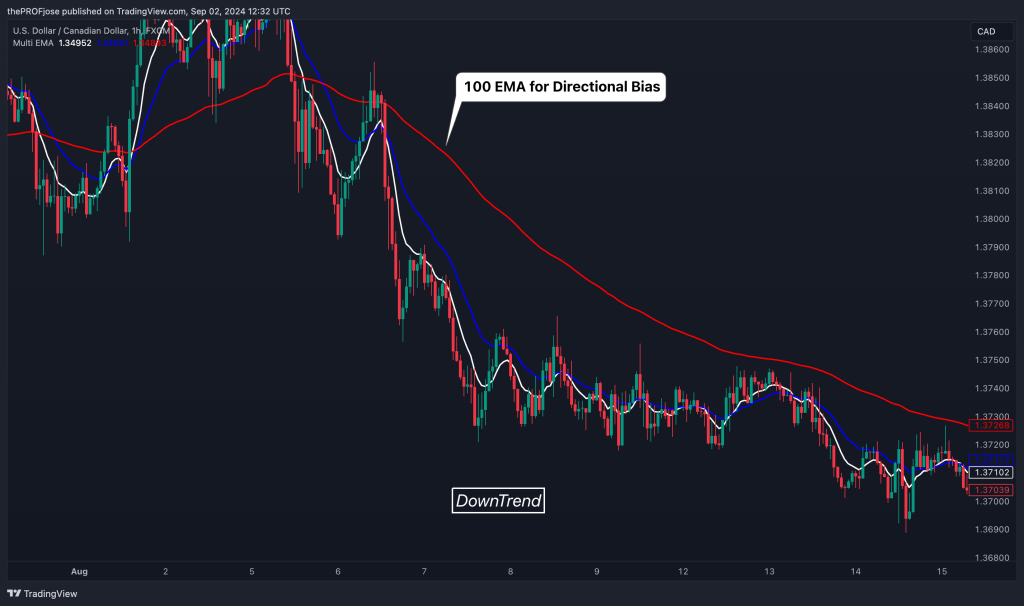
What may not be obvious from the chart above is that using this method, you’ll tend to take fewer trades compared to most traders using the same strategy, but you’ll be able to avoid bad trades and effortlessly increase your win rate.
Of course, this is not a holy grail; however, if you use this method to filter out the trades you are taking, you can significantly increase your chance of making a consistent profit with the double-moving average trading strategy.
How To Use the Double Moving Average Crossover Strategy
As mentioned earlier, the double moving average crossover strategy involves two moving averages—typically, a short-term and a long-term one. The idea is simple: when the short-term moving average crosses above the long-term moving average, it’s often seen as a signal to buy. Conversely, when the short-term moving average crosses below the long-term moving average, it’s a cue to sell.
Now, let’s see how to use the double-moving average crossover strategy.
Step 1: Choosing Your Moving Averages
First things first, you need to select the periods for your moving averages. Traders oftentimes use the 50-day exponential moving average as the short-term and the 200-day exponential moving average as the long-term. Take a look at the chart below:
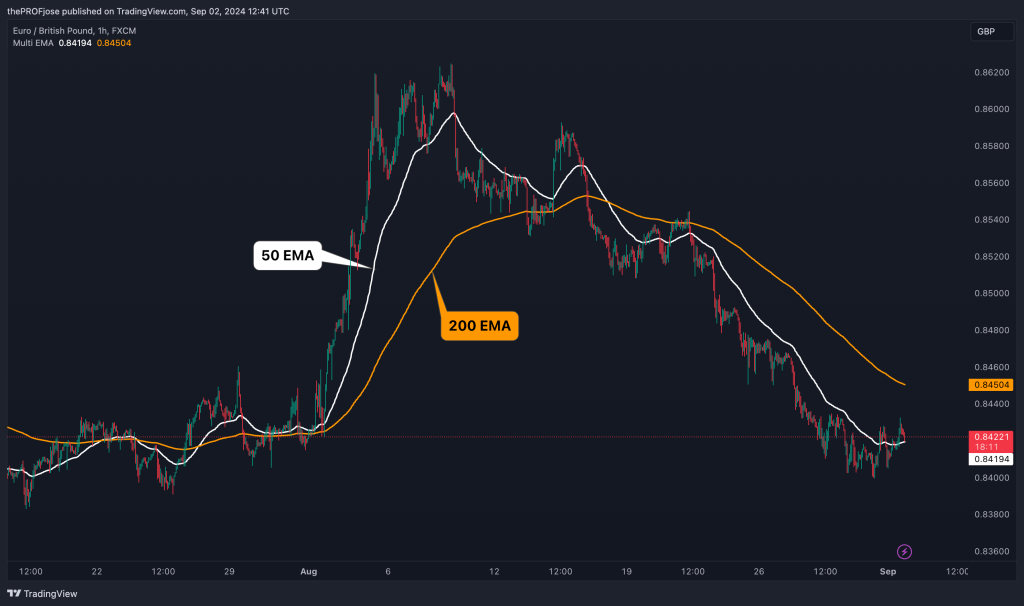
This combination is widely used because it seems to balance responsiveness with reliability, giving you a clear view of potential market shifts without too much noise. It’s important to mention here that these are not the only settings available for this strategy; we will list some other ones later in the article.
Pro tip: Rather than install the two moving averages separately, you can install a “multi-EMA” indicator and configure it to your preferred settings.
Step 2: Identifying the Crossover
After setting up your technical indicators, the next step is looking for a crossover, which typically provides a signal for a change in trend direction. When you are in an uptrend, you should be looking for the short-term moving average to cross above the long-term moving average in order to enter a long position.
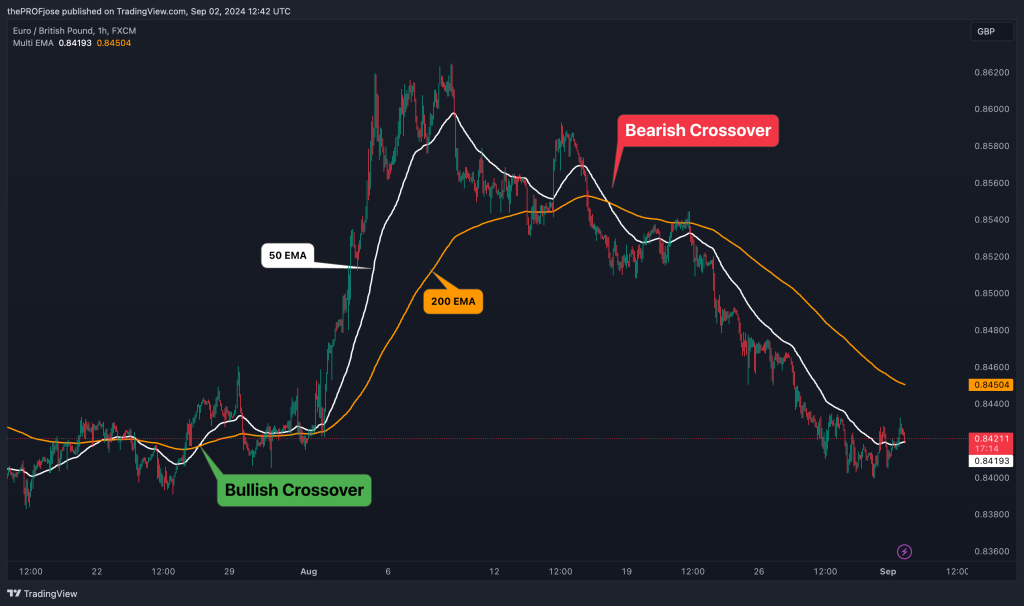
On the other hand, the best entry point for a short trade is to wait for the short-term moving average to cross below the long-term one.
Step 3: Execution and Trade Management
Before you hit that trade button, think about your risk management strategy—where will you place your stop-loss? What’s your profit target? Setting these parameters in advance, as opposed to setting a “mental stop loss,” can help you navigate the emotional ups and downs of trading.
Remember, your work isn’t done even after you’ve entered a position. One thing every trader will have to learn as time goes on is that the market is chaotic by nature, and trends can shift unexpectedly.
So, the last step is to keep an eye on your moving averages to see if they signal a reversal. If the trend continues in your favor, you might consider adjusting your stop-loss to lock in profits. On the other hand, if the market shows signs of reversing before getting to your profit target, it might be time to exit the trade.
This double moving average strategy cuts across all kinds of moving averages. It could be the simple, exponential, or the weighted moving average. It could even be used with similar indicators, such as the VWMA and McGinley.
Double Moving Average Crossover Settings
When it comes to trading with the double-moving average crossover strategy, one size doesn’t fit all. The success of this strategy largely depends on the settings of the moving averages you choose.
One of the most overlooked but important steps in finding a profitable edge is what we now call a “trader-strategy fit.” This refers to finding or tailoring a particular strategy to your trading style and personality. So, different settings can suit different trading styles, timeframes, and market conditions.
Let’s look into some of the top settings that traders use and how you can apply them to your trading.
1. The 5 and 9 Moving Averages
If you’re someone who prefers a quick entry and exit, the 5 and 9 moving average combination might be right up your alley. This is part of the 9-EMA trading strategy, which is often used by short-term traders. These shorter timeframes make the strategy more sensitive to recent price changes, allowing you to capture short-term trends. This setup is particularly popular among scalpers who need to react swiftly to market movements.
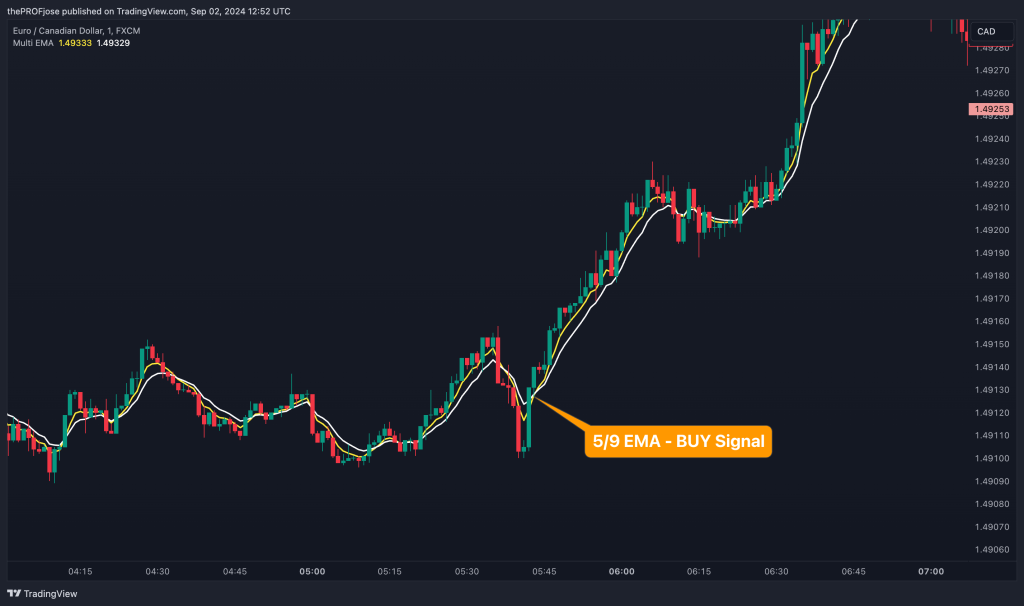
However, the downside of this speed is the potential for more false signals—meaning you might find yourself in and out of trades more frequently. To mitigate this, you might want to combine this setup with other indicators, as we suggested earlier, to confirm the trend’s strength before entering a trade. For that purpose, some good indicators include the Relative Strength Index, MACD, and the Stochastic RSI indicator.
2. The 9 and 21 Moving Averages
For those looking for a balance between speed and reliability, the 9 and 21 moving averages offer a middle ground. This combination smooths out some of the noise you might encounter with shorter moving averages while still allowing you to catch trends relatively early.
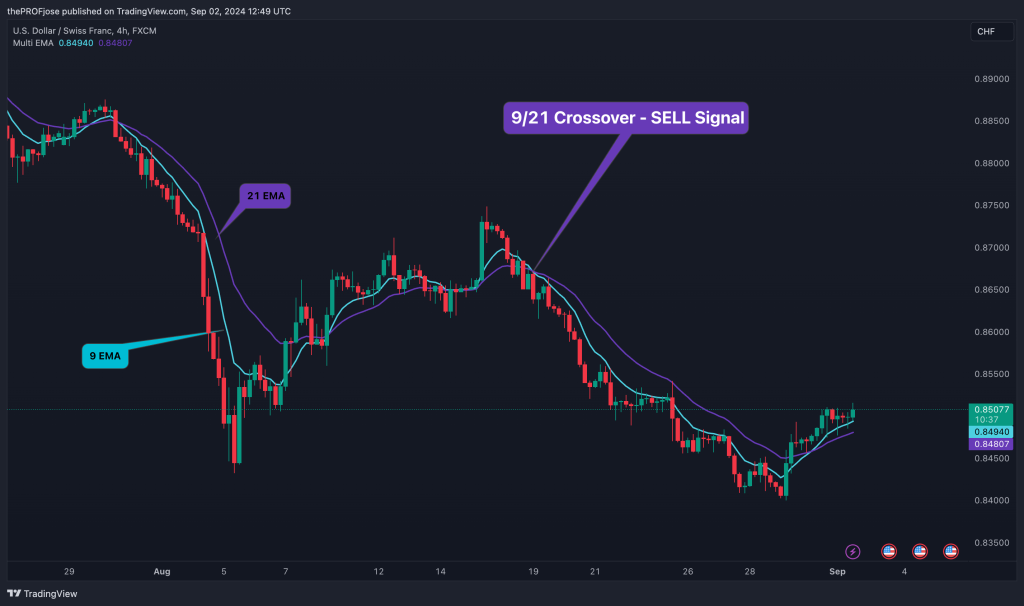
The 9 and 21 moving average setup is well-suited for day traders who hold positions for a little longer than a typical scalper. It provides a good mix of responsiveness and stability, reducing the number of whipsaws compared to shorter moving averages but still offering timely entry and exit points.
3. The 50 and 200 Moving Averages
If your trading style leans more towards swing trading, the 50 and 200 moving averages are the classic choice. This setup is less about catching short-term fluctuations and more about identifying significant trend reversals.
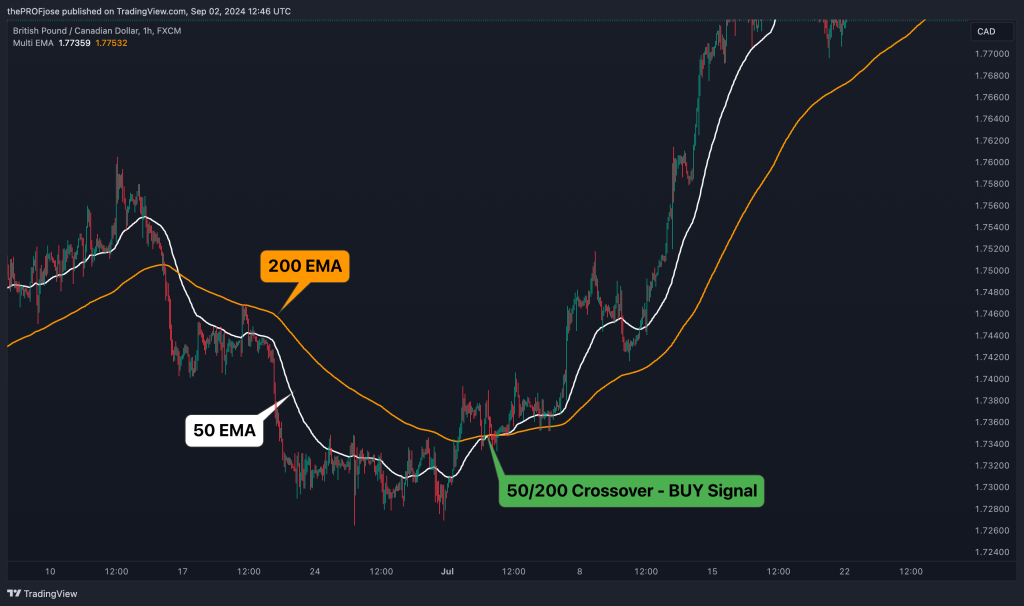
When the 50-day moving average crosses above the 200-day moving average, it signals a major bullish trend, often referred to as the “Golden Cross.” Conversely, when the 50-day moving average dips below the 200-day, it indicates a potential long-term downtrend, known as the “Death Cross.”
This setup isn’t just popular among retail traders alone, as part of the smart money concept strategy, it is said to be used by some reputable institutional traders and investors who are more interested in the bigger picture and less concerned with daily price movements as well.
While this particular strategy won’t get you in or out at the perfect time, it’s reliable for capturing the meat of a long-term trend.
There are many more Double EMA crossover strategies out there. Of those, we have found these two to be quite effective:
EMA vs. SMA: Which is Better for the Crossover Strategy?
When setting up your moving averages, another crucial decision you’ll need to make is whether to use the Exponential Moving Average (EMA) or the Simple Moving Average (SMA). Each has its strengths and is suited to different trading styles. So, here’s our suggestion:
- Use SMA if you prefer a slower, more stable approach, focusing on long-term trends and reducing the risk of false signals.
- Use EMA if you need a quicker response to recent price changes and are more comfortable with a strategy that might generate more signals but also offers the potential for quicker entries and exits.
Summary – Is the Double Moving Average Crossover Strategy Profitable?
In conclusion, rather than just throw our opinion around on whether the double moving average crossover strategy is profitable or not, let’s just see how the strategy performs over the space of one month and draw our conclusion from there.
So, let’s track EUR/USD on a 1-hour timeframe using the 9 and 21 EMA Crossover settings. Here’s a screenshot of the result:
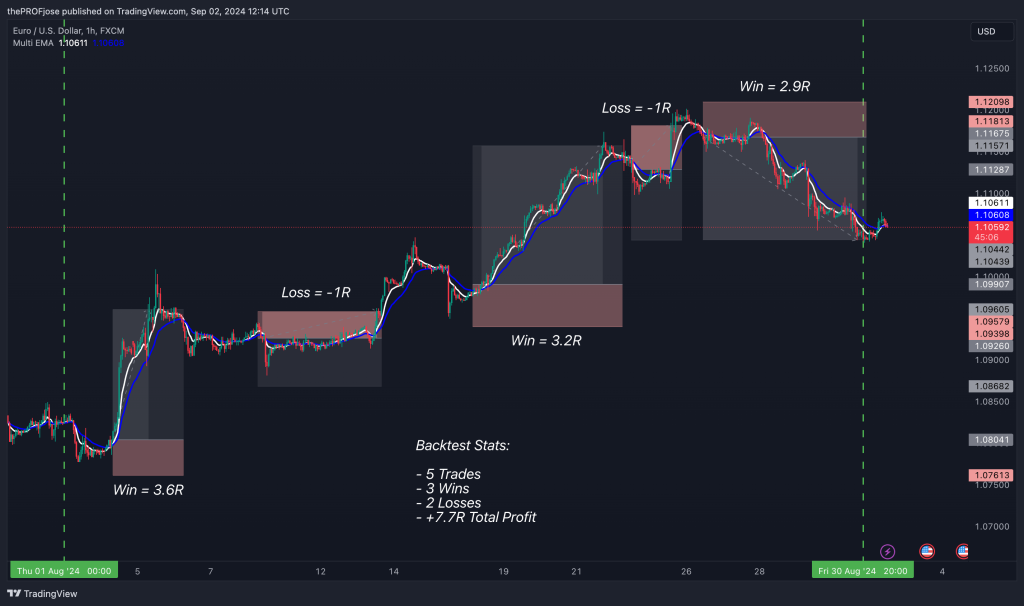
As you can see, within the space of a month, we took 5 trades, with a 60% win rate, an average of 3 risk-reward ratio and a total of 7.7R profit by the end of the month.
While this is not how every month will look like while trading this strategy, it gives you a rough idea of what to expect. It also serves as proof that the double-moving average crossover strategy can be profitable.
So, it is more than likely that the double-moving average crossover strategy is profitable if used correctly. However, if you wish to use this strategy, you must find the settings that work best for you and backtest your strategy on a demo account before applying it to a live trading account.
Frequently Asked Questions
Before we wrap up, let’s address some common questions traders often have about the double-moving average crossover strategy.
What happens when two moving averages cross?
When two moving averages cross, it typically signals a change in market trend. If a shorter moving average (representing recent price movements) crosses above a longer moving average, this is often seen as a bullish signal, indicating that prices may continue to rise. Conversely, if the shorter moving average crosses below the longer moving average, it’s considered a bearish signal, suggesting that prices may continue to fall.
What is the best double-moving average crossover combination?
There’s no single “best” double-moving average crossover combination. However, we recommend traders should experiment between 5 and 9 EMA crossover, 9 and 21 EMA crossover or 50 and 200 SMA crossover and settle with whichever works best for them.
What is the double EMA crossover strategy?
The double EMA crossover strategy uses two EMAs of different periods to generate buy or sell signals. A buy signal occurs when the short-term EMA crosses above the long-term EMA, while a sell signal occurs when it crosses below. This strategy is preferred for its quick response to price changes, making it ideal for volatile markets.
Risk Disclosure: The information provided in this article is not intended to give financial advice, recommend investments, guarantee profits, or shield you from losses. Our content is only for informational purposes and to help you understand the risks and complexity of these markets by providing objective analysis. Before trading, carefully consider your experience, financial goals, and risk tolerance. Trading involves significant potential for financial loss and isn't suitable for everyone.


