- The Supertrend Indicator is a versatile technical analysis tool applicable across different time frames and instruments.
- It functions like moving averages, combining trend detection with volatility assessment using Average True Range.
- The indicator is particularly useful for identifying trading entry and exit points and setting stop-loss orders.
As traders, most of our analysis centers around knowing the trend, where to get into the market, and where to exit the market. While there are a thousand and one ways to do this in the market, using the super trend indicator is one of the most effective.
This article will cover everything you need to know to get started using this indicator. So, let’s get to it.
- What is the Supertrend Indicator?
- Why is the Supertrend Indicator Useful for Traders?
- How to Use the Supertrend Indicator in Trading
- The Supertrend Indicator Trading Strategy Tutorial
- What are the Benefits and Limitations of the Supertrend Indicator?
- Key Takeaways
- Frequently Asked Questions About the Supertrend Indicator
What is the Supertrend Indicator?
Developed by Olivier Seban, the Supertrend combines trend detection with volatility based on the Average True Range (ATR) indicator. This combination allows the indicator to signal changes in trend direction and assist in positioning stop-loss orders.
Technically, the Supertrend Indicator is a trend-following tool used in technical analysis for trading. Functionally, it is overlaid on a trading chart, where its plots indicate the current trend direction. The Supertrend is versatile in application, as it can be used with various time frames like daily, weekly, or intraday and across different trading instruments, including stocks, futures, or forex.
The mechanics of the Supertrend technical analysis indicator are similar to moving averages. It is typically represented alongside the price on a chart, with its position relative to the price indicating the prevailing trend. The core of this indicator is built on just two parameters: the multiplier and the period. This simplicity in design makes it a fundamental yet effective technical analysis tool for traders.
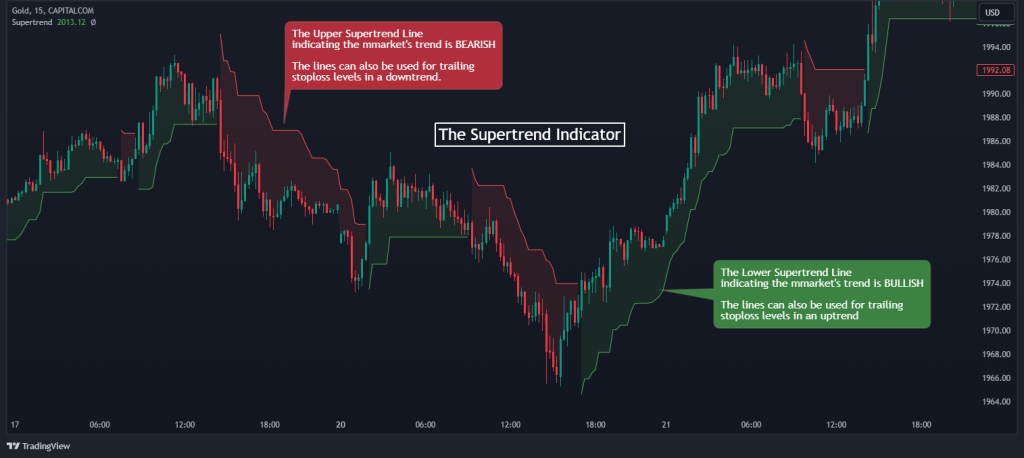
As you can see in the chart above, the interpretation of the Supertrend indicator is extremely simple. The indicator presents a green line when the market’s trend is bullish and a red line when the market’s trend is bearish. This data is based on a predefined number of previous candlesticks’ closing prices, which can give a strong indication of the market’s sentiment.
Why is the Supertrend Indicator Useful for Traders?
The Supertrend indicator is important to traders for several reasons:
1. Trend Identification
It helps traders easily identify the current trend direction. Since the indicator adjusts to volatility, it provides a clear visual cue on whether the market is trending up or down, making it easier to align trades with the prevailing trend.
2. Adaptive to Volatility
Unlike fixed-period moving averages, the Supertrend uses the ATR (Average True Range) to adapt to changing market volatility. This means it can adjust its threshold levels to be more or less sensitive depending on market conditions, reducing the likelihood of false signals during periods of high or low volatility.
3. Clear Entry and Exit Signals
The Supertrend indicator provides straightforward buy and sell signals based on crossovers. When the price crosses above the Supertrend line, it signals a potential buying opportunity, while a cross below the line suggests a selling opportunity. This simplicity can help traders make quick decisions.
4. Support and Resistance Levels
The Supertrend line often acts as a dynamic support or resistance level. During an uptrend, it can act as a support level, while in a downtrend, it can serve as resistance. Traders can use these levels to set stop-loss orders or determine entry points.
5. Reduction of Noise
The indicator helps filter out market noise and focus on the underlying trend. By smoothing out price fluctuations with the ATR, it can help traders avoid reacting to short-term price movements that might not reflect the broader trend.
6. Versatility
The Supertrend indicator can be used across various time frames and markets. Its adaptability makes it useful for both short-term trading and longer-term investing strategies. Traders can adjust the ATR multiplier to fine-tune the indicator to their specific trading style and time frame.
7. Trend Reversals
It helps in identifying potential trend reversals. When the Supertrend line changes direction, it can signal a potential change in the market trend, providing traders with an opportunity to adjust their positions accordingly.
How to Use the Supertrend Indicator in Trading?
Like other indicators, there are endless ways to use the Supertrend indicator. Along the way, you may find your own way to find trading opportunities using this indicator; however, there are several common ways you can start using the Supertrend indicator in your everyday analyses. Here are some of them:
1. Identifying Trends
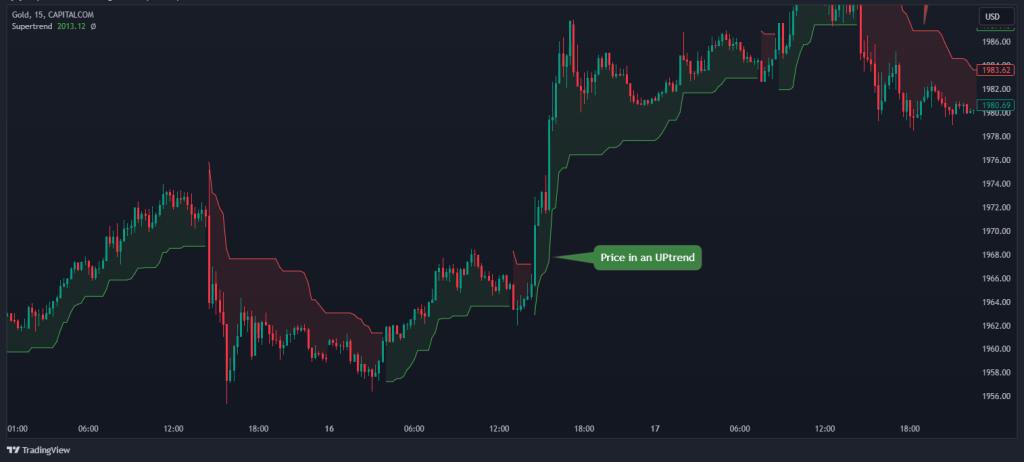
Primarily, the Supertrend indicator offers a clear view of market trends. As the name implies, the Supertrend is there to help you identify the strength of a price trend.
When the price consistently stays above the Supertrend line, it signals an uptrend, suggesting that the asset’s price may continue rising. On the other hand, a price below the line indicates a downtrend, indicating a likely fall in the asset’s price.
More importantly, as you can see in the gold chart below, the bands of the Supertrend indicator tend to narrow when there is a strong trend and widen when the market is consolidating.
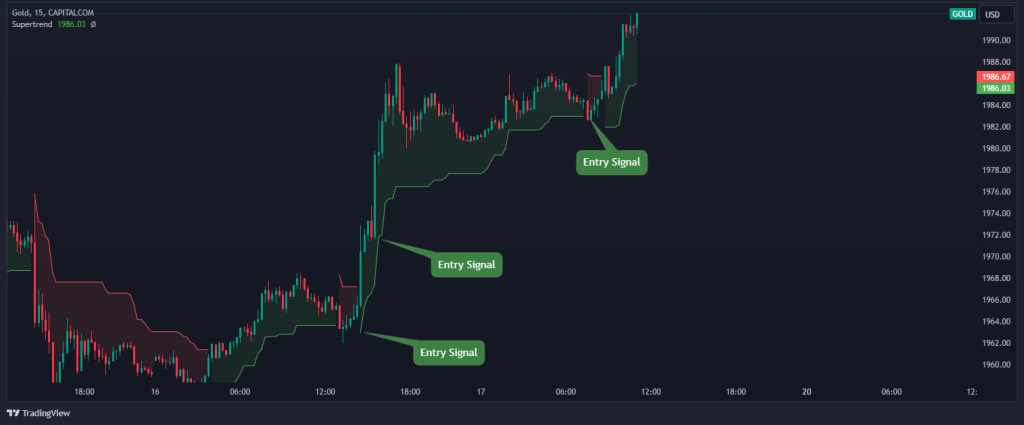
2. Discovering Entry and Exit Points
When using the Supertrend technical indicator, traders can also spot potential buy and sell signals with the Supertrend indicator. The technique is pretty simple – A price pullback to the line in an uptrend or a rally to the line in a downtrend can indicate temporary dips or retracements in the trend, offering entry and exit signals. It is, therefore, an excellent indicator for those who utilize the pullback trading strategy or the counter-trend strategy.
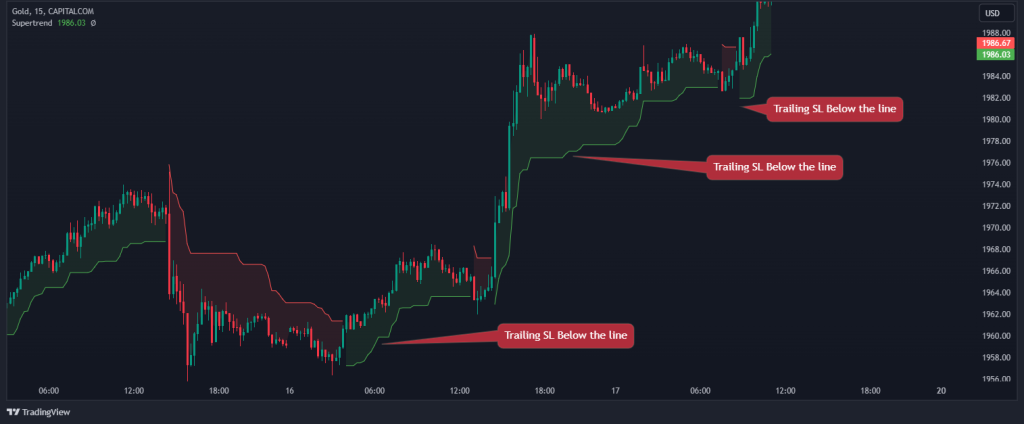
3. Setting Trailing Stoploss
The Supertrend lines can be used for setting dynamic trailing stops. For instance, in an uptrend, traders might trail their stop loss along the rising lower Supertrend line, adjusting it as the trend continues. This technique is particularly useful for those who wish to automate their trading.
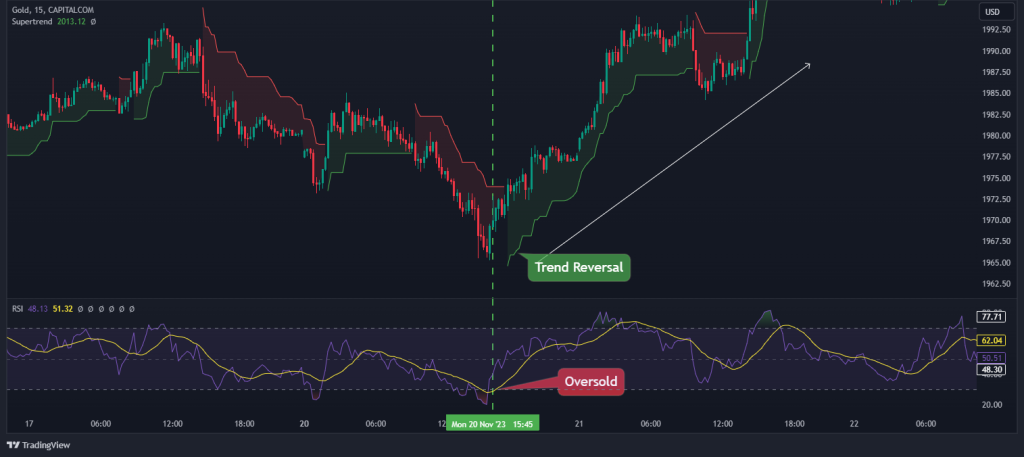
Identifying Market Reversals
Finally, since the supertrend indicator is a trend-following indicator, it can also help you identify trend reversals. Normally, the price is likely to hit the upper or lower bands when the existing trend is about to reverse. But, to increase the chances of success and to determine overbought or oversold market conditions, the Supertrend indicator can be effectively combined with the Relative Strength Index (RSI). This combination helps confirm Supertrend signals and helps us anticipate a reversal.
Almost like the Supertrend indicator is the Half trend indicator. Both tell trends just well but the half trend is a little more sensitive to price movements, making it suitable for more shorter-term trading. See how to use it here:
The Supertrend Indicator Trading Strategy Example
Now that we understand the supertrend indicator and how it works, let’s take a step further and use our newfound knowledge to analyze a real chart.
Before we dive into the example, remember that the Supertrend indicator can work on any timeframe. So, in this case, we will be using it in the 15-minute timeframe on EUR/USD. Like most technical indicators, the Supertrend Indicator works best with another indicator. In this case, we will use it alongside the 50 Exponential Moving Average (EMA) indicator.
1. Trade Setup
First, let’s add the two indicators on a price chart:
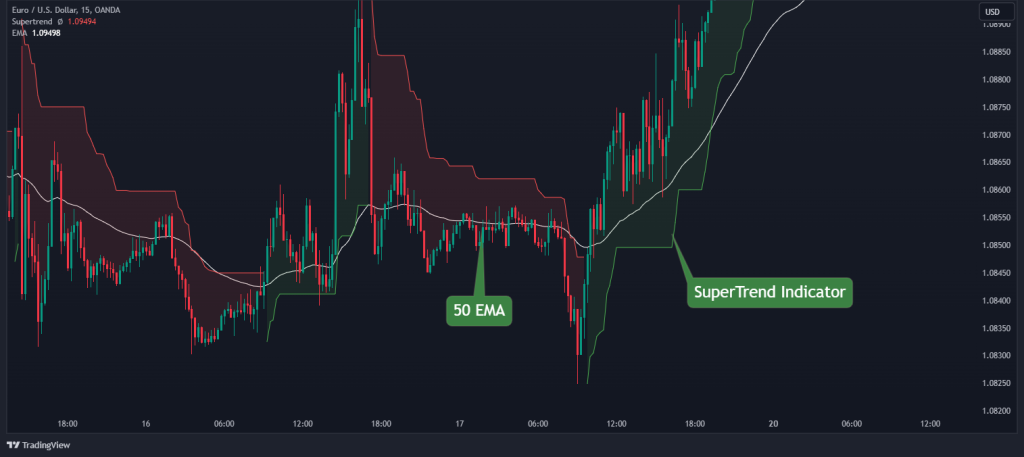
After setting up our chart, it’s good to understand how the strategy works. The first thing is to determine the trend. The chart above shows that the Supertrend indicator is green, telling us that the trend is bullish. In this case, we are preparing to enter a long position.
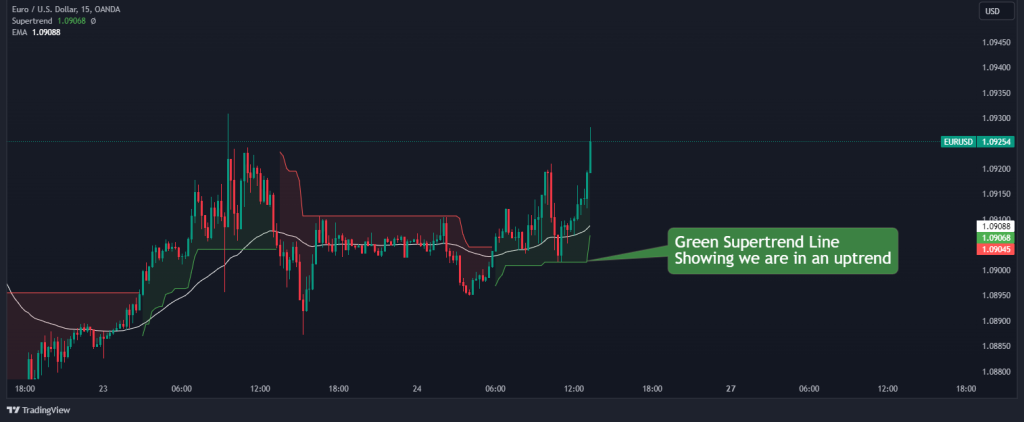
As you can see, upon using the Supertrend indicator’s signals, we can notice that buying pressure is building up. As the price breaks above a tight support and resistance level and the previous swing high, a buy signal is given.
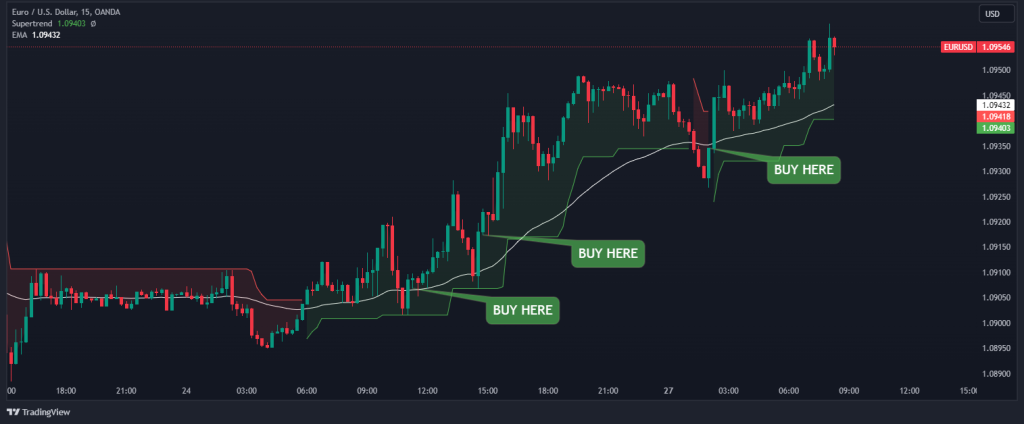
2. Trade Entry
Now that we know the trend, it’s time to plan our entries, and that’s where the 50 EMA comes in. As you can see in the chart below, to enter a long trade, we simply have to wait for the price to pull back to the 50 EMA indicator, as shown above. In a very strong trend, we can have many opportunities to enter new positions as the price continuously pulls back to the 50 EMA, as shown in the chart below.
That’s it. As you can see, integrating the supertrend in your trading strategies can clearly help you find trade opportunities. It is a user-friendly indicator that is often known as highly accurate and reliable, especially when used in conjunction with other indicators.
3. Risk Management
The risk management technique here depends heavily on how you go about your trading. However, we recommend placing your stop loss below the most recent swing low in a bullish scenario. And in a bearish scenario, place your stop loss just above the most recent swing high.
And for each entered trade, you can exit when the price crosses the EMA to the other side of your trading signal. While this can sometimes get you out of trades too quickly, it guarantees the optimal exit for the short-term trader. Swing traders, on the other hand, may just exit their trades when the Supertrend gives an opposing signal.
Another way to exit is to simply set a profit target with the minimum being a 1:1 risk-to-reward ratio.
What are the Benefits and Limitations of the Supertrend Indicator?
The Supertrend Indicator is celebrated for its simplicity and efficacy in trend identification in trading. Despite its advantages, the Supertrend Indicator does have some limitations. Let’s take a closer look at them.
Benefits of Using the Supertrend Indicator
A major benefit of the super trend indicator is its ease of interpretation; even beginners find its calculation and presentation straightforward. This user-friendliness extends to the configuration, as it involves a minimal number of input variables, allowing traders to tailor it to their specific needs with relative ease.
Pros
- Supertrend is known for producing accurate signals, especially in trending markets where it ranks among the most reliable indicators
- It can be used in any timeframe, enhancing its utility across various trading styles
- It quickly detects changes in trends, providing timely insights for intraday traders and those looking to respond swiftly to market movements
- This indicator is available for free on several trading platforms
Limitations of the Supertrend Indicator
Its primary drawback is being a lagging indicator, meaning it provides signals after the trend has already started. This delay can sometimes lead to missed opportunities or late entries in the market. Additionally, it relies on only two parameters (multiplier and period length), which may not always be sufficient to predict market movements under all conditions.
Cons
- Signals are provided post-trend initiation, potentially leading to delayed actions
- With just two parameters, its predictive capability may be insufficient in complex market scenarios
- The indicator may generate false signals during consolidation or sideways trending markets
- At times, its outcomes may contradict those of other technical tools, leading to confusion in decision-making
Key Takeaways
- The Supertrend Indicator is a user-friendly and versatile tool that operates on two main parameters (multiplier and period), making it a straightforward yet effective tool for trend identification.
- By calculating previous candlesticks, the supertrend indicator present a green or red line, also known as upper and lower lins, acting as support and resistance levels, and aids in identifying market trends and potential entry/exit points.
- Due to its functionality, using the supertrend indicator is straightforward, although it works best when combined with technical indicators and tools.
- While the Supertrend Indicator is known for its accurate signals and ease of use, it is a lagging indicator with limitations in complex market scenarios and can produce false signals in non-trending markets.
Frequently Asked Questions About the Supertrend Indicator
Here are some frequently asked questions about the Supertrend indicator:
Is Supertrend a lagging indicator?
Yes, the Supertrend is a lagging indicator. This means it tends to provide signals after the trend has already begun, which is typical of indicators that use historical data to project future trends.
Does a Supertrend indicator work?
The Supertrend indicator does work, particularly in trending markets. It is known for accurately identifying trend directions and providing potential buy or sell signals. However, its effectiveness can vary depending on market conditions and the traded asset.
What is the best time frame for a Supertrend indicator?
The best time frame for a Supertrend indicator can vary depending on the trader’s style and objectives. It is versatile and can be used in any timeframe, from intraday to daily, weekly, or even longer. Traders often tailor the time frame to suit their individual trading strategies and the market dynamics of their specific asset.
Risk Disclosure: The information provided in this article is not intended to give financial advice, recommend investments, guarantee profits, or shield you from losses. Our content is only for informational purposes and to help you understand the risks and complexity of these markets by providing objective analysis. Before trading, carefully consider your experience, financial goals, and risk tolerance. Trading involves significant potential for financial loss and isn't suitable for everyone.