The Fisher Transform indicator converts price data into a Gaussian normal distribution, thereby giving insights into price turning points and market trends. Primarily, the Fisher Transform is an impressive trend reversal indicator, especially when combined with other indicators.
- The Fisher Transform is a technical analysis indicator that transforms price data into a Gaussian Probability Distribution, reducing lag and providing more timely signals.
- By normalizing asset prices, it can help traders identify turning points in price action.
- It is versatile and can be applied to various financial assets and timeframes.
In this article, we explore the Fisher Transform Indicator’s intricacies, how to trade with it, and its benefits and limitations. By understanding this tool, you can make informed decisions and enhance your trading edge effectively.
- What is the Fisher Transform Indicator?
- How Does the Fisher Transform Indicator Work?
- How to Use the Fisher Transform Indicator in Trading
- Fisher Transform Indicator Trading Strategy Tutorial
- What are the Benefits and Limitations of the Fisher Transform Indicator?
- What is the Difference Between the Fisher Transform Indicator and MACD?
- Key Takeaways
- Frequently Asked Questions
What is the Fisher Transform Indicator?
The Fisher Transform Indicator, developed by John F. Ehlers, is a robust tool for analyzing financial markets. Its primary objective is to convert price data into a Gaussian normal distribution, thereby providing traders with enhanced insights into turning points and market trends.
Through mathematical calculations involving natural logarithms, the Fisher Transform effectively amplifies extreme price movements, offering a clearer perspective on potential market reversals.

Typically, traditional technical analysis tools often struggle to accurately capture turning points in asset prices, especially in volatile markets. For that matter, the Fisher Transform trend indicator seeks to address this issue by offering traders a more precise view of market dynamics. By focusing on normalization and oscillation around zero, biases are eliminated from the indicator, making it more effective in detecting turning points.
How Does the Fisher Transform Indicator Work?
To calculate the Fisher Transform formula, a series of mathematical steps are involved. First, the midpoint is determined using the highest high and lowest low within a specified period, serving as a reference point for normalizing the price data.
The core of the Fisher Transform involves a formula that employs natural logarithms and the hyperbolic tangent function. This formula skillfully maps the normalized price data onto a Gaussian normal distribution scale, further enhancing the indicator’s ability to identify extreme price movements.
Generally, the Fisher Transform’s strength lies in its ability to spot potential turning points in the market. By amplifying extreme price values, it effectively identifies overbought and oversold conditions, signaling when the market may experience a reversal.
Moreover, the indicator helps traders recognize trends, with values above a certain threshold indicating a bullish trend and values below it suggesting a bearish trend. This straightforward approach enables traders to align their different trading strategies with the prevailing market trend.
To further enhance the usability of the Fisher Transform, traders often apply smoothing techniques to the indicator’s values. This includes using moving averages or custom smoothing algorithms, effectively eliminating noise, and refining the signals provided by the indicator, making it more easily interpretable and actionable.
How to Use the Fisher Transform Indicator in Trading
There are several to use the Fisher Transform indicator. But first, let’s understand how to interpret the Fisher Transform indicator. Technically, the indicator’s values range from -300 to +300, with zero normally representing a shift in momentum. The Fisher Transform indicator has two lines, with one of the lines known as Fisher and the second line known as the Trigger.
Like many other indicators, traders often look for a crossover between the two lines to determine when to enter or exit a position. In addition, traders often use the zero crossing to join an existing trend.
Below, we discuss the different ways to use the Fisher Transform Indicator in your trading.
1. Identifying Reversals and Trend Continuation Signals
Identifying potential points of price reversal and trend continuation is one of the things the Fisher Transform indicator does best. Simply apply it to your chart and watch its lines cross over one another. These reversals are often more sure when they come at the top (for bearish reversals) or bottom (for bullish reversals) of the indicator.
To identify trend continuation signals, traders usually search for zero line crossing when the blue line is above the red line in an uptrend and vice versa in a downtrend.
2. Divergences
Because the Fisher Transform indicator oscillates, it is also a great divergence tool. For those unaware, divergences in trading occur when the price goes in a different direction from the indicator. For instance, it’s a bullish divergence when the indicator forms a higher high, but the price makes a lower high. It also happens when the indicator forms a higher low, but the price forms a lower high.
Conversely, it is a bearish divergence when the indicator forms a lower high, but the price forms a higher high. It’s also a bearish divergence when the indicator forms a lower low while the price forms a higher low.
Fisher Transform Indicator Trading Strategy Example
When used in combination with other indicators, the Fisher Transform can further enhance trading results, providing valuable insights for traders to make informed decisions and optimize their trading strategies.
In the following examples, we explore the combination of the Fisher Transform indicator with the highly effective Fibonacci retracement tool and the Relative Strength Index. We will demonstrate how to use the Ehler-Fisher trading strategy alongside RSI and Fibonacci retracement levels to maximize its potential in trading.
Use the Fisher Transform Indicator with RSI
The Fisher Transform Indicator can significantly improve trading accuracy when used alongside the Relative Strength Index (RSI). Let’s explore how this Fisher Transform indicator strategy can help you identify potential entry and exit points. Here’s what you need to do to utilize this Fisher Transform strategy:
1. Place your Fisher Transform and RSI on your chart.
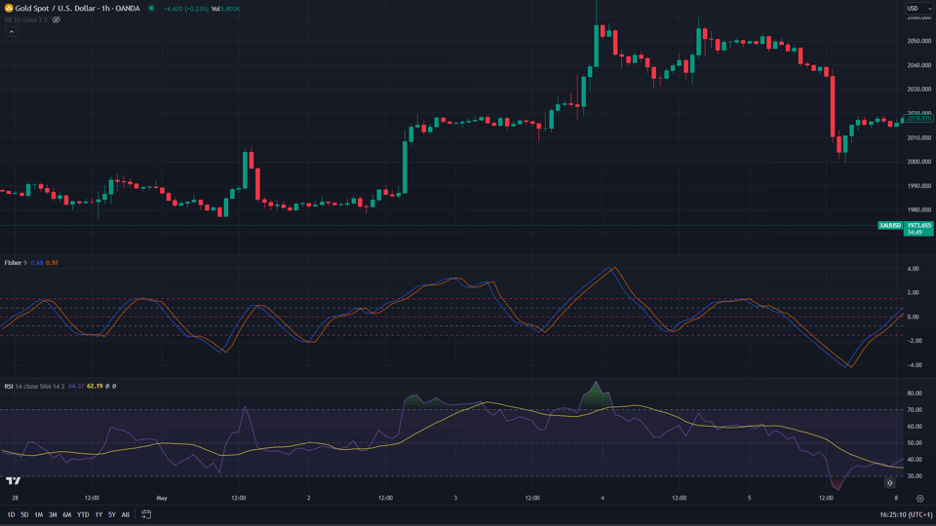
2. Edit the length of the Fisher to match the period of the RSI. By default, the Fisher has a length of 9, and RSI has a period of 14. So, go to the settings of the Fisher and change “Length” to 14.

3. Make buy trades when the Fisher Transform makes a bullish crossover while the RSI gives a bullish signal. The same goes for bearish trades. Wait for both indicators to provide a sell signal and make a bearish trade.

4. Place your stop loss right above the most recent swing high in bullish trades. In bearish trades, place it just beneath the most recent swing low. Take profit can be placed once there’s an opposite crossover between the lines.

Trading the Fisher Transform Indicator with Fibonacci Retracement Levels
Another way to use the Fisher Transform indicator is by combining it with the Fibonacci retracement tool. Fibonacci Retracement Levels are widely regarded in trading to identify potential support and resistance levels.
By combining the Fisher Transform Indicator with Fibonacci levels, traders gain valuable insights into possible entry and exit points. Here’s how to use them:
1. Identify a robust trend on the price chart.

2. Draw Fibonacci Retracement levels from the recent swing low to high (in an uptrend) or the recent swing high to low (in a downtrend).

3. Wait for the price to retrace to one of the Fibonacci retracement levels. In our example, the price retraces to 50% or 61.8% Fibonacci levels.

4. Patiently wait for the Fisher Transform Indicator to cross above or below its trigger signal line as a potential entry point confirmation.
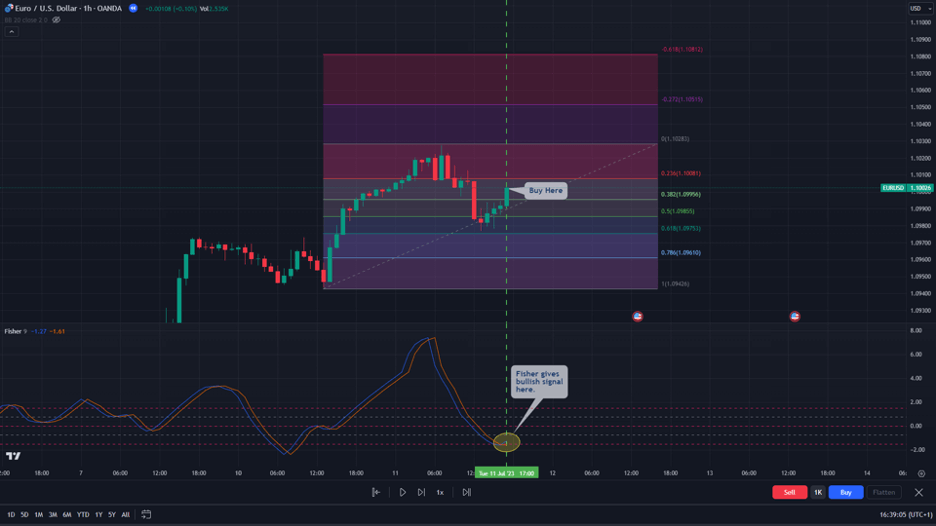
5. For buyers, protect your capital by placing the Stop Loss slightly below the most recent Fibonacci support level. For sellers, protect your capital by placing the Stop Loss slightly above the most recent Fibonacci resistance level.
6. Consider exiting the trade or taking partial profits at key Fibonacci extension levels like 161.8% or 261.8% for a good Take Profit strategy.

What are the Benefits and Limitations of the Fisher Transform Indicator?
The Fisher Transform Indicator is a powerful tool used in trading to identify potential buy and sell signals. Still, like any technical indicator, it has its own pros and cons. Here are the benefits and limitations of using the Fisher Transform Indicator:
Benefits of Using the Fisher Transform Indicator
The Fisher Transform Indicator excels at providing clear and timely buy and sell signals. Its unique transformation process converts data into a Gaussian Probability Distribution, making it easier to identify potential turning points and trends in the market.
This indicator also performs exceptionally well in trending markets, enabling traders to ride the trend and maximize profits during sustained price movements.
In sum, here are the main benefits of using the indicator:
Pros
- The Fisher Transform Indicator effectively pinpoints overbought and oversold conditions, allowing traders to anticipate potential reversals and adjust their positions accordingly
- Compared to traditional indicators, the Fisher Transform offers reduced lag, providing traders with more timely and accurate signals for entering and exiting trades
- The Fisher Transform Indicator can be applied to various financial assets and timeframes, making it suitable for traders with different trading preferences
Limitations of the Fisher Transform Indicator
The main flaw of the Fisher Transform indicator is that during choppy or sideways markets, the Fisher Transform Indicator may generate false signals, leading to whipsaw trades and potential losses.
Additionally, Although the Fisher Transform helps identify divergences, there is also a possibility of false divergences, which could mislead traders.
Cons
- While the Fisher Transform is a powerful tool, it is essential to use it in conjunction with other technical indicators or analysis methods for comprehensive market evaluation
- Upon using the Fisher Transform indicator, traders need to be cautious with parameter settings, as altering the period or other settings may result in varying signals and outcomes
What is the Difference Between the Fisher Transform Indicator and MACD?
The Fisher Transform indicator and the Moving Average Convergence Divergence (MACD) are popular trading indicators with distinct features. Fisher Transform transforms data into a Gaussian Probability Distribution, identifying trends and overbought/oversold conditions. Meanwhile, MACD uses moving averages to gauge trend direction and momentum.
Key Takeaways
- The Fisher Transform Indicator is a powerful tool used in trading to identify potential buy and sell signals.
- To use the Fisher Transform indicator, traders look for a crossover between the indicator’s lines.
- The indicator is especially effective in identifying overbought and oversold conditions, helping traders anticipate potential reversals.
- Traders should be cautious with parameter settings and use the Fisher Transform in conjunction with other indicators like RSI and Fibonacci levels for more comprehensive market analysis.
Frequently Asked Questions About the Fisher Transform Indicator
The following are some of the most frequently asked questions about the Fisher Transform Indicator.
What are the best settings for the Fisher Transform indicator?
The Fisher Transform indicator typically uses a default period of nine, which works well for many traders. However, the best settings can vary depending on the trading strategy and the asset being traded. It’s advisable to experiment with different periods to find the setting that aligns with your specific trading goals and timeframe.
What is the Inverse Fisher Transform?
The Inverse Fisher Transform is a mathematical transformation that reverses the Fisher Transform indicator’s output. While the Fisher Transform converts data into a Gaussian Probability Distribution, the Inverse Fisher Transform reverts it to the original data range. This transformation is commonly used to make data more easily interpretable and can be useful for traders looking to analyze the original data’s characteristics.
Risk Disclosure: The information provided in this article is not intended to give financial advice, recommend investments, guarantee profits, or shield you from losses. Our content is only for informational purposes and to help you understand the risks and complexity of these markets by providing objective analysis. Before trading, carefully consider your experience, financial goals, and risk tolerance. Trading involves significant potential for financial loss and isn't suitable for everyone.