The Balance of Power indicator measures an asset’s buying and selling pressure. For traders, it is a trend trading tool that generates strategic trade signals at zero-line crossovers, divergences, and overbought and oversold levels.
- The Balance of Power is a technical analysis indicator that measures buying and selling pressure on an asset.
- The primary use of this indicator is price trend identification.
- You can use it to utilize various trading strategies, such as zero-line crossovers, overbought and oversold levels, and divergences.
- The raw BOP indicator can be confusing and hard to use. But when the indicator is weighted with an SMA, it becomes much easier to use.
Let’s head straight into the fundamentals of the Balance of Power, how to use it, and examples of utilizing the Balance of Power indicator strategy.
- What is the Balance of Power (BOP) Indicator?
- How Does the Balance of Power Indicator Work?
- How to Set Up the BOP Indicator on MetaTrader and TradingView
- How to Use the Balance of Power Indicator in Trading
- Balance of Power Indicator Trading Strategy Tutorial
- Balance of Power (BOP) Indicator – Pros and Cons
- Key Takeaways
- Frequently Asked Questions
What is the Balance of Power (BOP) Indicator?
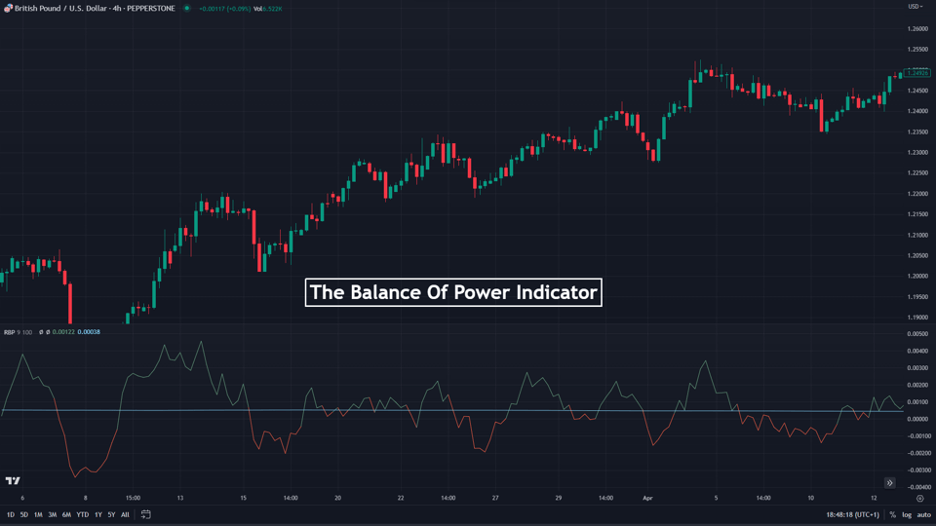
The Balance of Power indicator, or Balance of Market Power, measures buying and selling pressure on an asset. It’s like a scale that constantly measures the strength of the bulls versus the strength of the bears. Traders can use it to trade zero-line crossovers and divergences. Occasionally, they also scout for overbought and oversold signals with the indicator.
The concept behind this indicator is simple. If the buying pressure of an asset outweighs the bearish pressure, then the price is likely to go up. And if the selling pressure outweighs the buying pressure, we’ll likely see lower prices.
It’s the powerful law of demand and supply at work.
How Does the Balance of Power (BOP) Indicator Work?
Most traders only care about how to trade the BOP indicator (or any other indicator), which is understandable, though we believe it’s good practice to know how your tools work. This way, you have more control over your trading system and how to use those tools.
The power indicator balance formula is given by:
(Close – Open) ÷ (High – Low),
Where: Close: The closing price of the current candlestick
Open: The opening price of the current candlestick
High: The highest price of the current candlestick
Low: The lowest price of the current candlestick
With that raw calculation, the indicator looks very choppy and almost impossible to use. But you can temper this choppiness by using a moving average. A Balance of Power indicator weighted by a Moving Average indicator looks less like a two-way spike bar. And we’ll be using this version for the rest of this guide.

As you open the indicator, it appears as a sub-chart beneath your main chart. And from there, its zero center line generates buying and selling signals without interfering with your main chart.
The BOP indicator works similarly to many other momentum indicators. You’ll notice the BOP oscillates around a zero line. When it rises above the line, and you see a rising BOP line, the bulls are considered more robust than the bears at that moment. And when it falls below the zero line, and you notice a falling BOP line, the bears have the upper hand.
How to Set Up the BOP Indicator on MetaTrader and TradingView
If you’re an MT4 or MT5 trader, the BOP isn’t custom-made with your trading platforms. But you can download and add it manually. That is undoubtedly one of the critical issues with the BOP indicator. It’s typically not available on any trading platform, and if it is, it has many versions, which may be very confusing.
The BOP indicator, however, is available on the TradingView trading platform. To add it, open the chart you want to use it on and select “Indicators” on the upper tab of the chart. On the search box that comes after, search for “Balance of Power.”

As you can see, the first one that pops up is the raw BOP indicator, which is not SMA-weighted. You should try to open it and see if you can squeeze any trading signals out of it; however, this cannot be easy because of its excessive choppiness.
So, instead, we suggest you locate the BOP indicator designed by Rollas. That one looks more controlled, and its signals are something you can work with. If you’re observant, you’ll note that the zero line of the Rollas Balance of Power indicator is not actually on the zero level. This is because the indicator adjusts its “zero-line” dynamically. To turn this off, hover on the ticker of the indicator at the top left corner of the indicator chart. The settings logo will pop up. Click on it.
Then, on the settings menu, disable “Dynamic Baseline ATR.” This should return your zero-line to the zero level.

Take note that leaving it on or off depends on your trading style. For the sake of this guide, though, we’ll leave it on.
How to Use the Balance of Power Indicator in Trading
Now, let’s take a closer look at the different techniques you can use to trade with the Balance of Power indicator:
1. Zero Line Crossovers
One of the various ways to trade the BOP is by trading zero-line crossovers. The rules of engagement for this strategy are simple:
- When the indicator crosses the zero line to the upside, meaning negative values turn to positive values, it is a sign that the bulls are taking over. You can open a long trade here.
- But when the indicator crosses the zero line to the downside, meaning positive values turn negative, the power is in the hands of the bears. Open a sell position here.

As you can see in the chart above, positioning your zero line correctly is critical. It determines whether you get into trade earlier or later. And if you would like to change the positioning of your own zero line, edit the “Dynamic Baseline ATR” figure from its default 100 until you have something that suits you.
2. Divergences
Many oscillating technical indicators have a superpower that non-oscillating indicators don’t have. This superpower is called divergence trading.
Typically, a technical analysis indicator moves in tandem with the price action. However, a divergence occurs when their directions differ. Here’s a step-by-step process of trading a BOP divergence:
- Open the indicator and the chart
- Buy when:
- The price makes a lower low while the BOP makes a higher low. This is a bullish divergence.
- The price makes a higher low, and the BOP makes a lower low.
- Sell when:
- The price makes a higher high while the BOP makes a lower high. This is considered a bearish divergence.
- The price makes a lower high, and the BOP makes a higher high. This is also regarded as a bearish divergence.
In the chart below, you can see an example of the BOP divergence trading strategy.

3. Overbought and Oversold Zones
Another way to use the Balance of Power indicator is to scout situations where the indicator strays too far away from the zero line. When it does this, a reversal may be impending.
Naturally, the BOP doesn’t have lines to denote the overbought and oversold levels, so you have to draw them manually. To do this, aim your crosshair at any point on the 0.002 level in the indicator window. Enter “Alt + H” Repeat the process to drop another horizontal level on the -0.002 level.
We’ve chosen the 0.002 and -0.002 levels because they offer some of the best accuracies without sacrificing too many opportunities.
So, to trade it:
- Place your horizontal lines at the 0.002 and -0.002 levels.
- Sell when the indicator returns below the 0.002 level after straying above it.
- Buy when the indicator returns above the -0.002 level after straying below it.

4. Trend Identification
Finally, another way to trade with the Balance of Power indicator is to use it to identify trends. And the rules are simple:
- When the bulls are in power (the indicator is above the zero-line), scout for buying opportunities and ignore any selling opportunities.
- When the bears are in power (the indicator is below the zero-line), scout for selling opportunities and ignore any selling opportunities.
To get the best out of this trading strategy, you can combine the indicator with other indicators and chart patterns to generate signals. You can also combine it with other price action trading strategies to generate signals. You can also trade support and resistance with it, as shown in the chart below.

Bear in mind that you can also tweak the indicator’s setting to be more resilient to short-term price swings. Open the indicator’s settings and increase the “Lookback” figure to anything upwards of 20. The specific figure then depends on your trading strategy. But for this guide, we’re using a Lookback figure of 50.
Balance of Power Indicator Trading Strategy Tutorial
Although there are numerous ways to trade the BOP, as we already pointed out, we’ll be using the zero-line crossover strategy to show you in steps how to use the indicator.
Step 1: Add the Indicator
The first thing you need to do is to add the indicator, which might be a bit tricky when it comes to the BOP indicator. This is because the indicator is not available by default in some trading platforms. Still, you can use it in MT4/MT4 or in TradingView.
To add to TradingView, you must choose the indicator from the Indicators tab. Make sure to choose the Balance of Power indicator that Rollas developed. And if you use MT4 or MT5, you must download and add the indicator manually.
Step 2: Find Buy and Sell Signals and Enter a Trade
Now, you can search for zero crossover trading signals. Using the zero-line crossover strategy, you can consider entering a trade every time the indicator crosses the zero line. For instance, in the GBPUSD 4-hour chart above, open a buy trade when the indicator crosses the zero line to the upside. Conversely, you can open a sell trade when the indicator crosses the zero line to the downside.

Remember that the BOP indicator, like any technical indicator, can generate false signals. This means that you must combine it with other indicators to confirm the signals and increase the chances of success. It is also important to backtest your trading strategy on a demo account before moving to live trading.
Step 3: Place a Stop Loss and Take Profit Target
Creating trade exit plans is just as important as setting your trade entry plans.
One of the ways to set take-profit targets using the BOP indicator is to exit using the zero-line crossover. So, if you were previously in a buy position, exit when the indicator crosses the zero line to the downside. If you were previously in a sell position, exit when the indicator crosses the zero-line to the upside.
Beyond this, however, you are free to use other trade management techniques that you see fit to use. Such tools include Fibonacci support and retracement levels, RSI, moving averages, and MACD.
Balance of Power (BOP) Indicator – Pros and Cons
Here are some advantages and disadvantages of having the Balance of Power indicator in your trading arsenal.
Benefits of the Balance of Power Indicator
If you intend to use the Balance of Power indicator, here are some benefits you can gain from it.
Pros
- Because it is an oscillator, it can be used to trade divergences and overbought and oversold strategies
- You can identify trends and trade signal line crossovers with it
- The SMA-weighted BOP is easy to use
- It is a sub-chart indicator, so it doesn’t interfere with your main chart while you use it
Limitations of the VWMA Indicator
The BOP indicator also has some limitations that traders should be aware of before they use it.
Cons
- The Balance of Power indicator is not custom-built on many trading platforms
- The BOP isn’t at its best when the market is in a consolidation or a range
- It may get you in or out of trends too late, generating false signals
Key Takeaways
- The Balance of Power indicator shows the strength of bullish and bearish moves on an asset by measuring the buying and selling pressures.
- Some BOP trading strategies include zero-line crossover, divergences, and overbought and oversold levels.
- This indicator should be used in confluence with other indicators, such as support and resistance levels and MACD.
- The raw BOP indicator can be hard to use, so most traders use the SMA-weighted BOP.
Frequently Asked Questions About the Balance of Power Indicator
Here are answers to some questions traders ask about the balance of power indicator.
Can I add the Balance of Power indicator in MT4?
The Balance of Power indicator is not built into the MT4. However, you can download and add it as a custom indicator.
How accurate is the Balance of Power indicator?
While trading the Balance of Power indicator crossover strategy in isolation, the accuracy is just average. But this is not surprising, as most indicators are like this. What matters most is how you include it in your trading system.
You could increase the accuracy by combining the indicator with other indicators and various chart patterns to confirm your trades. You could also tweak the indicator settings until you find something that works well in your trading system in various financial market conditions.
What other indicators can be combined with the Balance of Power indicator?
The RSI, MACD, and Moving averages are some of the indicators you can use in combination with the Balance of Power indicator. You can also use any other indicator like the Schaff Trend Cycle indicator or the TRIX indicator that helps the indicator fit better into your trading system.
Risk Disclosure: The information provided in this article is not intended to give financial advice, recommend investments, guarantee profits, or shield you from losses. Our content is only for informational purposes and to help you understand the risks and complexity of these markets by providing objective analysis. Before trading, carefully consider your experience, financial goals, and risk tolerance. Trading involves significant potential for financial loss and isn't suitable for everyone.