The QQE indicator measures market conditions, helping retail traders identify overbought and oversold levels, and it can be used to detect price trends and pinpoint entry and exit signals with precision.
- The QQE indicator’s origins can be traced back to the RSI, a prominent momentum oscillator utilized by traders worldwide. While the RSI is an excellent tool, the QQE indicator takes it a step further by providing traders with increased forecasting skills for currency pairs.
- The QQE indicator is particularly good at detecting oversold and overbought conditions, allowing traders to forecast probable reversals. Traders can check the strength and progression of a trend by examining the QQE FAST and QQE SLOW lines, thereby improving their trend-following techniques.
- The market trend can be determined by examining the QQE line with respect to the 50 level. A trend above 50 implies an uptrend, whereas a trend below 50 indicates a downtrend.
In this guide, we will cover everything you need to know about the QQE indicator, including how to use the indicator and implement the QQE trading strategy.
- What is the Quantitative Qualitative Estimation (QQE) Indicator?
- What are the Components of the QQE Indicator?
- How to Use the Quantitative Qualitative Estimation (QQE) Indicator in Trading
- QQE Indicator Trading Strategy Tutorial
- What are the Benefits and Limitations of the QQE Indicator?
- What is the Difference Between the QQE and RSI?
- Is the Quantitative Qualitative Estimation Better than Stochastic?
- How Accurate is the QQE Indicator?
- Key Takeaways
What is the Quantitative Qualitative Estimation (QQE) Indicator
The QQE indicator, short for Quantitative Qualitative Estimation, is a technical analysis tool designed to identify overbought and oversold levels of price action in the market. Developed as a more advanced iteration of the Relative Strength Index (RSI), the QQE indicator offers traders a unique perspective on price movements and helps them make critical trading decisions.
The roots of the QQE indicator can be traced back to the RSI, a popular momentum oscillator used by traders worldwide. While the RSI is undoubtedly a valuable tool, the QQE indicator takes things a step further.
It offers traders enhanced capabilities for forecasting the price directions of currency pairs. Although not as well-known as its predecessor, the QQE indicator’s advanced features make it a valuable addition to any trader’s toolkit, especially when used in conjunction with the RSI indicator.
What are the Components of the QQE Indicator?
The QQE indicator consists of two primary components that work in tandem to provide valuable insights into market conditions:
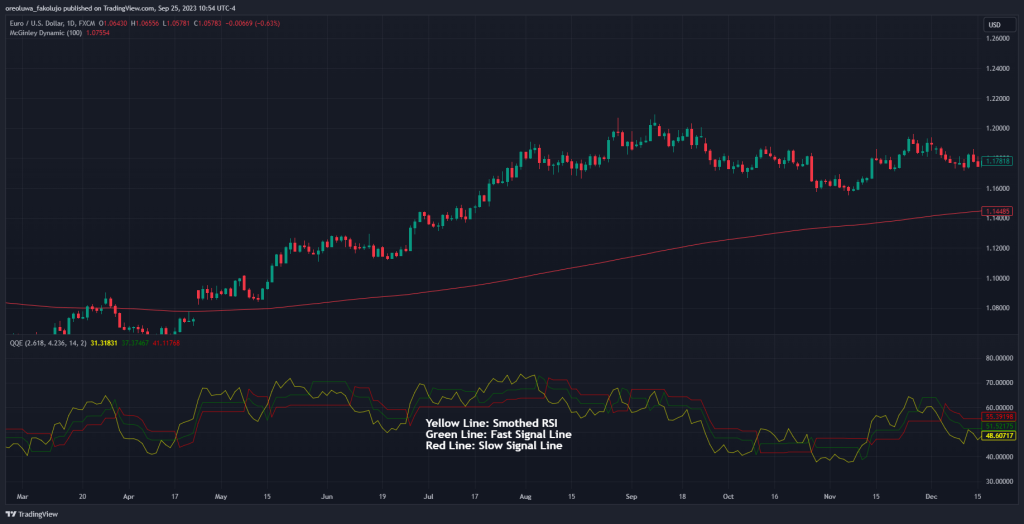
1. Smoothed RSI Line (Yellow Line)
At the heart of the QQE indicator is the Smoothed Relative Strength Index line. This line represents the Relative Strength Index, which measures the magnitude of recent price changes. By smoothing out the RSI, the QQE indicator reduces noise and provides a clearer picture of market trends.
2. Trailing Lines (Red and Green Lines)
They are two lines. One is the slow trailing line (red line), and the other is the fast trailing line (green line). Running alongside the RSI line are the trailing lines. These lines complement the RSI and generate various trading signals based on their interactions with the smoothed RSI.
Generally, the good thing about the QQE indicator is that there are many ways to use it (we discuss the different ways in the section below). Yet, when trading the QQE indicator, traders are typically looking for a crossover between the QQE smoothed line and QQE fast and slow lines. This crossover provides a signal to buy or sell an asset.
How to Use the Quantitative Qualitative Estimation (QQE) Indicator in Trading
The QQE values range from 0 to 100, with both the RSI line and the trailing lines oscillating within this range. These oscillations create multiple indications that traders can leverage to interpret market trends and generate trading signals. Some of the key ways of using the QQE indicator include:
1. Bullish and Bearish Divergence Signals
The QQE indicator is adept at spotting bearish or bullish divergence between price movement and its three component lines. Divergence signals can serve as early warnings of potential trend changes, giving traders an advantage in the market.
The indicator is not the best at spotting hidden divergences, though. But for the regular bullish divergence or the regular bearish divergence, you’re good to go.
2. Trend Confirmation
By analyzing the relationship between the smoothed RSI line and the trailing line, traders can confirm the strength and direction of a trend. If the QQE line is above 50, it suggests an uptrend, whereas a QQE line below 50 indicates a downtrend. This confirmation ability of the QQE can be instrumental in taking trend continuation trades.
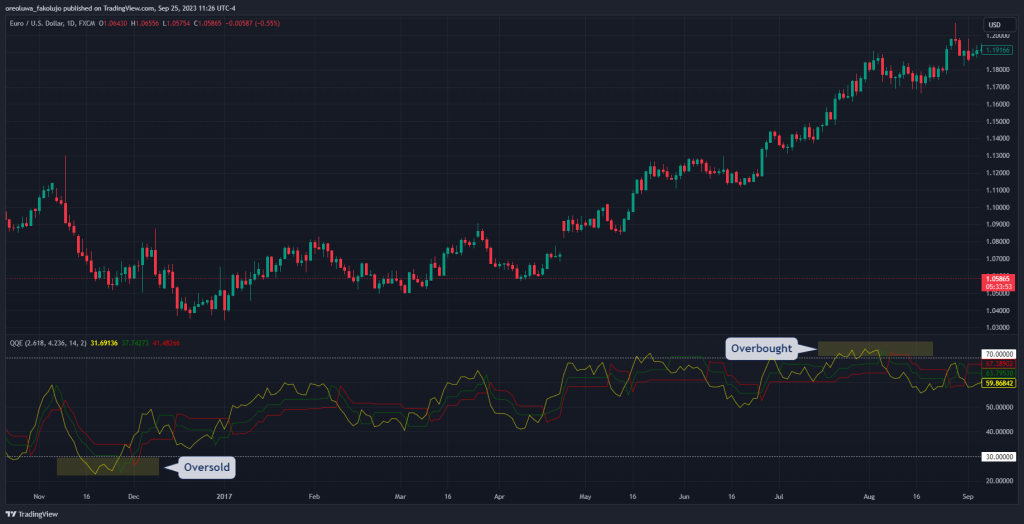
3. Overbought and Oversold Levels
The Qualitative Quantitative Estimation indicator also excels at identifying overbought and oversold market conditions, with 70 being the overbought level and 30 being the oversold level. Traders can use this information to determine when to enter or exit trades, helping them avoid potential reversals or utilize the counter-trend trading strategy.
4. Trend Trading
In addition to trend identification, the QQE indicator is also a valuable tool for identifying a trend or a trend reversal in the forex markets. This is done by closely monitoring the QQE FAST (maroon line) and QQE SLOW (blue line).
When the QQE FAST line crosses above the QQE SLOW line and is below the 50 level, it can be a buy signal. This indicates a potential upward movement in the market. Alternatively, some traders opt to buy simply when the QQE lines cross above the 50 level.
Conversely, when the QQE FAST line crosses below the QQE SLOW line and is above the 50 level, it can serve as a sell signal. This suggests a potential downward movement. Again, traders may choose to sell when the QQE lines cross below the 50 level.
5. Identifying Ranging/Consolidating Markets
Not every market is trending strongly, and sometimes, it can be in a sideways or consolidating phase. To recognize this, traders often set a middle range between 40 and 60 on the QQE indicator.
If the absolute value of the QQE line remains within this range, it indicates a lack of a clear trend or a sideways market. When this occurs, traders can utilize the range trading strategy, where they buy the asset at the support level and sell at the resistance level.
Quantitative Qualitative Estimation (QQE) Indicator Trading Strategy
As previously mentioned, there are different ways to use the QQE indicator. But the trading strategy we’ll be introducing to you would involve using the QQE to generate signals while using a moving average-based indicator to confirm our entries.
So, the first thing you want to do is to:
Look for Trade Setups on the QQE
Trade setups on the QQE are very easy to spot. There are two things you want to keep your eyes on; the smoothed RSI (yellow) line and the 50-level of the indicator (displayed on the right panel of the indicator). The RSI line will give you your signal and the 50-level will help you filter out some false signals.
Back to the trade setup. You have a bullish trade setup when these two scenarios happen.
- All three lines of the QQE are beneath the 50-level.
- The Smoothed RSI line (yellow) crosses over the slow trailing lines to the upside.
Usually, when the second scenario happens, that’s your opportunity to buy. Conversely, your bearish trade setups will look like this:
- All three lines must be above the 50-level of the QQE.
- The Smoothed RSI line (yellow) crosses below the QQE’s slow trailing lines.
And with the bearish crossover of the smoothed RSI line, you have your bearish trade entry.
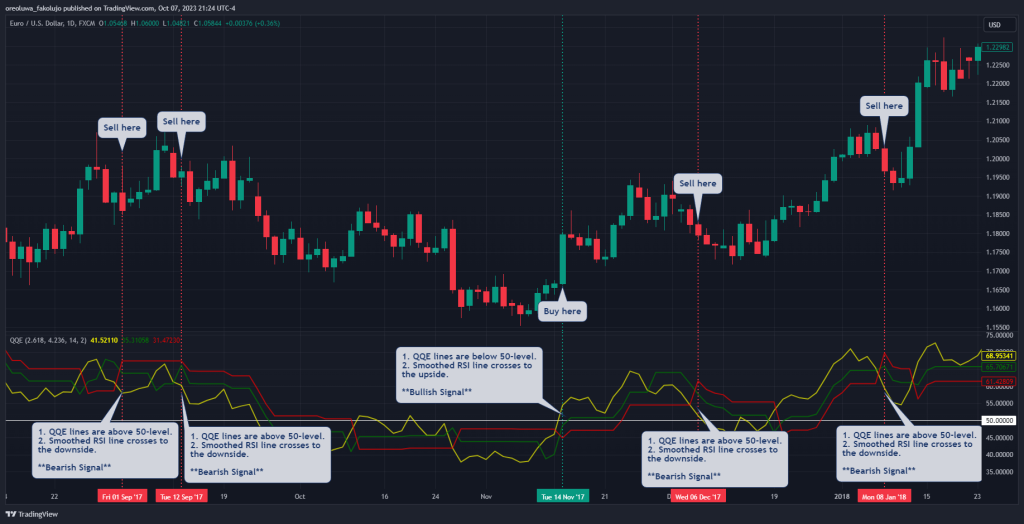
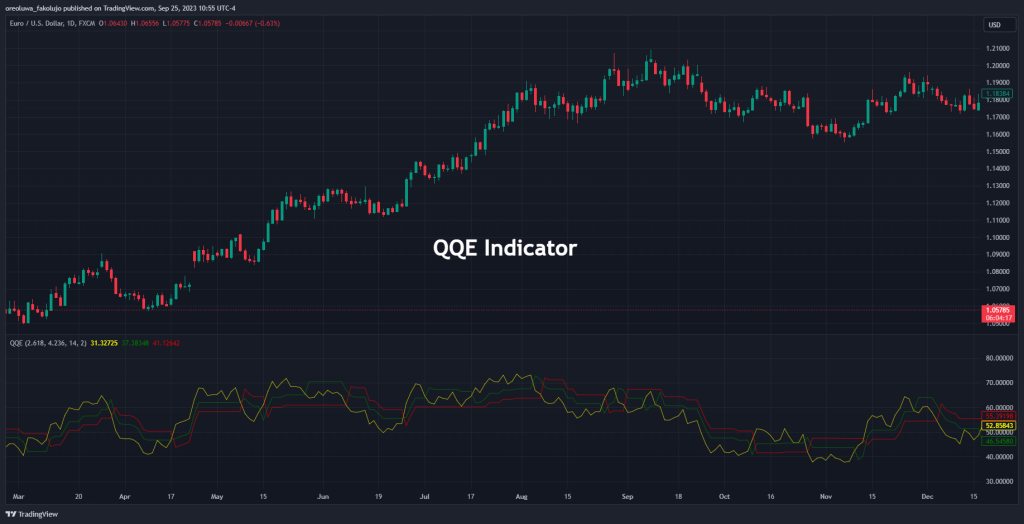
The chart above is a perfect example of what your QQE setups would look like. The 50-level of the indicator is the horizontal white line on the indicator pane. Whenever all three lines are above this level, you’re looking to sell based on the smoothed RSI line. And whenever all the lines are below the 50-level, you want to buy as soon as the smoothed RSI crosses the other two lines to the upside.
Confirming Your Trade Setups
Taking signals based on the QQE alone is not advisable. In fact, there’s hardly an indicator out there that you can or should use in isolation. It’s important to always confirm your trades with other indicators or technical tools. For this simple strategy, we’ll be using the 100-period Exponential Moving Average for our confirmations.
How do you do this?
Simply take only the trades that align with the bias of your EMA and ignore every other trade. If the price is above the EMA, it means the market is bullish. So, you only take the long trades given by the QQE as long as the EMA confirms that the market is bullish.
Conversely, the market is bearish if the price is below the EMA. And in this scenario, you only take short trades according to the trade setup criteria we mentioned up there. Ignore every bullish trade called by the QQE during this time.
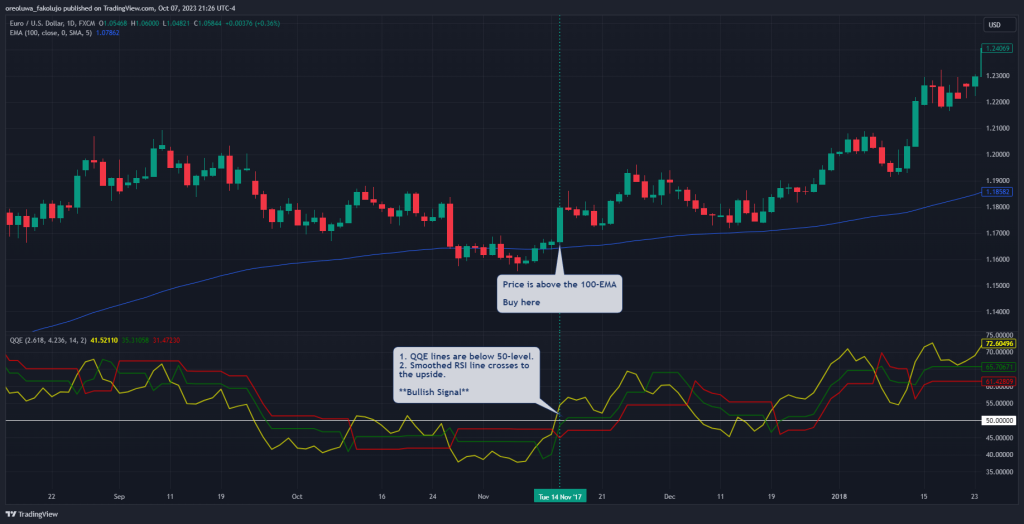
The chart above tells this story perfectly. As you can see, the EMA line (blue), shown on the main chart, is bullish. And that is why we ignored every bearish setup that the QQE called. Instead, we took only a bullish setup. Notice how it drastically reduces our potential losses with those bearish entries.
The QQE signals alone tend to be wrong many times. But when you temper the indicator with the knowledge of the general trend, you can filter out the false signals that don’t align with the trend. Doing this will reduce your false signals by more than half.
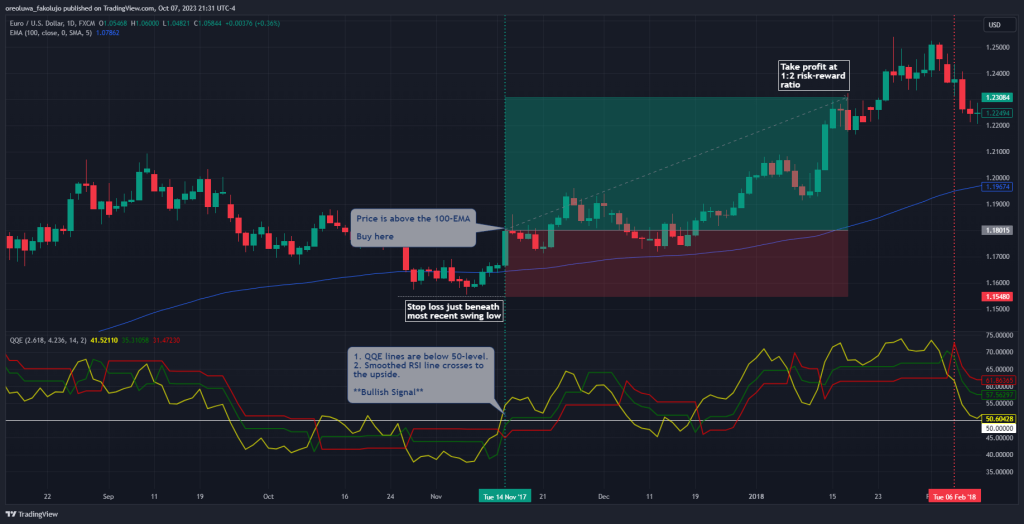
Stop Loss and Target Profit
Set your stop loss just below the most recent swing low when taking a BUY position and above the most recent swing high in a sell position. This way, you’re giving the price a lot of breathing room to make slight retracements before heading in your direction. And if the price hits your stop loss, it suggests that the trend is about to change.
As for profit target, after much research on this trading strategy, we found out the best spot for the target profit is two times the risk level (1:2 risk-to-reward ratio).
What are the Benefits and Limitations of the QQE Indicator?
Here’s a quick overview of the benefits and limitations of using the QQE indicator.
Benefits of Using the QQE Indicator
The QQE indicator excels at pinpointing overbought and oversold market conditions, enabling traders to anticipate potential reversals.
By analyzing the QQE FAST and QQE SLOW lines, traders can confirm the strength and direction of a trend, enhancing their trend-following strategies. QQE can detect divergences between the price movement and its component lines, providing early indications of potential trend changes.
Pros
- Overbought and oversold identification
- Trend confirmation
- It’s an improved version of the RSI
Limitations of the QQE Indicator
QQE, being an RSI-based indicator, is susceptible to generating false signals, especially during divergences. Traders must exercise caution and consider additional confirmation methods. While QQE is a valuable tool, it should be used in conjunction with other technical indicators and fundamental analysis for a comprehensive trading strategy.
Cons
- It’s prone to false signals
- Should not be used as a standalone indicator
- May be too complex for beginners
What is the Difference Between the QQE and RSI?
The key difference between the Qualitative Quantitative Estimation (QQE) and the Relative Strength Index (RSI) lies in their complexity and capabilities. While both are momentum oscillators used to identify overbought and oversold conditions, the QQE is considered a more advanced form of the traditional RSI itself. The QQE incorporates a smoothed RSI line along with fast and slow trailing levels, providing traders with additional signals and insights. Essentially, the QQE builds upon the foundation of the RSI to offer a broader range of technical analysis tools.
Is the Quantitative Qualitative Estimation Better than Stochastic?
Whether the QQE indicator is better than the Stochastic oscillator depends on a trader’s preferences and trading strategy. Both indicators serve similar purposes in identifying any oversold or overbought condition, but they use different calculations and parameters. The choice between QQE and Stochastic often comes down to personal preference and how well the indicator aligns with a trader’s trading style. Some forex traders may find the QQE more suitable due to its added complexity and signals, while others may prefer the simplicity of the Stochastic oscillator.
How Accurate is the QQE Indicator?
The accuracy of the QQE indicator, like any technical analysis tool, is subject to market conditions, the chosen parameters, and the trader’s skill in interpreting its signals. While the QQE indicator can provide valuable insights into trends and potential entry and exit points, it is not infallible. Traders should exercise caution and consider using additional confirmation methods alongside QQE signals to enhance accuracy. It’s also important to be aware that the QQE indicator, being based on RSI, can generate false signals, particularly during divergences. Therefore, thorough analysis and risk management are crucial when utilizing the QQE indicator in trading.
Key Takeaways
- The QQE indicator consists of a smoothed RSI indicator along with fast and slow trailing levels. Understanding these components is crucial for effective usage.
- You can determine the market trend by observing the QQE line in relation to the 50 level. Above 50 indicates an ascending trend, while below 50 suggests a descending trend.
- QQE offers valuable signals for entry and exit points. Buying when QQE FAST crosses above QQE SLOW below the 50 level and selling when QQE FAST crosses below QQE SLOW above 50 level are common strategies.
- Traders should be aware of the potential for false signals, especially during divergences, when using the QQE indicator. It’s advisable to use additional confirmation methods alongside QQE signals.
Risk Disclosure: The information provided in this article is not intended to give financial advice, recommend investments, guarantee profits, or shield you from losses. Our content is only for informational purposes and to help you understand the risks and complexity of these markets by providing objective analysis. Before trading, carefully consider your experience, financial goals, and risk tolerance. Trading involves significant potential for financial loss and isn't suitable for everyone.