Triple Candlestick Patterns in Forex
Having touched on double candlestick patterns in the last lesson, let’s take things up a notch by looking at triple candlestick patterns and determining how to use them for profitable trading. As the name suggests, triple candlestick patterns comprise three candlesticks next to one another on a chart.
These patterns are often used to predict the future behavior of prices of currency pairs. Using these trading patterns, traders first analyze the market dynamics regarding buyers’ and sellers’ pressure. Then, using predictions from their candlestick analysis, they determine when to enter or exit a trade.
This piece covers three popular triple candlestick patterns traders can find on forex trading charts. They are:
- The morning and evening stars
- The three white soldiers and three black crows
- The three inside-up and three inside-down candlestick patterns.
Like double candlestick patterns, triple candlestick patterns are either bearish or bullish.
Without further ado, let us get into them.
1. Evening and Morning Stars candlestick patterns
The Morning Star and the Evening Star are triple candlestick patterns that usually occur when a particular trend ends. They are both reversal patterns because they show the end of one trend and the start of a new trend.
Let’s explore each one in more detail below.
What is the Evening Star Candlestick Pattern?
The Evening Star pattern is a three-candle, bearish reversal candlestick formation that appears at the top of an uptrend. It signals the slowing down of an upward momentum before a bearish candle sets the pace for a new downtrend. The pattern consists of three candles – the first bullish candlestick followed by a second bearish candle and the last candlestick with a closing price below the lowest level of the first candle.
Characteristics of an Evening Star Pattern
The Evening Star pattern occurs when the market reverses from an uptrend to a downtrend, as shown in the example below. The following are the features of the evening star pattern:
- The first candlestick is bullish, indicating part of a recent uptrend.
- The body of the second candlestick is tiny (looks like a Doji candlestick), showing investors’ indecision in the market.
- The third candlestick confirms a trend reversal of the previous trend as it closes way below the first candlestick.
Chart Formation
The following image shows the evening star candlestick pattern.

Chart Formation on Forex Chart
The next image shows an evening star candlestick pattern on a forex chart.

What is the Morning Star Candlestick Pattern?
The Morning Star candlestick pattern is a bullish pattern on a trading chart that signals the exhaustion of a downward trend. It occurs at the end of the downtrend, signifying a loss of the bears’ dominance and a potential turning point into a rising market.
Characteristics of a Morning Star pattern?
The morning star pattern occurs when the downward trend is reversed to an upward trend. The following are the necessary features of a morning star candlestick pattern:
- The first candle is red and bearish, forming a part of the prevailing downward trend.
- The second candlestick after the first bearish candle is small, showing the indecisive push and pull between buyers and sellers.
- The third candle confirms the eventual dominance of the buyers, and prices move upward.
Chart Formation
Below is an image of the morning star candlestick pattern
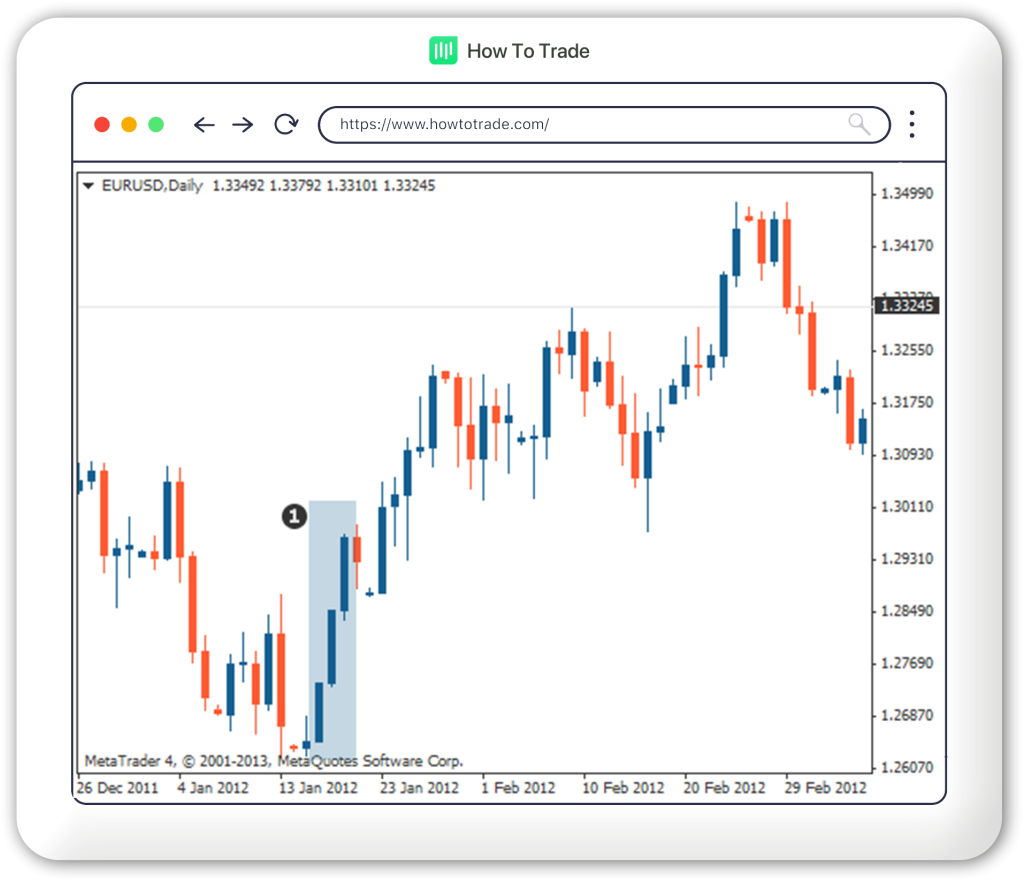
Chart Formation on Forex Chart
The image below also depicts the morning start candlestick pattern in a forex market.

You may also come across other terms, such as the morning star doji and evening star doji candlestick patterns. These are very similar to the ones we already discussed, except that the middle candlestick is a doji. A doji is a very short body candlestick with equal wick lengths on both ends, which signifies a more concise indecision between the bears and the bulls.
2. Three White Soldiers and Black Crows Candlestick Patterns
The three white soldiers and black crows are another category of three-candlestick patterns. But rather than strictly signaling a reversal as with other patterns we’ve discussed, the white soldiers and black crows can also confirm an existing trend.
Let’s explore each of them below.
What is the Three White Soldiers Candlestick Pattern?
Three white soldiers is a bullish technical analysis candlestick formation that traders use to determine the reversal of a prevailing downtrend in a pricing chart. The pattern consists of three consecutive long-bodied bullish candles that open within the previous candle’s real body and close beyond the previous candle’s high.
Characteristics of a Three White Soldiers pattern
The three-soldier pattern mostly occurs at the end of a downtrend and indicates a shift in the balance between sellers and buyers. The following are the features of the three white soldiers pattern:
- After a downtrend or a bearish candle, three consecutive bullish candlesticks exist.
- The bodies of the second and the third candlesticks should be approximately the same size and bigger than the first candlestick. If the third bullish candlestick is visibly smaller than the preceding two candles, the buyers are not entirely in control and may indicate weakness among the buyers.
- The three bullish candles have small or no upper wicks.
Chart Formation
The image below shows a three white soldiers candlestick pattern.

Chart Formation on Forex Chart
The following image shows the same pattern on a Forex chart.
What is the Black Crows Candlestick Pattern?
The Three Black Crows pattern is a bearish trend reversal or confirmation pattern that traders use to predict the reversal of a prevailing bullish trend or to confirm the continuation of a trend in a pricing chart. It consists of three bearish candles and indicates bullish weakness in an established uptrend, signifying the possible emergence of a new downtrend.
Characteristics of a Three Black Crows pattern
The three crows pattern, also referred to as the “three black crows,” is a reversal pattern that occurs at the end of an uptrend or after a bullish candle. The following are the features of the three black crow pattern:
- It consists of three consecutive bearish candlesticks, one after the other
- The bodies of the second and the third candlesticks should be approximately the same size. If the third candle is visibly smaller than the preceding two candles, this means that the sellers are losing dominance and may eventually lead to bearish apathy.
- The three candles have small or no lower wicks.
Chart Formation
The image below indicates a three-black crow candlestick pattern.
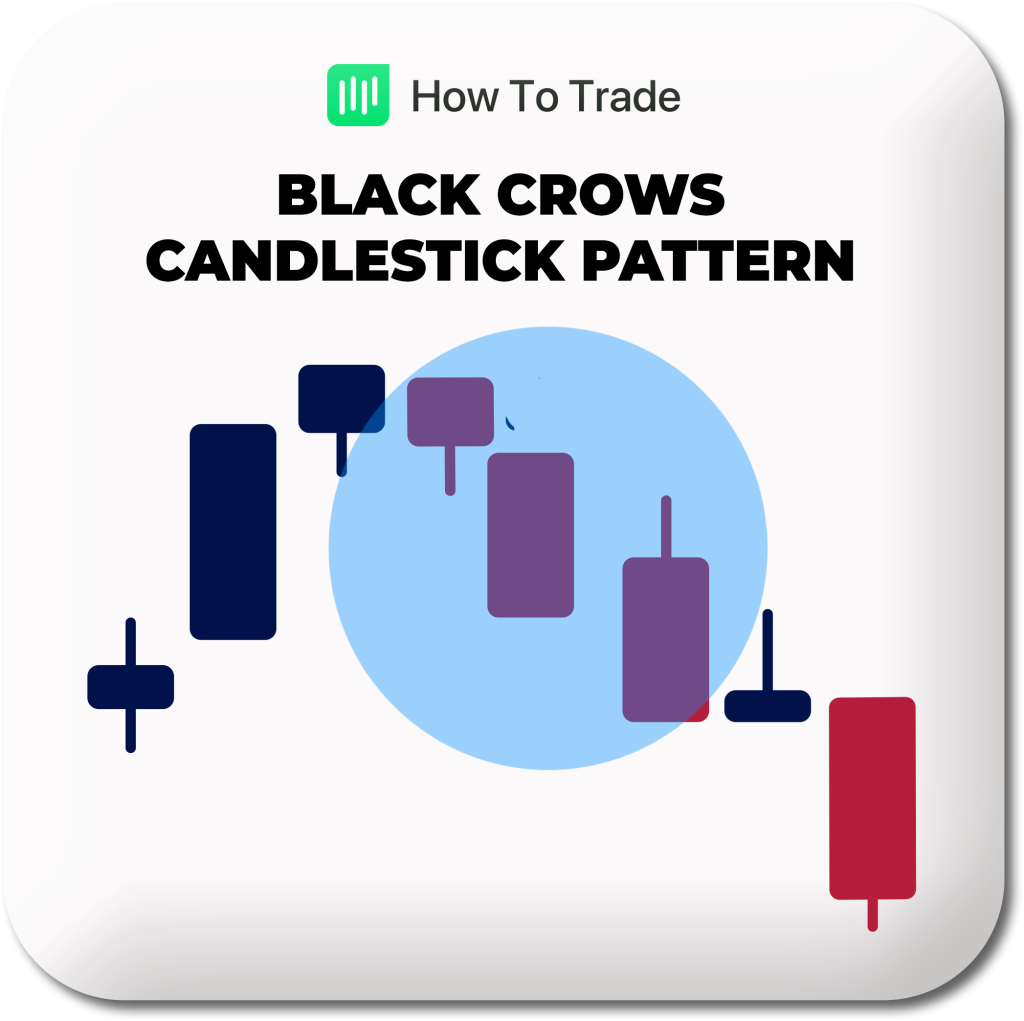
Chart Formation on Forex Chart
The following image shows the pattern on a Forex chart.

3. Three Inside Up and Down
The final pair we will discuss in this piece are the three inside up and down candlestick patterns. These patterns signal the reversal of the current trend and are quite similar in structure to the three-bar play chart pattern. The three inside-up and three inside-down patterns feature a candlestick immediately followed by two candlesticks of opposite trends. Now let us discuss each in detail.
What is the Three Inside Up Candlestick Pattern?
The three inside up pattern is a bullish reversal candlestick pattern that occurs at the end of a bearish trend, signaling a potential reversal and the start of a new trend in the market. It consists of three candles, with the first two forming an inside bar followed by a long bullish candlestick.
Characteristics of a Three Inside Up Pattern
The following are the features of the three inside up candlestick pattern:
- The first candle is long and bearish, indicating that the market is still in an extended downtrend.
- The second candle is bullish and closes at the halfway point of the first candle.
- The third bullish candle closes beyond the first candle’s opening and above the second candle’s high. This formation signals the beginning of a new uptrend.
Chart Formation
The image below depicts the three inside up pattern.
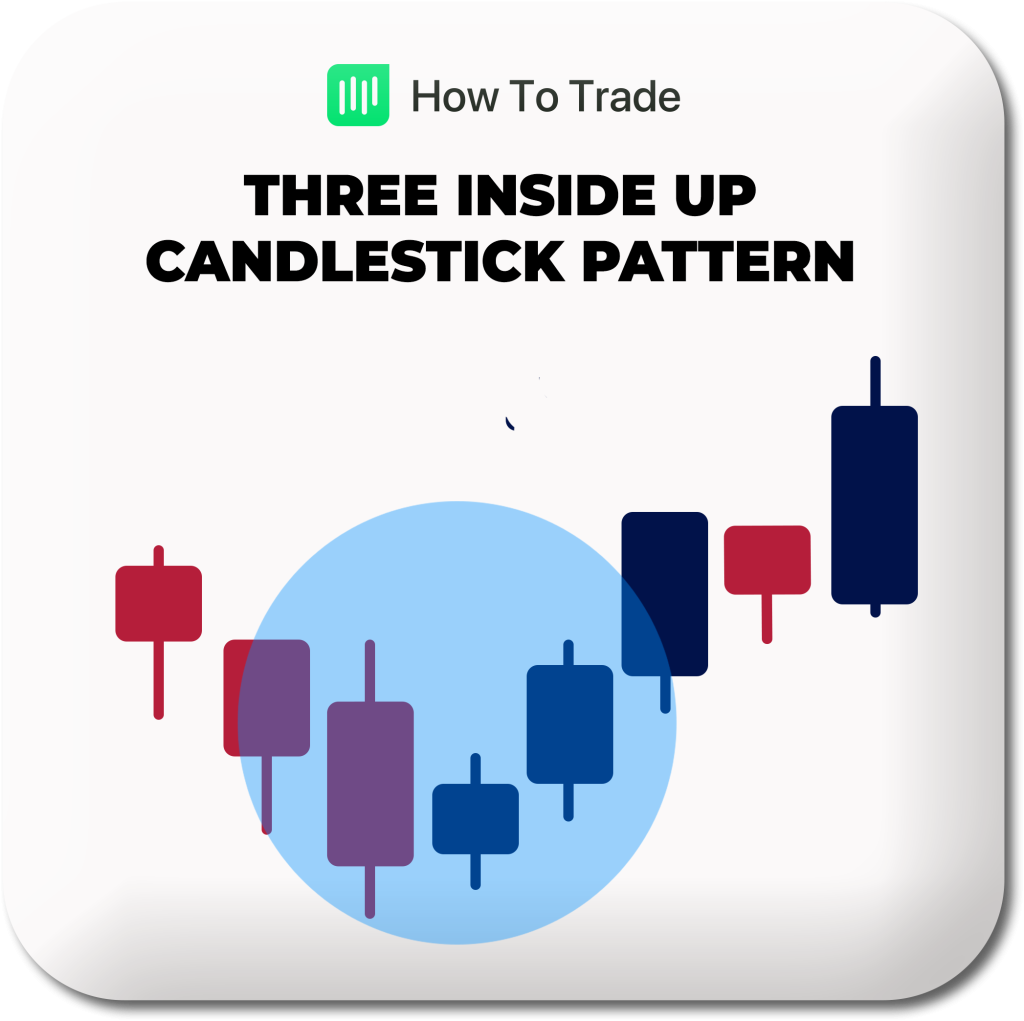
Chart Formation on Forex Chart
The image below also points out the pattern on a Forex chart.

What is the Three Inside Down Candlestick Pattern?
A three inside down is a bearish candlestick reversal pattern that forms at the end of an uptrend and indicates a shift in the direction of the bullish trend. The pattern consists of a bullish candle followed by an inside Doji bar, after which the price of the third candlestick breaks down below the opening of the first candle.
Characteristics of a Three Inside Down pattern
The following occurs in this pattern:
- The first candlestick is long and bullish, indicating that the market is still in an uptrend.
- The second candlestick is bearish and should ideally close at the halfway point of the first candlestick. The second bearish candle usually has a small body and a Doji candlestick shape.
- The third candlestick is also bearish, closing beyond the first candlestick’s opening and below the second candle’s low.
Chart Formation
The image below shows the three inside down candlestick pattern.
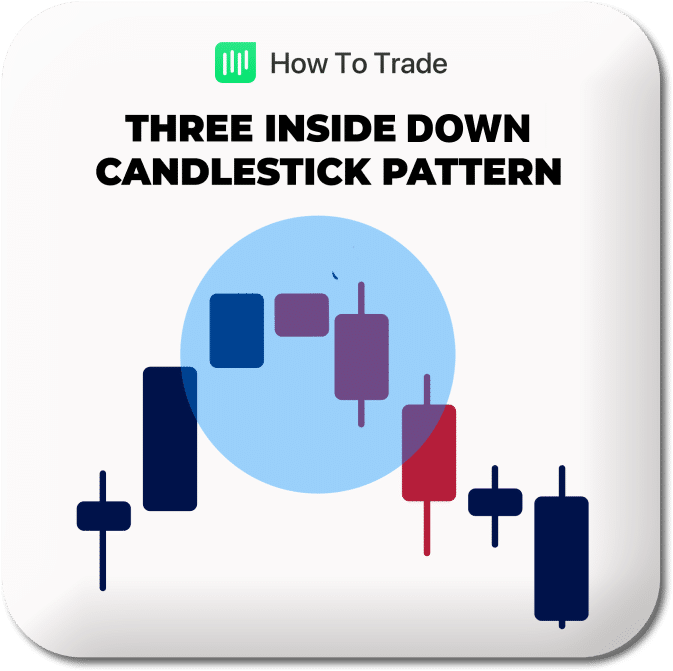
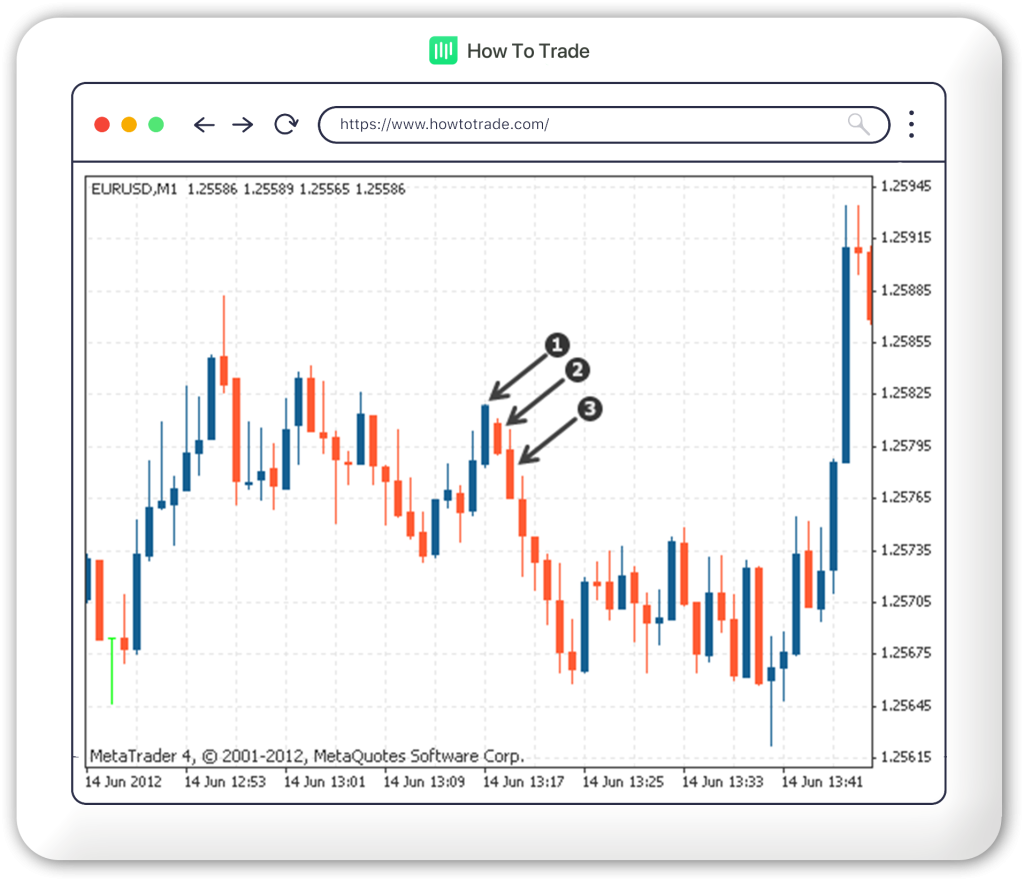
Chart Formation on Forex Chart
The next image shows the pattern on a Forex chart.
And that’s it for the triple candlestick patterns covered in this piece!
Key Takeaways
- The triple candlestick patterns involve the analysis of three consecutive candles to predict future price movement.
- They are either trend reversal patterns or continuation confirmation tools.
- The three major pairs of triple patterns are the morning and evening stars, the three white soldiers and black crows, and the three inside up and down patterns.
- These candlestick patterns either confirm a bullish or bearish trend.
Conclusion
The triple candlestick patterns are great tools for predicting price movement. They shed light on the market dynamics, helping traders make informed decisions. However, avoiding using the candlestick patterns without confirming with other tools is crucial. Indicators that complement the triple candlestick patterns are the Relative Strength Index (RSI), Moving Averages Convergence Divergence (MACD), and support and resistance lines.


Up To $5,000 Credit!
- Trade 1,000’s of global markets.
- 0% deposit and withdrawal fees.
- Rapid funding turn-around times.
- Trade on MetaTrader 4 and 5.