Double Candlestick Patterns in Forex
The previous lesson discussed single candlestick patterns traders use to identify continuous and reversal signals. This piece considers double candlestick patterns that enable traders to predict future price movements. Generally, double candlestick patterns give more details about the market sentiment than single candlestick patterns. Therefore, technical analysis using double candlestick patterns shows a more accurate bias toward market sentiments. Without further ado, let us dive right in.
What are Double Candlestick Patterns?
As the name implies, double candlestick patterns consider two candlesticks simultaneously. Traders use the relationship between the double candlesticks to get a clearer picture of the market sentiments, using criteria such as the body of the candles, the length and direction of their wicks, and sometimes their positions relative to other tools.
The first candle of the double candlestick pattern gives the signal, while the second candle confirms the market sentiment. Similar to the single Japanese candlestick patterns, double candlestick patterns can be bullish or bearish.
Two common double candlestick patterns you’ll often come across on your forex charts are:
- Engulfing Candles (Bullish Engulfing and Bearish Engulfing)
- Tweezer Bottoms and Tops
1. What Are Engulfing Candles?
The engulfing pattern is a strong reversal signal in technical analysis that can be bullish or bearish. It comprises two main candlesticks: a small candle immediately followed by another larger one in the opposite direction.
Let’s see the bullish and bearish version of the engulfing candlestick pattern:
1.1. What is a Bullish Engulfing Candlestick Pattern?
A bullish engulfing candlestick pattern signals a potential price reversal and an upcoming uptrend (bullish trend). This bullish pattern often occurs after there’s been a period of consolidation or downtrend.
Characteristics of a Bullish Engulfing Candle
The bullish engulfing pattern forms when a larger bullish candle follows a smaller body bearish candle. Traders consider this pattern a viable signal of an uptrend because it suggests that the bulls show increased strength after a bearish run. The change of strength from bears to bulls shows a reversal of price momentum that will likely continue.
The pattern’s name comes from the idea that the second candle, which is the bullish candle, “engulfs” the first candle, the bearish, that came before it.
Chart Formation
The image below depicts a bullish engulfing candlestick pattern that reverses a downward trend.
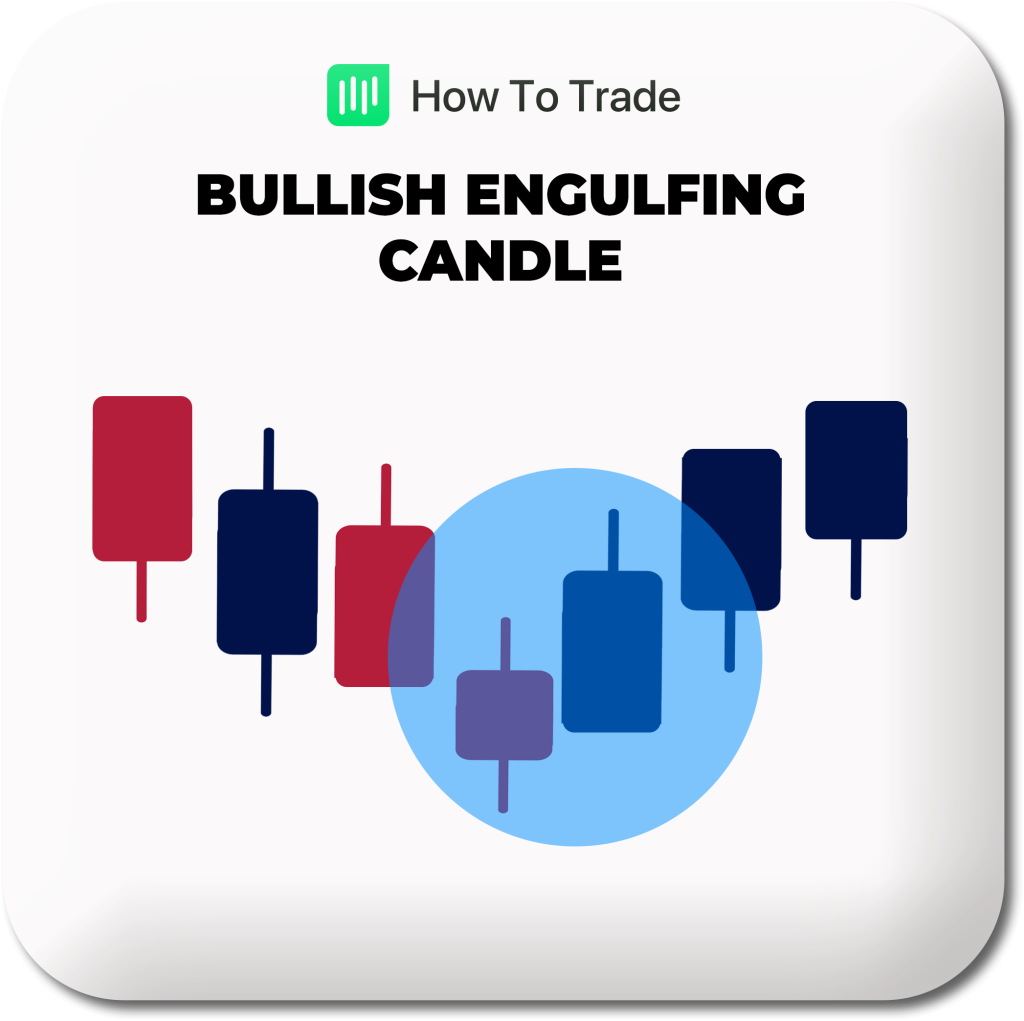
Chart Formation on Forex Chart
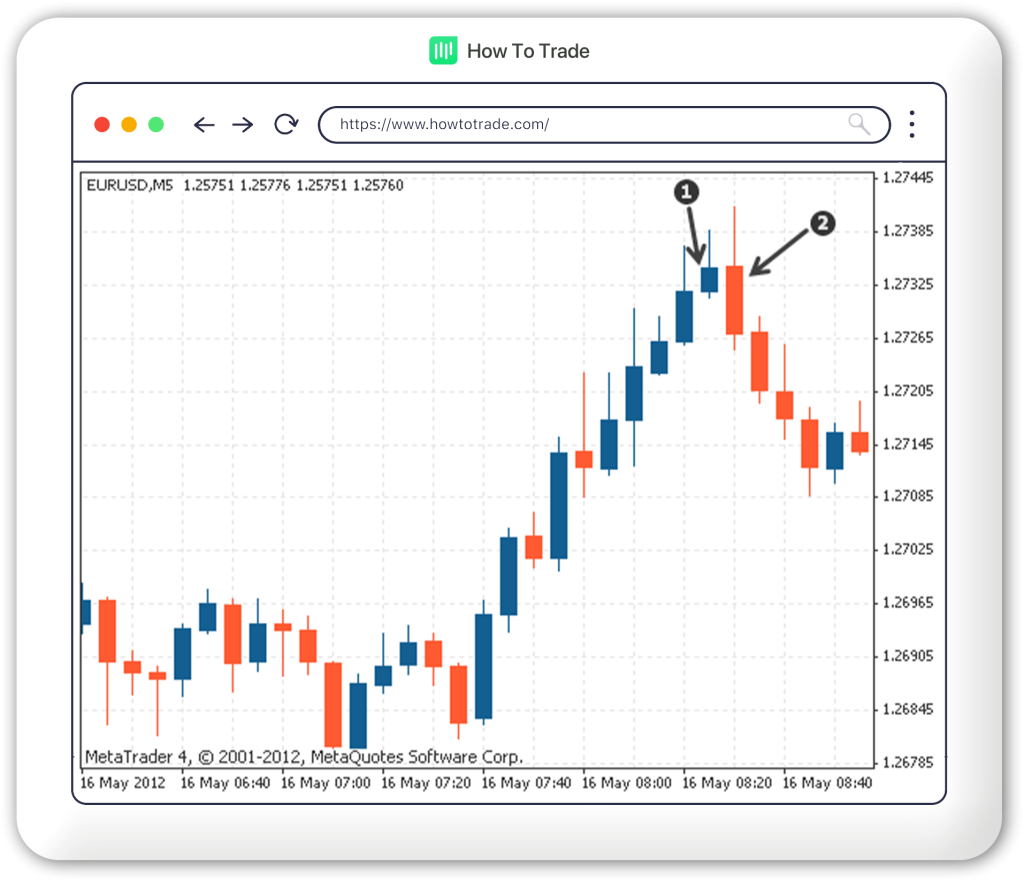
The following image shows the bullish engulfing candlestick pattern on an actual forex chart.

Observe that the second “bullish” candlestick completely engulfs the first “bearish” candlestick. This, in turn, led to an upward reversal of price action.
1.2. What is a Bearish Engulfing Candlestick Pattern?
A bearish engulfing candle is a two candlestick reversal pattern that signals a potential turn from a bullish trend into a downtrend. The pattern occurs after a period of consolidation or an uptrend.
Characteristics of a Bearish Engulfing Candle
The bearish engulfing pattern is similar to the bullish engulfing patterns but signals an upcoming downtrend instead.
Unlike the bullish engulfing pattern, the bearish engulfing pattern has a giant bearish candlestick following a smaller bullish candle. This implies that the bears are getting more potent than the bulls, and the downward momentum may likely continue.
Usually, the bearish engulfing candlestick opens or peaks above the high of the previous smaller bullish candlestick and closes or troughs below the low of the bullish candlestick.
Chart Formation
The image below shows the bearish engulfing candlestick pattern.
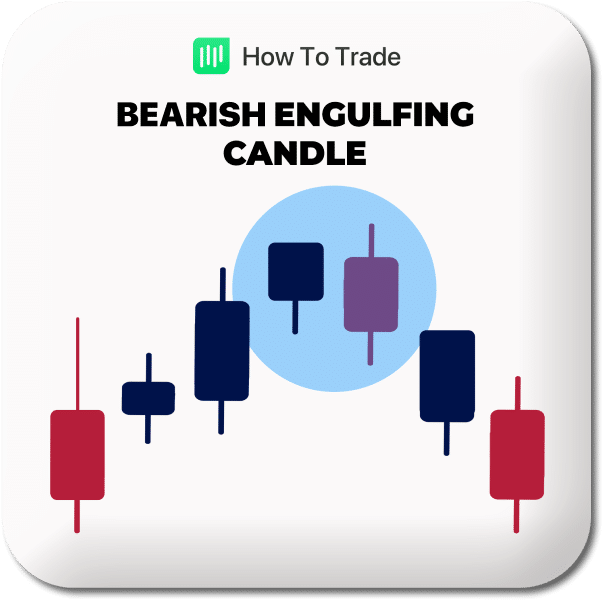
Chart Formation on Forex Chart
The following image shows the bearish engulfing candlestick pattern on a real forex chart.
Notice that the bearish candlestick completely engulfs the bullish candlestick in the image above. This resulted in the reversal of price action from the uptrend to the downtrend.
2. What are Tweezer Patterns?
Tweezer patterns are double candlestick reversal patterns formed by two candles of opposing sentiments with matching highs or lows. In other words, the bodies of the two candlesticks are similar in size, and their wick lengths are also almost equal.
This type of candlestick pattern usually forms after an extended uptrend or downtrend, indicating that a reversal from the previous trend will happen soon.
Two types of Tweezer patterns exist: the Tweezer Bottom and the Tweezer Top.
2.1. What is a Tweezer Bottom Candlestick Pattern?
A Tweezer Bottom candlestick pattern is a bullish reversal pattern that occurs at the bottom of a downtrend. It consists of two candles with very similar lows, with the first candle depicting the existing downtrend while the second candle reflects a bullish market sentiment as price action moves up in the opposite trend.
Characteristics of a Tweezer Bottom Candle
A tweezer bottom follows an extended downtrend and signals a reversal upwards. The first candlestick for a tweezer bottom has a bearish candle with a moderate-length shadow below. The second candlestick is a bullish candlestick with an equal length body and shadow sharing the same low as the first candle.
It indicates that there is strong support on that level, and the price will likely lead to a bullish trend.
Chart Formation
The image below shows the tweezer bottom candlestick pattern.
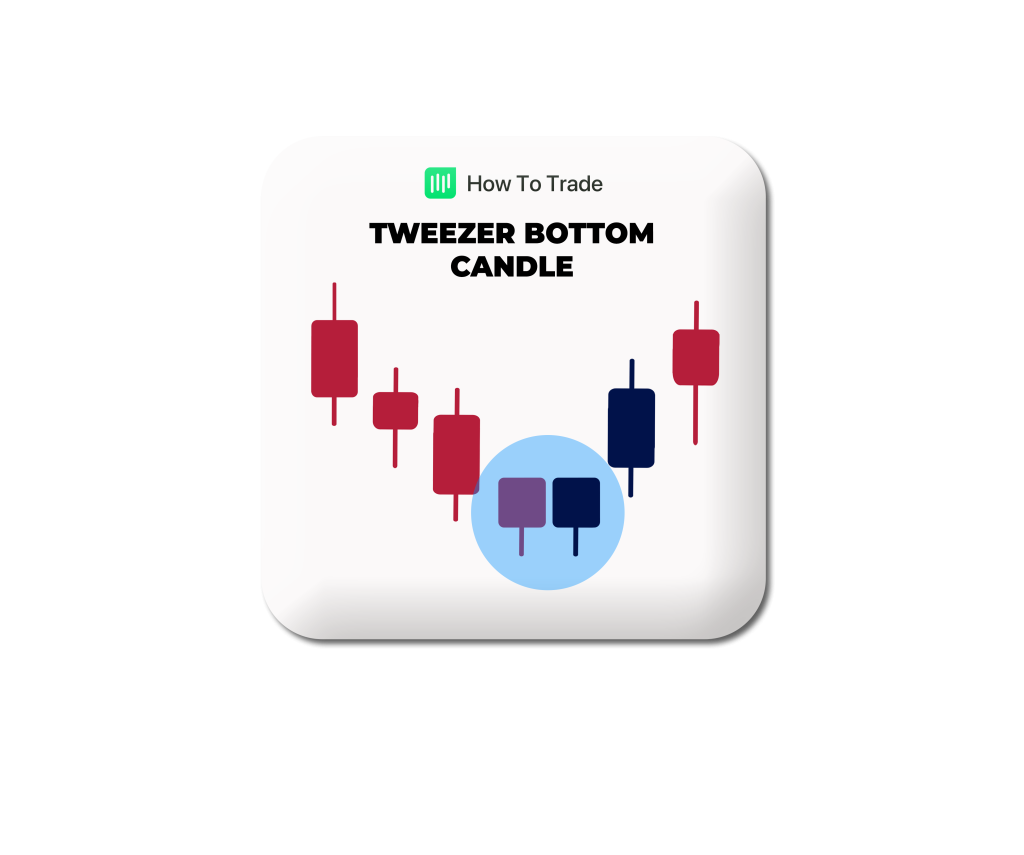
Notice how the candlestick formation looks like a pair of tweezers, where it derives its name!
Chart Formation on Forex Chart
The following image shows a more comprehensive chart that contains the tweezer bottom candlestick pattern.

2.2. What is a Tweezer Top Candlestick Pattern?
A Tweezer top candlestick pattern is a bearish reversal pattern that forms at the top of an uptrend. The first candle in the pair is bullish but rejects higher prices, and the second candle attempts to surge higher but fails. It signals a strong resistance on that level as the market begins to decline or consolidate.
Characteristics of a Tweezer Top Candle
A tweezer top is the opposite of a tweezer bottom as it follows an extended uptrend and signals a reversal downwards. The tweezer top pattern has a bullish first candle with a shadow on top and a second bearish candle of similar body size with a similar shadow on top as well. Like the tweezer bottom, the bodies and shadows of the tweezer top must share the same high, low, open, and close.
Chart Formation
The image below depicts the tweezer top candlestick pattern.
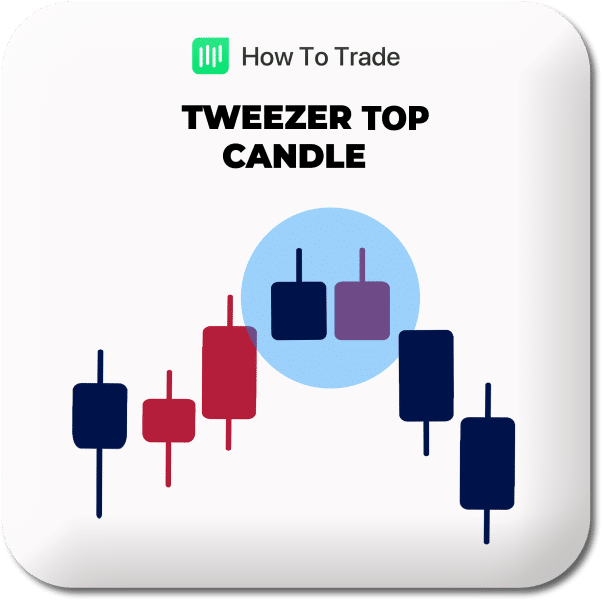
Chart Formation on Forex Chart
The next image shows the tweezer top candlestick pattern on a Forex chart.

To help you remember better, a tweezer top pattern has identical wicks on the “top” of the candles’ bodies, while a tweezer bottom pattern has them on the “bottom.”
Finally, the image below shows the four double candlestick patterns we have discussed.

How to Identify Double Candlestick Patterns
Identifying the overall market trend is crucial in picking out any of the four patterns we have discussed.
- Firstly, identify two candlesticks lying close to each other on your chart
- Then, check the characteristics of the two candlesticks to identify the pattern being formed. You can look for their open, close, high, low, body size, and wick lengths.
- Carefully analyze the pattern to determine that it fits the criteria of your identified pattern in the previous step.
- Confirm your pattern with other technical analysis tools before placing a trade.
Key Takeaways
- The double candlestick patterns consider two adjacent candlesticks in predicting the next price movement.
- The patterns are categorized into two broad types: the bullish and the bearish.
- The bullish and bearish engulfing candlestick patterns and the tweezer tops and bottoms patterns are examples of double candlestick patterns.
- It helps to consider the overall market trend to identify the right pattern correctly.
Conclusion
Double candlestick patterns help predict the future movement of price action. The patterns show the market dynamics and give traders insight into the sentiment other traders hold for an asset. However, validating your analysis with other technical analysis tools, such as volume indicators, moving averages, Fibonacci retracements, and even support and resistance lines, before placing a trade is crucial.
In our next piece, we will look at Candlestick patterns involving more than two candlesticks, the Triple Candlestick Patterns.


Up To $5,000 Credit!
- Trade 1,000’s of global markets.
- 0% deposit and withdrawal fees.
- Rapid funding turn-around times.
- Trade on MetaTrader 4 and 5.