How to Use Japanese Candlesticks with Support and Resistance
In this lesson, we will look at the different candlestick patterns that we explored in the previous sections and show you how to trade them using the support and resistance levels.
But before we get started, remember that no technical analysis tool, including candlestick patterns, can guarantee a reversal or continuation with absolute certainty.
It’s crucial to consider additional factors such as market news and economic data in the Forex market. The market’s nature is fluid and unpredictable.
IMPORTANT: While fundamental, candlestick chart patterns are not infallible. They should not be used in isolation. Always interpret them within the broader context of the market environment and price action.
Using Candlestick Patterns with Support and Resistance
As you might know, support and resistance levels marked on Japanese candlestick charts are crucial for Forex traders. They pinpoint potential turning points in currency pair prices on Forex charts.
Consider a real-world example from a Forex candlestick chart. Here, the chart indicates a resistance level near the 1.4900 mark.
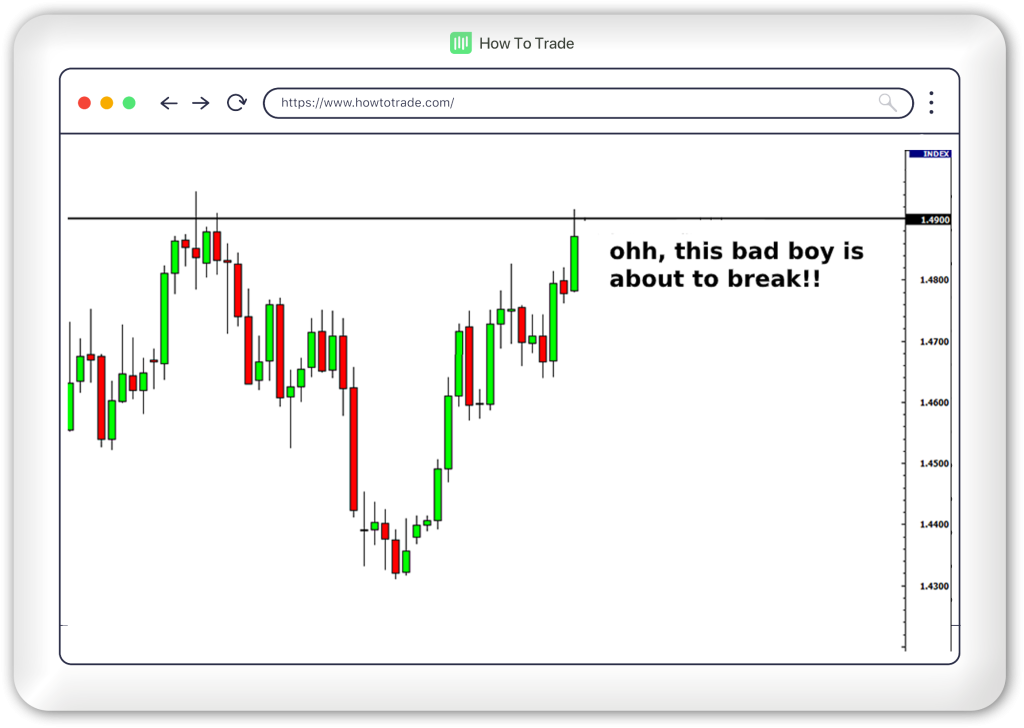
What would YOU do in this situation?
Suppose you’re eager to trade but choose to hold off, noticing that the candle touching this level appears bullish, suggesting a bullish market sentiment.
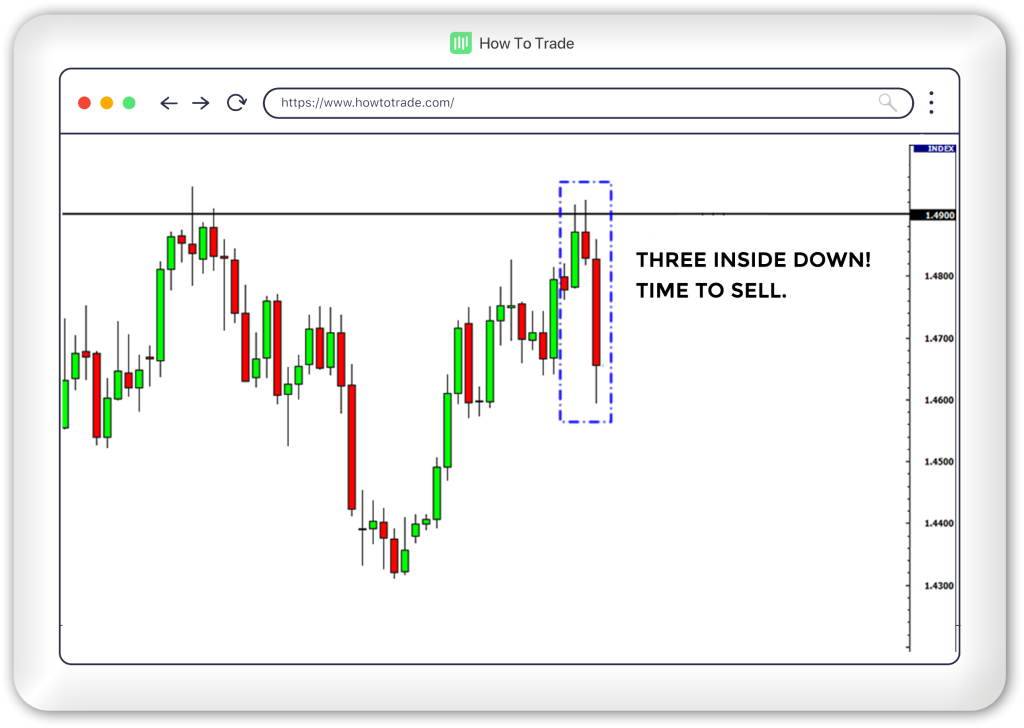
After two more candles, you recognize a ‘three inside down’ candlestick pattern. As an astute trader, you understand this as a bearish signal, indicating selling pressure.
You open a short position by using these bearish reversal patterns as your sell signal confirmation. Your patience and understanding of candlestick patterns significantly tilt the odds in your favor.
So, what happens after you sell? The pair almost immediately goes in your favor and bags you hundreds of pips.
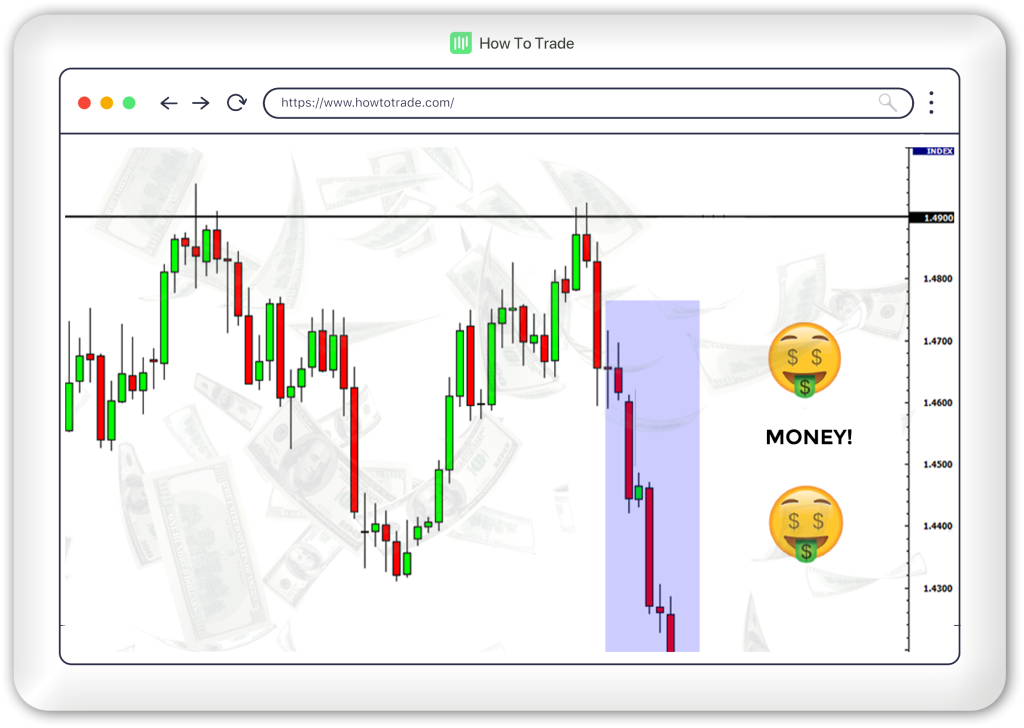
You may be thinking, “Why do I have to pair support and resistance levels with candlesticks?”.
Well, take another look at the same chart of your hypothetical trade. Notice that you would have lost if you traded those candlestick patterns alone.

However, you have increased your odds of winning by simply pairing candlestick formations WITH support and resistance levels as part of your trading plan. The bottom line is that using support and resistance levels is a great technical indicator to predict the price movement of any financial instrument in the forex market.
Key Takeaways
- Candlestick patterns in Forex trading should not be used in isolation; they require context from market conditions and additional technical tools like support and resistance levels.
- Technical analysis tools, including candlestick patterns, do not provide absolute certainty in predicting market movements in Forex.
- Support and resistance levels on Japanese candlestick charts are crucial for identifying potential turning points in currency pair prices.
- Pairing candlestick patterns with support and resistance levels can significantly improve the odds of successful Forex trades.
- Using support and resistance levels in combination with candlestick formations can enhance the accuracy of predicting price movements in the Forex market.


0% Commission Accounts
- Trade 1,000’s of global markets.
- 0% deposit and withdrawal fees.
- Rapid funding turn-around times.
- Trade on MetaTrader 4 and 5.