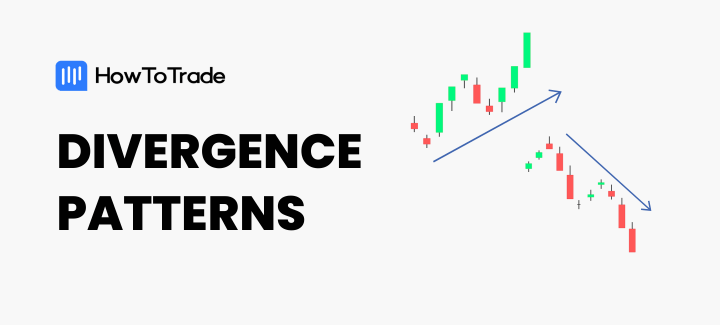
One of the most enduring and effective technical analysis strategies in the trading world is divergence trading. It’s not just an old trick, it’s a powerful tool that can still yield significant results. Divergence in trading is when the price of an asset moves in the opposite direction to an indicator that’s supposed to follow its price movement.
In the rest of this piece, we’ll show you:
- What divergences are
- The divergence trading patterns that there are
- How to trade them
- And some examples to get you started.
 Table of Contents
What is Divergence?
Divergence occurs when the price of an asset moves in one direction while a technical indicator, such as the RSI or MACD, moves in the opposite direction. This difference, or “divergence,” between price and indicator movement suggests that there may be a shift in momentum to signal a change in the trend.
For example, if an asset’s price is making higher highs but the Relative Strength Index indicator is making lower highs, this could indicate that the momentum behind the price increase is weakening. This movement signals a potential trend reversal, even if the price hasn’t yet reflected this change.
Divergence doesn’t always have to be between an asset and an indicator. It can also be between two assets that have correlated price action. EUR/USD and GBP/USD are great examples of currency pairs that are positively correlated. This means that when one rises, the other does the same. But when one rises and the other falls, a divergence occurs.
This asset-asset divergence is not as popular as the asset-indicator divergence because it’s quite trickier to trade. And here’s why:
With indicators, you know that the asset is set to follow the direction of the indicator. But for two currency pairs, how do you know which asset follows and which leads? Also, does this order always remain the same, or does it depend on market conditions?
For the sake of this piece, though, we’ll be focusing on the first kind of divergence.
What are the Types of Divergence Patterns?
There are two primary types of divergence patterns: regular divergence and hidden divergence.
Let’s see what each means:
1. Regular Divergence
Regular divergence often indicates a possible reversal in trend direction, and it comes in two types:
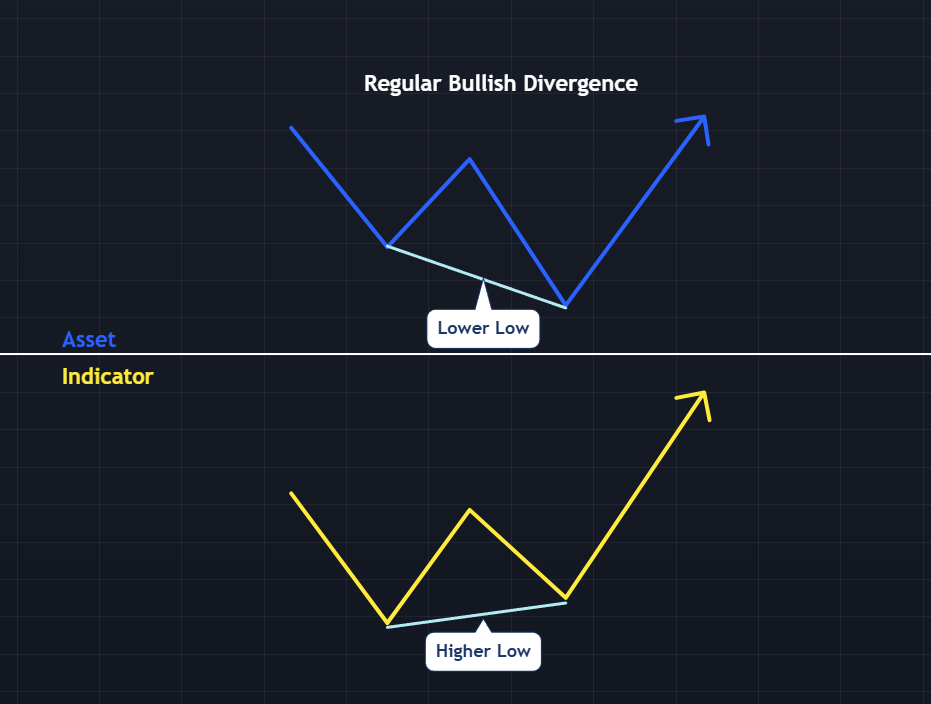
- Regular Bullish Divergence Pattern: This divergence happens when the price forms lower lows, but the indicator forms higher lows. You’ll often find this bullish divergence pattern in a downtrend, signaling downward momentum is weakening and a reversal to the upside may be on the horizon.
- Regular Bearish Divergence Pattern: This divergence occurs during an uptrend when the price makes higher highs while the indicator makes lower highs. It suggests that the upward momentum is fading, and a potential downward reversal could follow.
2. Hidden Divergence
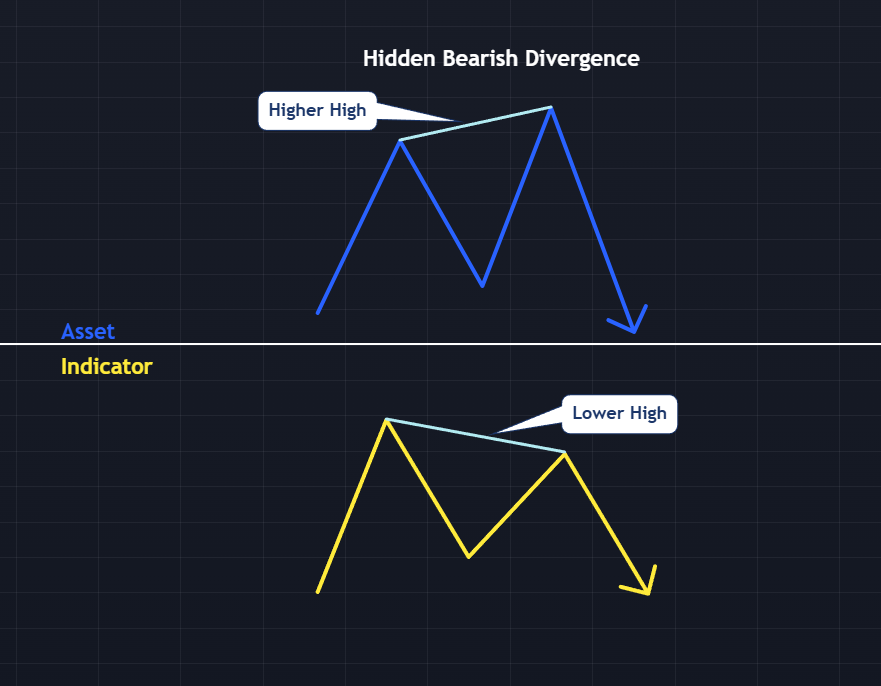
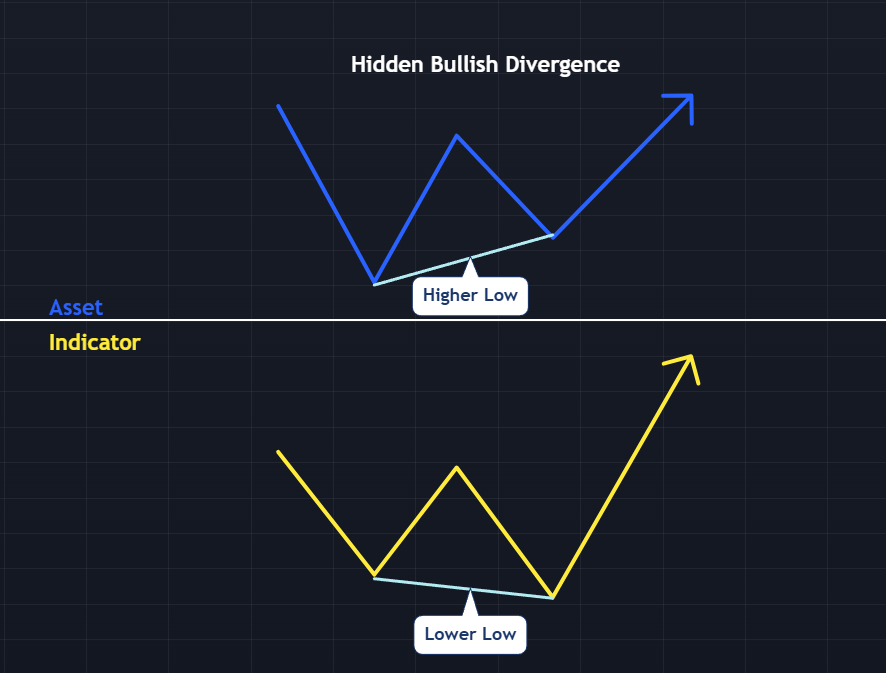
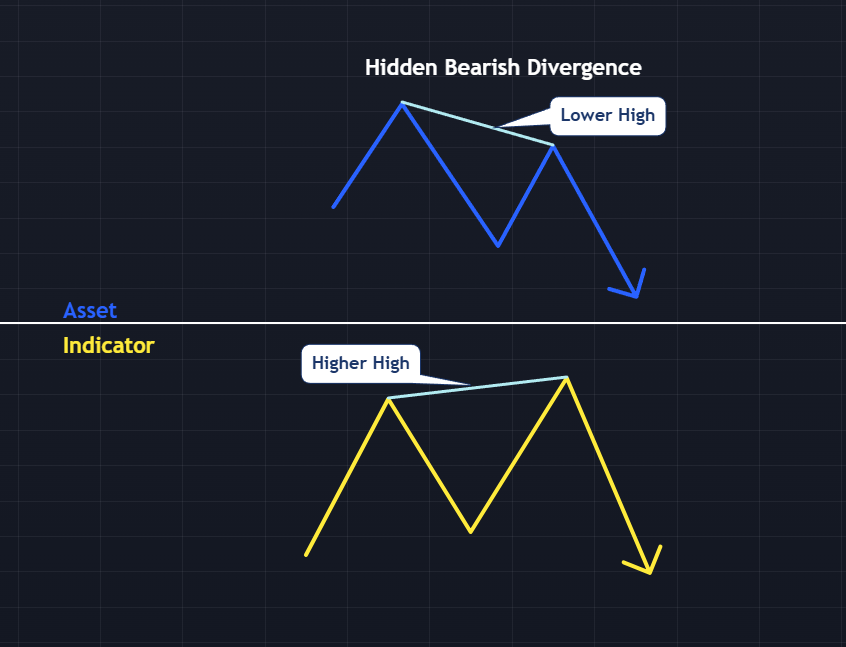
Hidden divergence signals potential trend continuation rather than reversal.
- Hidden Bullish Divergence Pattern: This appears when the price forms higher lows while the indicator creates lower lows. This suggests that the market may continue in an uptrend.
- Hidden Bearish Divergence Pattern: You’ll find this divergence when the price forms lower highs while the indicator forms higher highs. This suggests the potential for the downtrend to continue.
Is this a lot to take in? Download a free Divergence Cheat Sheet from here:
What are the Most Common Indicators for Trading Divergence?
While divergence can be identified with several types of indicators, a few stand out for their effectiveness in capturing divergence patterns due to their sensitivity to momentum changes. Here are some of the most popular indicators traders use to spot both regular and hidden divergences.
1. RSI (Relative Strength Index)
The RSI is one of the most popular tools for identifying divergence, as it oscillates between overbought (above 70) and oversold (below 30) levels. When the price makes higher highs or lower lows while the RSI moves in the opposite direction, this can signal a divergence, suggesting a potential reversal.
Here’s an RSI Divergence cheat sheet to help you spot divergence patterns on the fly:
2. MACD (Moving Average Convergence Divergence)
The MACD is a trend-following indicator that shows the relationship between two moving averages and is often used to spot momentum shifts. Divergence with the MACD occurs when price trends contradict either the MACD line or the MACD histogram’s direction.
Here’s an MACD Divergence cheat sheet to help you spot divergence patterns on the fly:
3. Stochastic Oscillator
The Stochastic Oscillator measures the closing price relative to a range of prices over time, and is highly effective in identifying divergences, especially in range-bound markets. Divergence with the Stochastic Oscillator can signal trend weakness, particularly when it reaches overbought (above 80) or oversold (below 20) levels.
4. CCI (Commodity Channel Index)
The Commodity Channel Index measures price deviation from its average, oscillating between positive and negative levels. It’s useful for spotting divergence, especially in commodity and forex markets where momentum often swings.
5. On-Balance Volume (OBV)
Unlike oscillators, On-Balance Volume tracks volume flow in relation to price movements, helping to confirm trends. Divergence with OBV occurs when price movement diverges from the OBV trend, which can signal potential trend reversals.
Many of the indicators that allow you trade divergence have one thing in common: they are all oscillators. They move up and down a midpoint. So, even if you find an indicator that’s not on this list but oscillates, it can still be used as a divergence trading indicator.
How to Trade Divergence Patterns
Divergences are easy to spot but can be hard to trade. They’re hard to trade because you don’t know when a divergence bias will kick in.
For instance, if you’re getting a regular bullish divergence where the indicator forms a higher low, and your asset forms a lower low, the idea is to buy here. But where and when? Because the price may continue to fall lower for a lot longer than you assume, clearing out whatever stop loss you place in anticipation of the lower low before finally bowing to the bullish divergence bias.
Having said that, here are tips to help you trade divergences:
1. Only Mark Out Significant Highs and Lows
Significant highs and lows on the asset and the indicator are what you should pay attention to. These are the points where the price or the indicator has made a significant peak or trough, indicating a potential shift in momentum. Targeting minor highs and lows is a good way to avoid false trading opportunities. Of course, you’ll have fewer divergence signals to follow, but those signals will have more quality to them.
2. Stick with Hidden Divergences If You’re New
Hidden divergences are continuation divergences. And where do you trade continuations? In a trend. And what’s that thing they say about trends? They are your friends!
As a beginner divergence trader, stick with hidden divergences that help you to trade continuations on existing trends. For instance, if the price is making higher lows while the indicator is making lower lows, this could indicate a hidden bullish divergence and a potential continuation of the uptrend.
This is not to say, though, that Regular divergences don’t work. They do, but they may force you to trade against a trend. You would need a firmer grasp of the overall market picture and risk management techniques to pull them off.
3. Drop to Lower Timeframes to Pick Entries
Lower timeframes give you clearer pictures of things. Not only that, but you also get to spot entry opportunities here.
In the lower timeframe, you want to see a break of structure or a market structure shift in the direction of your divergence bias. This BOS or MSS confirms that the market might be moving in your direction, and you can start scouting for opportunities.
Divergence Trading Examples
Let’s go through these two divergence trading examples together.
GBPUSD and the RSI
Let’s look at this divergence example between the 25th and 28th of October on the 1hr timeframe of the GBPUSD. Notice how the price forms higher highs while the RSI forms lower highs. This is a bearish divergence, and we expect the price to drop.
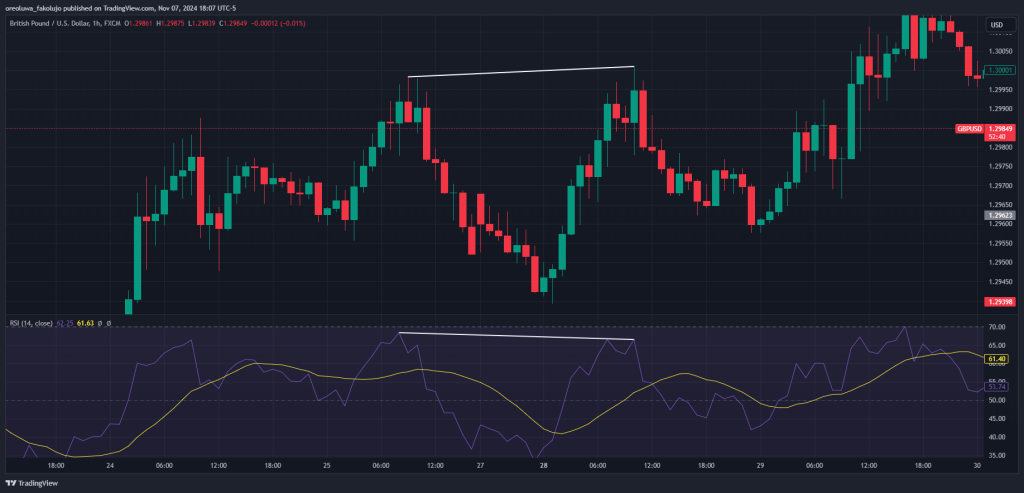
But that’s only a part of the game plan. First, we establish that both highs are significant highs and not minor highs. Then we go to a lower timeframe of 15 minutes. Here, we scout for signs that the price is moving in our direction. And we get it in the form of a market structure shift.
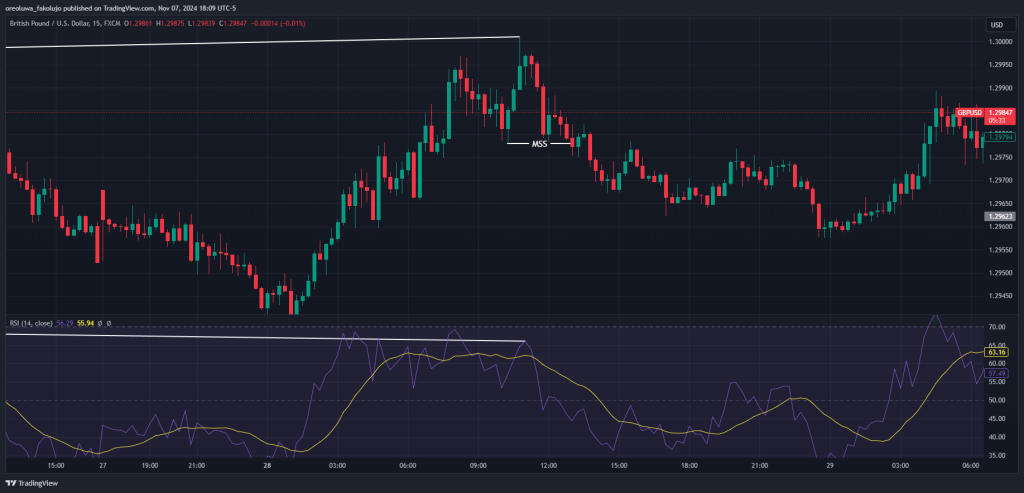
If you don’t wait for this MSS to confirm your bias, chances are that the higher high could continue to rise.
After the MSS, you can take your entry and target a minimum of a 1:1 risk-to-reward ratio.
GBPJPY and Stochastic Oscillator
This next example is a little bit trickier, as there are two potential divergences here. Notice how the GBPJPY price diverges from the Stochastic oscillator. The price forms a higher low while the indicator forms a lower low. That’s the first.
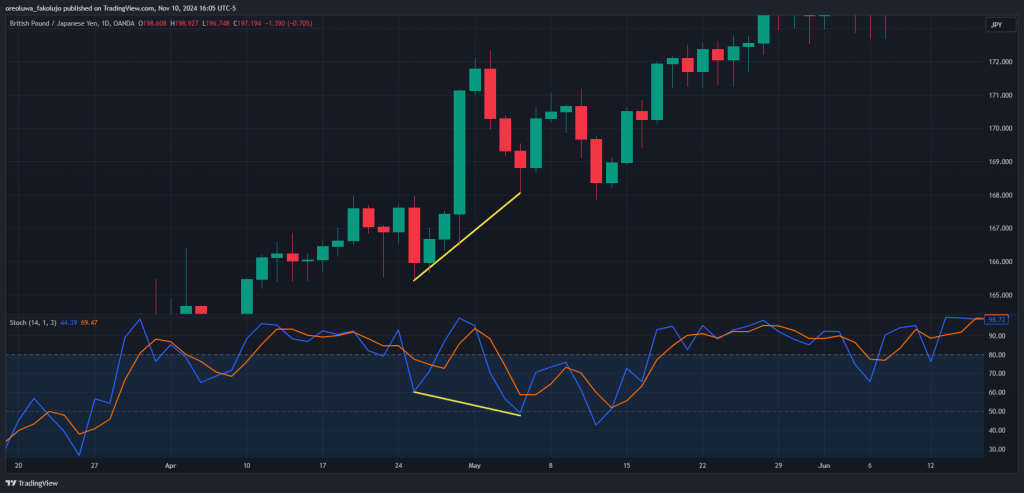
If you look a little bit to the right, you’ll notice another divergence in the same manner, as in the price chart below:
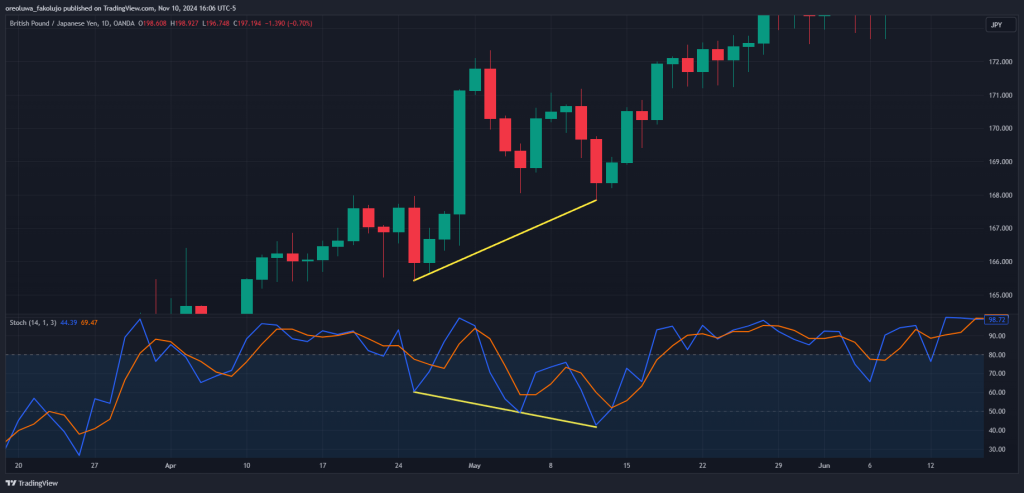
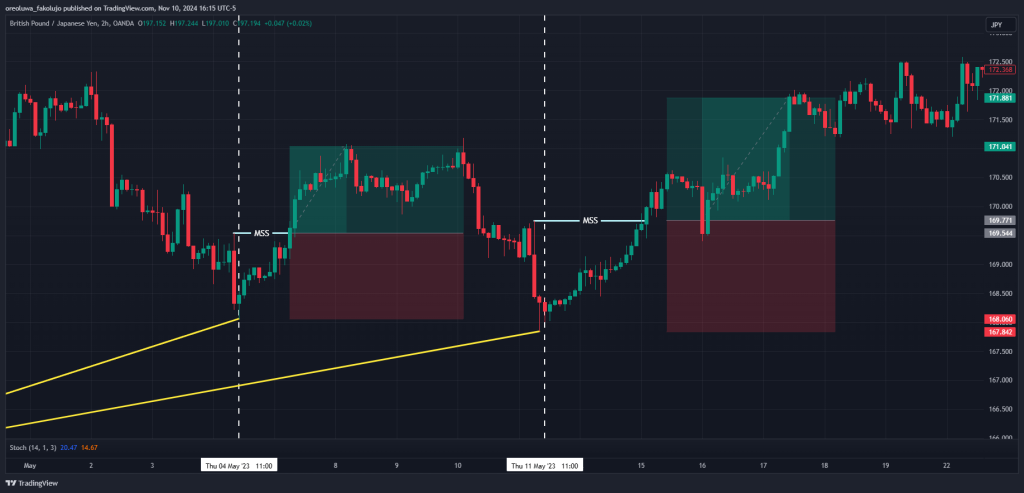
We’ll mark them out with vertical lines to observe how each played out on the 2-hour chart.
For each trade, we only entered a long position when we had a market structure shift. We left our stop losses below the most recent swing lows and targeted a simple 1:1. The first trade barely hit our profit target before reversing to give us the next opportunity. The next one, though, comfortably offers the 1:1.
The Divergence Patterns Free PDF Download
You’re learning about so many divergence patterns, but you don’t have to memorize them all. Here’s a free Divergence Pattern PDF you can always refer to whenever you need it:
Final Words
Bullish and bearish divergence signals tend to be reliable, but it won’t hurt to combine it with other technical analysis tools for extra confirmation.
Risk Disclosure: The information provided in this article is not intended to give financial advice, recommend investments, guarantee profits, or shield you from losses. Our content is only for informational purposes and to help you understand the risks and complexity of these markets by providing objective analysis. Before trading, carefully consider your experience, financial goals, and risk tolerance. Trading involves significant potential for financial loss and isn't suitable for everyone.


