As prices tend to move in waves, many chart patterns are based on price wave movements. One such pattern is the simple ABC correction pattern.
- Prices often move in waves, forming recognizable chart patterns like the Simple ABC Correction Pattern.
- The Simple ABC Correction Pattern provides insights into price wave corrections in the market.
- Utilizing this pattern can enhance your trading strategies during market corrections.
Let’s take a look at what the Simple ABC correction pattern is and how you can identify and trade it.
- What is the simple ABC correction candlestick pattern?
- How to identify and use the simple ABC correction pattern in trading?
- How to trade the simple ABC correction pattern – Trading strategies
- What are the Benefits and Limitations of the Simple ABC correction pattern?
- Key takeaways
- Frequently asked questions (FAQs)
What is the Simple ABC Correction Chart Pattern?
To understand the ABC correction (also known as a flat pattern), first, you have to understand what the correction is all about. In trading, a bullish correction phase happens when the price moves upwards, pulls back, and then finally continues upwards. The opposite, of course, occurs for a bearish ABC correction pattern.
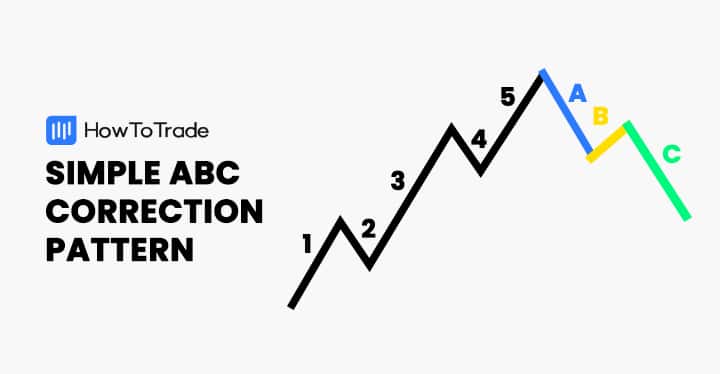
This is what the ABC corrective patterns tell us. These are continuation patterns that occur in an uptrend or downtrend and make three waves that create a corrective phase and help you identify a trend continuation. Now, based on the Elliott wave theory, a flat correction is a three-price wave corrective move labeled as ABC. Each one of the waves is known as the impulse wave, also referred to as a corrective wave.
Technically, in an uptrend, at point A, the price falls. At point B, the price rises, and at the preceding impulse wave C, it drops again. When the simple ABC pattern is complete, you can enter a long buying position. Conversely, in a downtrend, the price goes up at point A, dips at point B, and makes another high at point C before continuing downwards.
So, we can say that in a simple ABC correction pattern, the price creates a zigzag price movement on a chart, and for that reason, it is also called the zigzag correction pattern. Also, when you look at the bigger picture, the simple ABC is part of the Elliott Wave theory. For those unfamiliar with this theory, the Elliott Wave theory suggests that the price action always moves in corrective and motive waves. According to Elliot, the market alternates between the motive and corrective waves, and the corrective wave is where we can find the simple ABC.
It’s also important to remember that there can be a corrective wave within the motive wave. The motive is a five-wave pattern, whereas the corrective is a three-wave pattern. So, when applying the Elliott Wave theory, you can find the simple ABC correction inside the motive wave price movement.
How to Identify the Simple ABC Correction Pattern in Trading?
Identifying the simple ABC is the most crucial step in the trading process, so you must follow these rules to identify the pattern correctly.
- Firstly, the price must pull back at least 10% from the high in an uptrend or low in a downtrend. If the pullback is less than 10%, it is not a valid pattern.
- Secondly, the second wave, B, is the smallest of all the waves.
- Finally, wave C can’t be the shortest of the waves.
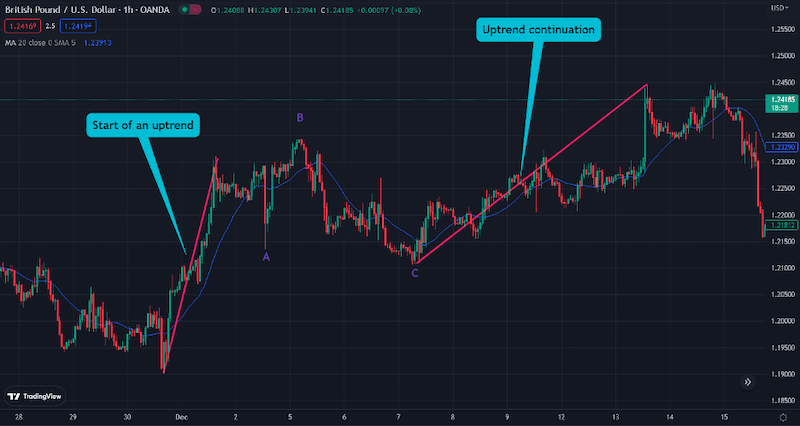
Now, to correctly draw the pattern, you must determine the trend first, wait for the price to make higher lows/lower highs, and then at point C, the pattern is complete, and you can enter a trade. Here’s what the pattern looks like on a chart:
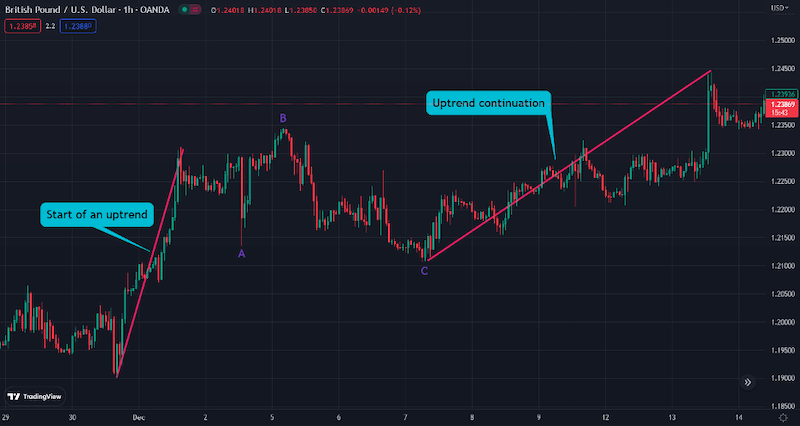
In the GBP/USD chart above, you can see how, following the first uptrend, the price pulls back more than 10%, creating wave A. Then, the price action makes a higher high to develop wave B and then forms a higher low to create wave C. And when the pattern is complete, you see a trend continuation occurs. And this is what the simple ABC pattern is all about.
Keep in mind that between wave B and wave C, there’s usually decreasing volume in the market. This is a crucial rule for a flat correction pattern and may provide another indication for a counter-trend move.
To sum up, here are the steps you need to remember to identify and trade the simple ABC correction pattern.
- Identify the primary impulse move in the market.
- The price must retrace 10% from the first price swing to point A in a downtrend or uptrend.
- The AB wave should be the shortest, and the BC should be the longest.
- After confirming the movement with another technical analysis tool, you should enter the trade at point C.
How to Trade the Simple ABC Corrective Wave Pattern – Trading Strategy
Now that you know how to identify the pattern, let’s discuss how you can trade it. Generally, when trading with the simple ABC pattern, you look for pullbacks rather than breakouts. This means you are looking to join the primary trend, and as such you must know how to trade with multiple time frames.
So, let’s go step-by-step and find out how you can trade with the pattern.
Step 1: Identify the Trend
The first step is to identify the trend. As you can assume, it is a simple process, and in most cases, it will come to you naturally. As a tip that may help identify the trend, you can use trend lines, add moving averages and other momentum technical indicators, or use Fibonacci support and resistance retracement levels. Furthermore, it is best to switch to longer timeframes to recognize the primary trend in the market.
Step 2: Drawing the Simple ABC Trend Lines
After identifying the trend, it’s time to draw the ABC points. Remember that based on the pattern’s rules; the price must pull back at least 10% from the high in an uptrend or from the low in a downtrend. After that, the price moves in the trend direction and makes a point B, which is the shortest wave. After forming B, you need to search for point C, which is the longest of all the waves. You’ll then end up with a corrective wave pattern consisting of three waves.
Step 3: Wait for the Pattern to Be Completed and Use a Technical Indicator to Confirm the Reversal
After the ABC correction pattern is complete, you have to wait for the trend to continue in the same direction as the first trend (that is, before point A). That is the signal to enter a trade. However, you better add another tool as a confluence trading technique to confirm the signal.
As you can see, the chart below shows that after wave C, the price rises above the moving average line, which provides another signal for an entry point. In such a situation, you should enter a trade at point C.
Now, when trading the simple ABC correction pattern, there are two areas where you can enter a trade. The first one is to enter a trade immediately at point C as long as you find another signal that the price is likely to continue in the same direction as the first price swing (RSI, MACD, Fib retracement levels).
The second way is to wait for the price to rise above (or below in a downtrend) the highest level of the first upswing. This is a relatively conservative strategy to trade as once the price rises above this level, it could potentially continue trading in the same direction.
Step 4: Set Stop-Loss and Take-Profit
One of the benefits of the simple ABC pattern is that it enables you to enter a trade with a tight stop-loss. For example, if you decide to enter the trade at C point, you can set the stop loss at the lowest level of the first price swing.
Otherwise, if entering the trade at the uptrend continuation level, you can set the SL at point C. Either way, you can certainly enter a trade with a good risk-reward ratio, especially when the simple ABC pattern is characterized by a strong move following point C.
For take-profit, you better set it at one of the Fibonacci levels above your entry level.
What are the Benefits and Limitations of the Simple ABC Correction Pattern?
Wave zig-zag patterns are among the most complex trading concepts in financial markets, so there are some benefits and risks to using them. Let’s explore some of the pros and cons of using this pattern:
Pros
- You can look for the simple ABC pattern in any market and timeframe
- It provides precise entry and exit points
- Typically, the pattern provides long price movements following point C
- It enables you to set a tight stop loss and, thus, provides an excellent risk-reward ratio
Cons
- The pattern is part of the Elliott Wave theory and can be somehow complicated for beginner traders
- The pattern is less suited for shorter time frames, particularly scalping and day trading
Key Takeaways
Now, let’s check the key takeaways from this article about trading the ABC correction pattern.
- The simple ABC correction is a continuation chart pattern that signals the price is likely to move in the same direction as the previous trend before the ABC corrective wave
- The pattern consists of three points or waves; A, B, and C. The price pulls back at point A, moves with the trend at point B, and then retraces again at point C
- The price must retrace at least 10% from point A to point B. B is the shortest wave, while C is the longest of all the waves
- The ABC pattern is a form of Elliott Wave theory, which suggests that the market moves in corrective and motive waves. The corrective is a three-wave pattern, while the motive is a five-wave pattern
- To trade the simple ABC correction pattern, you should enter at point C or once the price breaks above or below the highest or lowest level of the first price swing (depending if bearish or bullish)
Frequently Asked Questions (FAQs)
Here are the most frequently asked questions about the ABC correction chart pattern:
What is the 5-3 corrective wave pattern?
According to the Elliot principle, the corrective pattern has five types; impulse (5-3-5-3-5), diagonal, zigzag (ABC), flat (3-3-5), and triangle (3-3-3-3). The 5-3-5 corrective wave pattern implies a single zigzag pattern and suggests that within the corrective ABC, there is a motive wave consisting of 1,2,3,4 and 5 waves.
According to the 5-3 corrective wave pattern, the 5-wave trends are corrected by 3-wave countertrends. When this happens, the trend will likely continue in the direction of the previous trend.
What happens after the ABC corrective wave pattern?
After the formation of the simple ABC corrective pattern, a trend continuation of the initial price swing before the ABC correction pattern is likely to occur.
What is the main difference between ABC and WXY corrective wave patterns?
ABC and WXY are both corrective Elliott wave patterns. In the ABC, we have the 5-3-5 structure, while in the WXY, we have the 3-3-3 structure. It means that within WXY, there is an ABC corrective wave.
In addition, the WXY usually appears in a sideways movement market, while the ABC forms during a trend.
Risk Disclosure: The information provided in this article is not intended to give financial advice, recommend investments, guarantee profits, or shield you from losses. Our content is only for informational purposes and to help you understand the risks and complexity of these markets by providing objective analysis. Before trading, carefully consider your experience, financial goals, and risk tolerance. Trading involves significant potential for financial loss and isn't suitable for everyone.